
Pandas-02-DataFrame运算
1. 算术运算
-
add(other)
比如进行数学运算加上一个具体数字
data["open"].add(10) # open列加10 # data["open"] + 10 # 一般不这么写 -
sub(other)
用法同add
2. 逻辑运算
2.1. 逻辑运算符号
-
逻辑运算类型:>, >=, <, <=, ==, !=
-
复合逻辑运算:&, |, ~ (与,或,非)
-
筛选data["open"] > 23的日期数据
# 返回逻辑结果
data["open"] > 20

2018-02-27     True
2018-02-26     True
2018-02-23     True
2018-02-22     True
2018-02-14     True
# 通过逻辑结果筛选数据 data[data["open"] > 23].head() -
多个逻辑判断
data[(data["open"]>23) & (data["open"] < 24)].head()
2.2. 逻辑运算函数
-
query(expr):直接得出结果数据
- expr:查询字符串
通过query使刚才的过程更加方便简洁:
data.query("open>23 & open<24").head() -
isin(values):生成bool系列,还需要索引才能得出数据
- values:列表,筛选出存在于该列表中的数据
例如筛选出"open"列值为23.23和23.71的数据
data[data["open"].isin([23.23, 23.71])]
3. 统计运算
3.1. describe
综合分析:直接得出很多结果,count,mean,std,min,max等
# 计算数量,平均值,标准差,最小值,最大值
data.describe()

3.2. 统计函数
| count | Number of non-NA observations 每列或每行的非NA单元数量 |
|---|---|
| sum | Sum of values 求和 |
| mean | Mean of values 平均值 |
| median | Arithmetic median of values 中位数 |
| min | Minimum 最小值 |
| max | Maximum 最大值 |
| mode | Mode 众数 |
| abs | Absolute Value 绝对值 |
| prod | Product of values 所有元素的乘积 |
| std | Bessel-corrected sample standard deviation 标准差 |
| var | Unbiased variance 无偏方差,均方差 |
| idxmax | compute the index labels with the maximum 最大值的索引 |
| idxmin | compute the index labels with the minimum 最小值的索引 |
坐标轴默认按照列“columns”(axis=0, default),如果要指定对行“index”需要指定(axis=1)
-
max()、min()
data.max() open 34.99 high 36.35 close 35.21 low 34.01 volume 501915.41 price_change 3.03 p_change 10.03 turnover 12.56 data.min() # 与max类似 -
median()
如果没有中位数,取中间两个数的平均值
3.3. 累计统计函数
| 函数 | 说明 |
|---|---|
| cumsum | 计算前1/2/3/.../n个数的和 |
| cummax | 计算前1/2/3/.../n个数的最大值 |
| cummin | 计算前1/2/3/.../n个数的最小值 |
| cumprod | 计算前1/2/3/.../n个数的积 |
这些函数可以对series和dataframe操作
例如统计股票"p_change"变化情况:
-
排序(按照时间先后进行累计)
data = data.sort_index() -
对p_change列进行累计求和
stock_rise = data["p_change"] stock_rise.cumsum() 2015-03-02 2.62 2015-03-03 4.06 2015-03-04 5.63 2015-03-05 7.65 2015-03-06 16.16 ... 2018-02-14 112.59 2018-02-22 114.23 2018-02-23 116.65 2018-02-26 119.67 2018-02-27 122.35 Name: p_change, Length: 643, dtype: float64 -
通过折线图展示
使用
plot函数需要导入matplotlib.import matplotlib.pyplot as plt # 用plot显示图形 stock_rise.cumsum().plot() # 需要调用show才能显示 plt.show()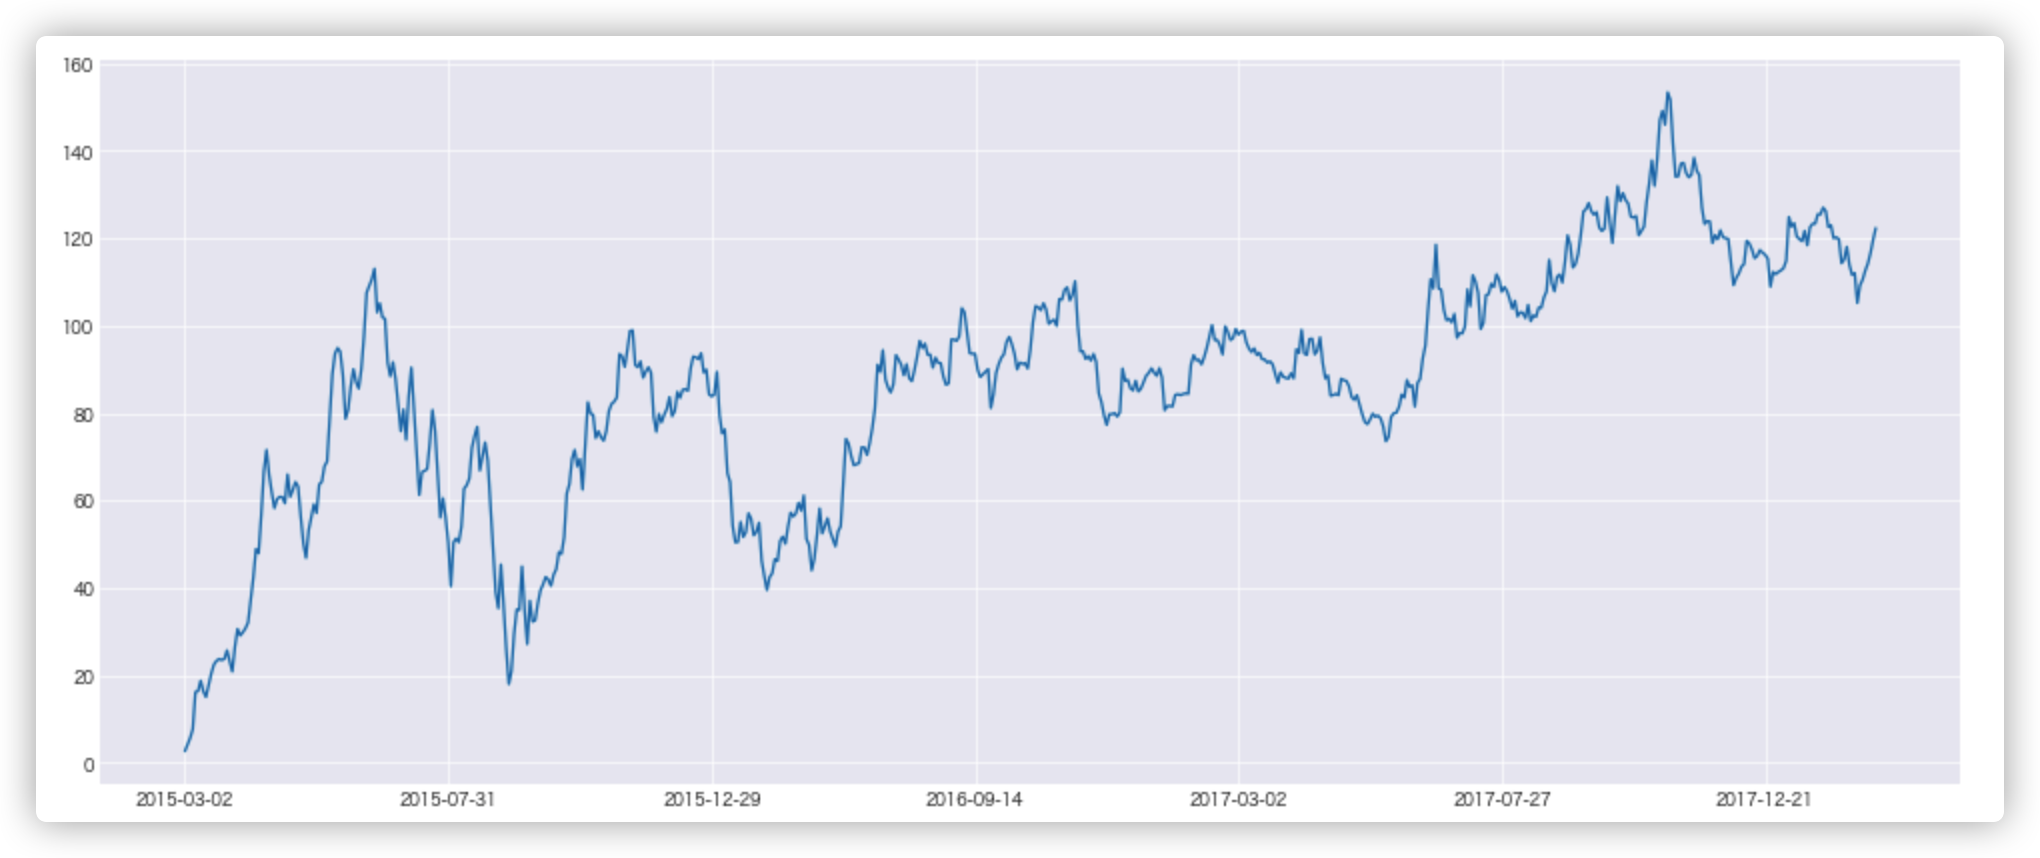
画图函数说明:
DataFrame.plot(kind='line')- kind: str,需要绘制图形的种类
- 'line': line plot (default)
- 'bar': vertical bar plot
- 'barh': horizontal bar plot
- 'hist': histogram
- 'pie': pie plot
- 'scatter': scatter plot
- kind: str,需要绘制图形的种类
4. 自定义运算
-
apply(func, axis=0)
- func: 自定义函数
- axis=0: 默认列,1为行
data[["open", "close"]].apply(lambda x: x.max() - x.min(), axis=0)
open     22.74
close    22.85
dtype: float64

 浙公网安备 33010602011771号