echarts玫瑰图,半圈半圆,比例
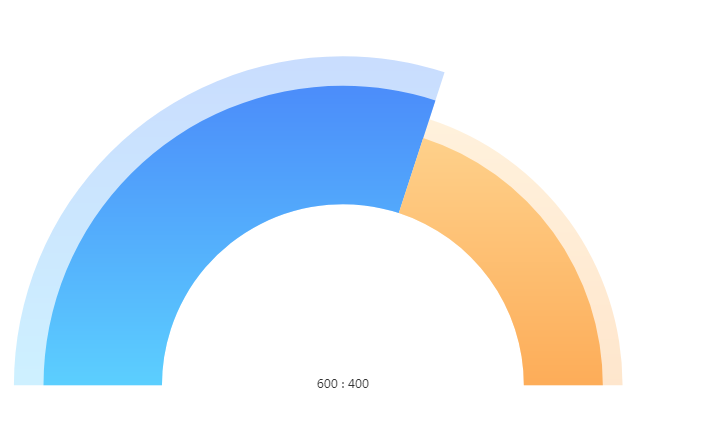
// EUI.include("vfs/root/echarts/echarts2.js");

var getxb1 = 600; //男生人数
var getxb2 = 400; //女生人数
// var xbzb = [6, 4];

var rich = {
    name: {
        color: 'red',
        fontSize: 130,
        padding: [6, 100],
        align: 'left',
    },
    percent: {
        color: '#656565',
        align: 'center',
        fontSize: 103,
        padding: [5, 10],
    },
    hr: {
        borderColor: '#C8C8C8',
        width: '100%',
        borderWidth: 0.5,
        height: 0,
    },
};

option = {
    title: {
        show: true,
        left: '45%',
        bottom: '25%',
        // text: '6 : 4',
        textAlign: 'center',
        textStyle: {
            fontWeight: '600',
            fontSize: '28',
            color: '#000',
        },
    },
    tooltip: {
        show: false,
    },
    // legend: {
    //     orient: 'vertical',
    //     x: 'left',
    //     data: xbzb,
    // },
    series: [
        {
            name: '性别分布',
            type: 'pie',
            radius: ['55%', '115%'],
            startAngle: 180,
            center: ['45%', '83%'],
            roseType: 'radius',
            labelLine: {
                show: false,
                // normal: {
                //     length: 20,
                //     length2: 0,
                //     lineStyle: {
                //         color: '#C8C8C8'
                //     }
                // }
            },
            label: {
                normal: {
                    show: true,
                    position: 'center',
                    textStyle: {
                        fontSize: '12px',
                        padding: [-20, 0, 0, 0],
                    },
                    // formatter: ['{c}'].join('\n'),
                    // formatter: ['{c}'] + ' : '['{}'],
                    formatter: function (params) {
                        var proportion = '';
                        for (var i = 0; i < option.series[0].data.length - 1; i++) {
                            // console.log(option.series[0].data);
                            if (i === 0) {
                                proportion = proportion + option.series[0].data[i].value.toString();
                            } else {
                                proportion = proportion + ' : ' + option.series[0].data[i].value.toString();
                            }
                        }
                        return proportion;
                    },
                },
                position: 'center',
                show: true,
            },
            // label: {
            //     show: true,
            //     formatter: ['{c}'].join('\n'),
            //     fontSize: '30',
            //     padding: [20, 0, 0, 0],
            //     fontWeight: 'bold',
            // },
            // label: {
            //     normal: {
            //         formatter: params => {
            //              return '{percent|' + params.value + '人}  {percent|' + xbzb[params.dataIndex] + '%} '
            //         },
            //         rich: rich,
            //         distanceToLabelLine: 0,
            //         padding: [-2, -4, 0, -4],
            //     },
            //     emphasis: {
            //         //中间文字显示
            //         show: true,
            //     },
            // },

            data: [
                {
                    value: getxb1,
                    // name: "男生",
                    itemStyle: {
                        normal: {
                            color: new echarts.graphic.LinearGradient(
                                0,
                                0,
                                0,
                                1,
                                [
                                    {
                                        offset: 0,
                                        color: '#4C8DFA',
                                    },
                                    {
                                        offset: 1,
                                        color: '#5CCFFF',
                                    },
                                ],
                                false
                            ),
                        },
                    },
                },
                {
                    value: getxb2,
                    // name: "女生",
                    itemStyle: {
                        normal: {
                            color: new echarts.graphic.LinearGradient(
                                0,
                                0,
                                0,
                                1,
                                [
                                    {
                                        offset: 0,
                                        color: '#FFD18B',
                                    },
                                    {
                                        offset: 1,
                                        color: '#FDAD59',
                                    },
                                ],
                                false
                            ),
                        },
                    },
                },
                {
                    value: getxb1 + getxb2,
                    name: '',
                    label: {
                        show: false,
                    },
                    labelLine: {
                        show: false,
                    },
                    itemStyle: {
                        normal: {
                            color: 'transparent',
                            borderWidth: 0,
                            shadowBlur: 0,
                        },
                    },
                },
            ],
        },
        {
            type: 'pie',
            radius: ['55%', '130%'],
            startAngle: 180,
            hoverAnimation: false,
            center: ['45%', '83%'],
            roseType: 'radius',
            labelLine: {
                normal: {
                    show: false,
                },
            },
            data: [
                {
                    value: getxb1,
                    itemStyle: {
                        normal: {
                            color: new echarts.graphic.LinearGradient(
                                0,
                                0,
                                0,
                                1,
                                [
                                    {
                                        offset: 0,
                                        color: 'rgba(76,141,250,.3)',
                                    },
                                    {
                                        offset: 1,
                                        color: 'rgba(92,207,255,.3)',
                                    },
                                ],
                                false
                            ),
                        },
                    },
                },
                {
                    value: getxb2,
                    itemStyle: {
                        normal: {
                            color: new echarts.graphic.LinearGradient(
                                0,
                                0,
                                0,
                                1,
                                [
                                    {
                                        offset: 0,
                                        color: 'rgba(255,209,139,.3)',
                                    },
                                    {
                                        offset: 1,
                                        color: 'rgba(253,173,89,.3)',
                                    },
                                ],
                                false
                            ),
                        },
                    },
                },
                {
                    value: getxb1 + getxb2,
                    name: '',
                    label: {
                        show: false,
                    },
                    labelLine: {
                        show: false,
                    },
                    itemStyle: {
                        normal: {
                            color: 'transparent',
                            borderWidth: 0,
                            shadowBlur: 0,
                            borderColor: 'transparent',
                            shadowColor: 'transparent',
                        },
                    },
                },
            ],
            z: -1,
        },
    ],
};
return option;


posted on 2022-08-23 14:56  facenano  阅读(283)  评论(0编辑  收藏  举报