Kubernetes Fluentd+Elasticsearch+Kibana统一日志管理平台搭建的填坑指南
在初步完成Kubernetes集群架构的建立后,通过搭建一些监控组件,我们已经能够实现
- 图形化的监控每个node,pod的状态信息和资源情况
- 通过scale进行replicateSet的扩展和伸缩
- 通过kubectl logs 或dashboard去查看每个Pod的运行日志
但是,在分布式架构中节点的规模往往是很庞大的,一个典型的生产环境可能有几十上百个minion节点,在这种情况下就需要建立一套集中的日志监控和管理系统,在本人前期的思考中,也想通过volumn外挂到存储的方式实现weblogic的日志输出到共享存储,但这种方式的问题在于:
- 我们通过WebLogic单域的模式进行Docker的扩展服务, 这就意味着所有的日志路径和名字都是一致的,也就是都存放在pod的container节点的统一的路径下(/u01/oracle/user_projects/domains/base_domain/servers/AdminServer/logs/AdminServer.log),如果通过volumnMount映射到存储,会存在文件的冲突问题.
- 无法获取pod和container的信息
- 无法获取集群中其他节点的运行信息
因此还是需要寻找平台级别的架构方案.在kubernetes的官方文档中,https://kubernetes.io/docs/concepts/cluster-administration/logging/
Kubernetes给出了几种日志方案,并给出Cluster-level logging的参考架构:
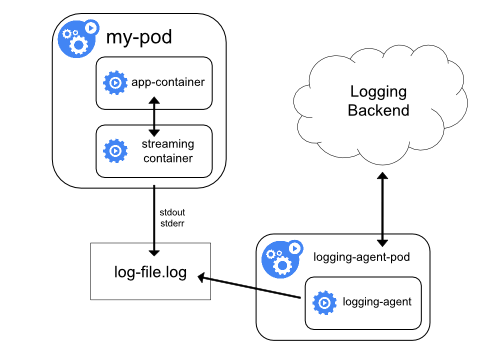
也就是说,我们自己启动运行的Pod的内部容器进程通过streaming的方式把日志输出到minion主机,然后由运行在相同主机的另外一个pod,logging-agent-pod把日志获取到,同时把日志传回Backend, Bankend实际上是基于不同的实现,比如Elasticsearch-logging,以及展示的kibana平台。
Kubernetes建议采用这种结点级别的logging-agent,并提供了其中的两种,一种用于Google Cloud Platform的Stackdriver Logging,另一种就是Elasticsearch,两种都是采用fluentd做为在结点上运行的Agent(日志代理)
Using a node-level logging agent is the most common and encouraged approach for a Kubernetes cluster, because it creates only one agent per node, and it doesn’t require any changes to the applications running on the node. However, node-level logging only works for applications’ standard output and standard error.
Kubernetes doesn’t specify a logging agent, but two optional logging agents are packaged with the Kubernetes release: Stackdriver Logging for use with Google Cloud Platform, and Elasticsearch. You can find more information and instructions in the dedicated documents. Both use fluentd with custom configuration as an agent on the node.
好了,下文便开始我们的填坑指南
1. 准备工作
- 先交代一下环境
操作系统: CentOS 7.3
Kubernetes version: 1.5
[root@k8s-master fluentd-elasticsearch]# kubectl version
Client Version: version.Info{Major:"1", Minor:"5", GitVersion:"v1.5.2", GitCommit:"a55267932d501b9fbd6d73e5ded47d79b5763ce5", GitTreeState:"clean", BuildDate:"2017-04-14T13:36:25Z", GoVersion:"go1.7.4", Compiler:"gc", Platform:"linux/amd64"}
Server Version: version.Info{Major:"1", Minor:"5", GitVersion:"v1.5.2", GitCommit:"a55267932d501b9fbd6d73e5ded47d79b5763ce5", GitTreeState:"clean", BuildDate:"2017-04-14T13:36:25Z", GoVersion:"go1.7.4", Compiler:"gc", Platform:"linux/amd64"}
- 将github中kubernetes代码都下栽到master本地。
git clone https://github.com/kubernetes/kubernetes
- 配置ServiceAccount,这是因为之后下载的fluentd images需要用到SSL的方式去连接API Server,如果不准备修改并生成新的images的话,还是需要配置好, 配置指南参考
http://www.cnblogs.com/ericnie/p/6894688.html
- 配置dns,kibana组件需要通过dns找到elasticsearch-logging的Service,如果不配置dns,那就需要修改kibana-controller.yaml中的地址为固定的service ip,配置指南参考
http://www.cnblogs.com/ericnie/p/6897142.html
- 下载images
进入/root/kubernetes/cluster/addons/fluentd-elasticsearch目录,看到所有的yaml文件
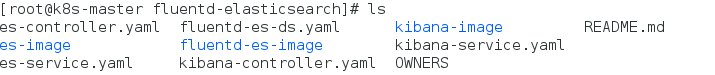
其中fluentd-es-ds.yaml用于构建运行在每个结点的fluentd DamonSet负责logging Agent角色,es-controller.yaml和es-service.yaml用于构建elasticsearch logging,负责logging backend的日志汇总,而kibana-controller和kibana-service用于展示
把几个conroller.yaml文件中的images下载到各个minion节点
docker pull gcr.io/google_containers/elasticsearch:v2.4.1-2
docker pull gcr.io/google_containers/fluentd-elasticsearch:1.22
docker pull gcr.io/google_containers/kibana:v4.6.1-1
2.启动fluentd DaemonSet
- 打Label(坑1)
Fluentd会运行在每一个minion节点上,通过
# kubectl create -f fluentd-es-ds.yaml
daemonset "fluentd-es-v1.22" created
然后在minion节点上通过tail -f /var/log/fluentd.log中查看,结果在minion节点上根本没有fluentd.log文件啊!
笔者通过
kubectl get pods -n kube-system
看了一下,发现根本没有fluentd相关的Pod在运行或者在pending! :(
通过
kubectl get -f fluentd-es-ds.yaml
NAME DESIRED CURRENT READY UP-TO-DATE AVAILABLE NODE-SELECTOR
AGE fluentd-es-v1.22 0 0 0 0 0 beta.kubernetes.io/fluentd-ds-ready=true 2m
查看一下,发现有个NODE-SELECTOR(正常的如下),beta.kubernetes.io/fluentd-ds-ready=true

再
kubectl describe nodes k8s-node-1
发现我的minion节点根本没有这个Label,通过命令打label
kubectl label node k8s-node-1 beta.kubernetes.io/fluentd-ds-ready=true
重新create后,就发现在k8s-node-1中已经存在/var/log/fluentd.log文件了.
- 创建configmap(坑2)
# tail -f /var/log/fluentd.log

2017-03-02 02:27:01 +0000 [info]: reading config file path="/etc/td-agent/td-agent.conf"
2017-03-02 02:27:01 +0000 [info]: starting fluentd-0.12.31
2017-03-02 02:27:01 +0000 [info]: gem 'fluent-mixin-config-placeholders' version '0.4.0'
2017-03-02 02:27:01 +0000 [info]: gem 'fluent-mixin-plaintextformatter' version '0.2.6'
2017-03-02 02:27:01 +0000 [info]: gem 'fluent-plugin-docker_metadata_filter' version '0.1.3'
2017-03-02 02:27:01 +0000 [info]: gem 'fluent-plugin-elasticsearch' version '1.5.0'
2017-03-02 02:27:01 +0000 [info]: gem 'fluent-plugin-kafka' version '0.4.1'
2017-03-02 02:27:01 +0000 [info]: gem 'fluent-plugin-kubernetes_metadata_filter' version '0.24.0'
2017-03-02 02:27:01 +0000 [info]: gem 'fluent-plugin-mongo' version '0.7.16'
2017-03-02 02:27:01 +0000 [info]: gem 'fluent-plugin-rewrite-tag-filter' version '1.5.5'
2017-03-02 02:27:01 +0000 [info]: gem 'fluent-plugin-s3' version '0.8.0'
2017-03-02 02:27:01 +0000 [info]: gem 'fluent-plugin-scribe' version '0.10.14'
2017-03-02 02:27:01 +0000 [info]: gem 'fluent-plugin-td' version '0.10.29'
2017-03-02 02:27:01 +0000 [info]: gem 'fluent-plugin-td-monitoring' version '0.2.2'
2017-03-02 02:27:01 +0000 [info]: gem 'fluent-plugin-webhdfs' version '0.4.2'
2017-03-02 02:27:01 +0000 [info]: gem 'fluentd' version '0.12.31'
2017-03-02 02:27:01 +0000 [info]: adding match pattern="fluent.**" type="null"
2017-03-02 02:27:01 +0000 [info]: adding filter pattern="kubernetes.**" type="kubernetes_metadata"
2017-03-02 02:27:02 +0000 [error]: config error file="/etc/td-agent/td-agent.conf" error="Invalid Kubernetes API v1 endpoint https://192.168.0.105:443/api: 401 Unauthorized"
2017-03-02 02:27:02 +0000 [info]: process finished code=256
2017-03-02 02:27:02 +0000 [warn]: process died within 1 second. exit.
发现fluentd image是通过443端口去连我的ApiServer的,API Server开启了安全机制,因此需要配置ca_file、client_cert、client_key等key,如果不想重新做images,Kubernetes提供了ConfigMap这一强大的武器,我们可以将新版td-agent.conf制作成kubernetes的configmap资源,并挂载到fluentd pod的相应位置以替换image中默认的td-agent.conf。
td-agent.conf的目录是
/root/kubernetes/cluster/addons/fluentd-elasticsearch/fluentd-es-image
加入ca,client等后如
// td-agent.conf
... ...
<filter kubernetes.**>
  type kubernetes_metadata
  ca_file /srv/kubernetes/ca.crt
  client_cert /srv/kubernetes/kubecfg.crt
  client_key /srv/kubernetes/kubecfg.key
</filter>
... ...
需要注意的是
- 在基于td-agent.conf创建configmap资源之前,需要将td-agent.conf中的注释行都删掉,建议先备份一份(后来发挥了作用)
- fluentd pod将创建在kube-system下,因此configmap资源也需要创建在kube-system namespace下面,否则kubectl create无法找到对应的configmap。
# kubectl create configmap td-agent-config --from-file=./td-agent.conf -n kube-system
configmap "td-agent-config" created

# kubectl get configmaps td-agent-config -o yaml
apiVersion: v1
data:
  td-agent.conf: |
    <match fluent.**>
      type null
    </match>

    <source>
      type tail
      path /var/log/containers/*.log
      pos_file /var/log/es-containers.log.pos
      time_format %Y-%m-%dT%H:%M:%S.%NZ
      tag kubernetes.*
      format json
      read_from_head true
    </source>
... ...
fluentd-es-ds.yaml也要随之做一些改动,主要是增加两个mount:
一个是mount 上面的configmap td-agent-config
另外一个就是mount hostpath:/srv/kubernetes以获取到相关client端的数字证书:
[root@k8s-master fluentd-elasticsearch]# cat fluentd-es-ds.yaml
apiVersion: extensions/v1beta1
kind: DaemonSet
metadata:
  name: fluentd-es-v1.22
  namespace: kube-system
  labels:
    k8s-app: fluentd-es
    kubernetes.io/cluster-service: "true"
    addonmanager.kubernetes.io/mode: Reconcile
    version: v1.22
spec:
  template:
    metadata:
      labels:
        k8s-app: fluentd-es
        kubernetes.io/cluster-service: "true"
        version: v1.22
      # This annotation ensures that fluentd does not get evicted if the node
      # supports critical pod annotation based priority scheme.
      # Note that this does not guarantee admission on the nodes (#40573).
      annotations:
        scheduler.alpha.kubernetes.io/critical-pod: ''
    spec:
      containers:
      - name: fluentd-es
        image: gcr.io/google_containers/fluentd-elasticsearch:1.22
        command:
          - '/bin/sh'
          - '-c'
          - '/usr/sbin/td-agent 2>&1 >> /var/log/fluentd.log'
        resources:
          limits:
            memory: 200Mi
          requests:
            cpu: 100m
            memory: 200Mi
        volumeMounts:
        - name: varlog
          mountPath: /var/log
        - name: varlibdockercontainers
          mountPath: /var/lib/docker/containers
          readOnly: true
        - name: td-agent-config
          mountPath: /etc/td-agent
        - name: tls-files
          mountPath: /srv/kubernetes
      nodeSelector:
        beta.kubernetes.io/fluentd-ds-ready: "true"
      terminationGracePeriodSeconds: 30
      volumes:
      - name: varlog
        hostPath:
          path: /var/log
      - name: varlibdockercontainers
        hostPath:
          path: /var/lib/docker/containers
      - name: td-agent-config
        configMap:
          name: td-agent-config
      - name: tls-files
        hostPath:
          path: /srv/kubernetes
[root@k8s-master fluentd-elasticsearch]#
再次创建fluent-es-ds.yaml,然后看minion的/var/log/fluentd.log
......
    client_cert /srv/kubernetes/kubecfg.crt
    client_key /srv/kubernetes/kubecfg.key
  </filter>
  <match **>
    type elasticsearch
    log_level info
    include_tag_key true
    host elasticsearch-logging
    port 9200
    logstash_format true
    buffer_chunk_limit 2M
    buffer_queue_limit 32
    flush_interval 5s
    max_retry_wait 30
    disable_retry_limit
    num_threads 8
  </match>
</ROOT>
出现这个基本算是成功了,貌似没问题吧,其实有个坑,可以接下来继续配置elasticsearch log.
3.配置elasticsearch
创建elasticsearch,
# kubectl create -f es-controller.yaml
replicationcontroller "elasticsearch-logging-v1" created

# kubectl create -f es-service.yaml
service "elasticsearch-logging" created

get pods:

kube-system                  elasticsearch-logging-v1-3bzt6          1/1       Running    0          7s        172.16.57.8    10.46.181.146
kube-system                  elasticsearch-logging-v1-nvbe1          1/1       Running    0          7s        172.16.99.10   10.47.136.60
查看日志
# kubectl logs -f elasticsearch-logging-v1-3bzt6 -n kube-system
F0302 03:59:41.036697       8 elasticsearch_logging_discovery.go:60] kube-system namespace doesn't exist: the server has asked for the client to provide credentials (get namespaces kube-system)
goroutine 1 [running]:
k8s.io/kubernetes/vendor/github.com/golang/glog.stacks(0x19a8100, 0xc400000000, 0xc2, 0x186)
... ...
main.main()
    elasticsearch_logging_discovery.go:60 +0xb53

[2017-03-02 03:59:42,587][INFO ][node                     ] [elasticsearch-logging-v1-3bzt6] version[2.4.1], pid[16], build[c67dc32/2016-09-27T18:57:55Z]
[2017-03-02 03:59:42,588][INFO ][node                     ] [elasticsearch-logging-v1-3bzt6] initializing ...
[2017-03-02 03:59:44,396][INFO ][plugins                  ] [elasticsearch-logging-v1-3bzt6] modules [reindex, lang-expression, lang-groovy], plugins [], sites []
... ...
[2017-03-02 03:59:44,441][INFO ][env                      ] [elasticsearch-logging-v1-3bzt6] heap size [1007.3mb], compressed ordinary object pointers [true]
[2017-03-02 03:59:48,355][INFO ][node                     ] [elasticsearch-logging-v1-3bzt6] initialized
[2017-03-02 03:59:48,355][INFO ][node                     ] [elasticsearch-logging-v1-3bzt6] starting ...
[2017-03-02 03:59:48,507][INFO ][transport                ] [elasticsearch-logging-v1-3bzt6] publish_address {172.16.57.8:9300}, bound_addresses {[::]:9300}
[2017-03-02 03:59:48,547][INFO ][discovery                ] [elasticsearch-logging-v1-3bzt6] kubernetes-logging/7_f_M2TKRZWOw4NhBc4EqA
[2017-03-02 04:00:18,552][WARN ][discovery                ] [elasticsearch-logging-v1-3bzt6] waited for 30s and no initial state was set by the discovery
[2017-03-02 04:00:18,562][INFO ][http                     ] [elasticsearch-logging-v1-3bzt6] publish_address {172.16.57.8:9200}, bound_addresses {[::]:9200}
[2017-03-02 04:00:18,562][INFO ][node                     ] [elasticsearch-logging-v1-3bzt6] started
发现错误,无法提供安全的credential,通过在网上参考Tony Bai的技术文档,发现是默认的Service Account的问题,其中原理还需要研究一下。
先run起来再说,解决方案如下:
创建一个新的serviceaccount在kube-system namespace下:
/serviceaccount.yaml
apiVersion: v1
kind: ServiceAccount
metadata:
  name: k8s-efk

# kubectl create -f serviceaccount.yaml -n kube-system
serviceaccount "k8s-efk" created

# kubectl get serviceaccount -n kube-system
NAME      SECRETS   AGE
default   1         139d
k8s-efk   1         17s
修改es-controller.yaml使用service account “k8s-efk”:
[root@k8s-master fluentd-elasticsearch]# cat es-controller.yaml
apiVersion: v1
kind: ReplicationController
metadata:
  name: elasticsearch-logging-v1
  namespace: kube-system
  labels:
    k8s-app: elasticsearch-logging
    version: v1
    kubernetes.io/cluster-service: "true"
    addonmanager.kubernetes.io/mode: Reconcile
spec:
  replicas: 2
  selector:
    k8s-app: elasticsearch-logging
    version: v1
  template:
    metadata:
      labels:
        k8s-app: elasticsearch-logging
        version: v1
        kubernetes.io/cluster-service: "true"
    spec:
      serviceAccount: k8s-efk
      containers:
      - image: gcr.io/google_containers/elasticsearch:v2.4.1-2
        name: elasticsearch-logging
        resources:
          # need more cpu upon initialization, therefore burstable class
          limits:
            cpu: 1000m
          requests:
            cpu: 100m
        ports:
        - containerPort: 9200
          name: db
          protocol: TCP
        - containerPort: 9300
          name: transport
          protocol: TCP
        volumeMounts:
        - name: es-persistent-storage
          mountPath: /data
        env:
        - name: "NAMESPACE"
          valueFrom:
            fieldRef:
              fieldPath: metadata.namespace
      volumes:
      - name: es-persistent-storage
        emptyDir: {}
重新创建elasticsearch logging service后,我们再来查看elasticsearch-logging pod的日志,貌似OK,其实也是个坑,呆会我继续说:
[2017-05-22 06:09:12,155][INFO ][node                     ] [elasticsearch-logging-v1-9jjf1] version[2.4.1], pid[1], build[c67dc32/2016-09-27T18:57:55Z]
[2017-05-22 06:09:12,156][INFO ][node                     ] [elasticsearch-logging-v1-9jjf1] initializing ...
[2017-05-22 06:09:13,657][INFO ][plugins                  ] [elasticsearch-logging-v1-9jjf1] modules [reindex, lang-expression, lang-groovy], plugins [], sites []
[2017-05-22 06:09:13,733][INFO ][env                      ] [elasticsearch-logging-v1-9jjf1] using [1] data paths, mounts [[/data (/dev/mapper/cl-root)]], net usable_space [25gb], net total_space [37.2gb], spins? [possibly], types [xfs]
[2017-05-22 06:09:13,738][INFO ][env                      ] [elasticsearch-logging-v1-9jjf1] heap size [1015.6mb], compressed ordinary object pointers [true]
[2017-05-22 06:09:21,946][INFO ][node                     ] [elasticsearch-logging-v1-9jjf1] initialized
[2017-05-22 06:09:21,980][INFO ][node                     ] [elasticsearch-logging-v1-9jjf1] starting ...
[2017-05-22 06:09:22,442][INFO ][transport                ] [elasticsearch-logging-v1-9jjf1] publish_address {192.168.10.6:9300}, bound_addresses {[::]:9300}
[2017-05-22 06:09:22,560][INFO ][discovery                ] [elasticsearch-logging-v1-9jjf1] kubernetes-logging/RY_IOcwSSSeuJNtC2E0W7A
[2017-05-22 06:09:30,446][INFO ][cluster.service          ] [elasticsearch-logging-v1-9jjf1] detected_master {elasticsearch-logging-v1-sbcgt}{9--uDYJOTqegj5ctbbCx_A}{192.168.10.8}{192.168.10.8:9300}{master=true}, added {{elasticsearch-logging-v1-sbcgt}{9--uDYJOTqegj5ctbbCx_A}{192.168.10.8}{192.168.10.8:9300}{master=true},}, reason: zen-disco-receive(from master [{elasticsearch-logging-v1-sbcgt}{9--uDYJOTqegj5ctbbCx_A}{192.168.10.8}{192.168.10.8:9300}{master=true}])
[2017-05-22 06:09:30,453][INFO ][http                     ] [elasticsearch-logging-v1-9jjf1] publish_address {192.168.10.6:9200}, bound_addresses {[::]:9200}
[2017-05-22 06:09:30,465][INFO ][node                     ] [elasticsearch-logging-v1-9jjf1] started
好了,继续.....
4.配置kibana
根据前辈们的经验,把上面新创建的serviceaccount:k8s-efk显式赋值给kibana-controller.yaml:
[root@k8s-master fluentd-elasticsearch]# cat kibana-controller.yaml
apiVersion: extensions/v1beta1
kind: Deployment
metadata:
  name: kibana-logging
  namespace: kube-system
  labels:
    k8s-app: kibana-logging
    kubernetes.io/cluster-service: "true"
    addonmanager.kubernetes.io/mode: Reconcile
spec:
  replicas: 1
  selector:
    matchLabels:
      k8s-app: kibana-logging
  template:
    metadata:
      labels:
        k8s-app: kibana-logging
    spec:
      serviceAccount: k8s-efk
      containers:
      - name: kibana-logging
        image: gcr.io/google_containers/kibana:v4.6.1-1
        resources:
          # keep request = limit to keep this container in guaranteed class
          limits:
            cpu: 100m
          requests:
            cpu: 100m
        env:
          - name: "ELASTICSEARCH_URL"
            value: "http://elasticsearch-logging:9200"
          - name: "KIBANA_BASE_URL"
            value: "/api/v1/proxy/namespaces/kube-system/services/kibana-logging"
        ports:
        - containerPort: 5601
          name: ui
          protocol: TCP
[root@k8s-master fluentd-elasticsearch]#
启动kibana,并观察pod日志:
# kubectl logs -f kibana-logging-3604961973-jby53 -n kube-system
ELASTICSEARCH_URL=http://elasticsearch-logging:9200
server.basePath: /api/v1/proxy/namespaces/kube-system/services/kibana-logging
{"type":"log","@timestamp":"2017-03-02T08:30:15Z","tags":["info","optimize"],"pid":6,"message":"Optimizing and caching bundles for kibana and statusPage. This may take a few minutes"}
kibana启动需要十几分钟。抱歉,本人是在一台8G的笔记本电脑的virtualbox虚拟机上做,之后你将会看到如下日志:
# kubectl logs -f kibana-logging-3604961973-jby53 -n kube-system
ELASTICSEARCH_URL=http://elasticsearch-logging:9200
server.basePath: /api/v1/proxy/namespaces/kube-system/services/kibana-logging
{"type":"log","@timestamp":"2017-03-02T08:30:15Z","tags":["info","optimize"],"pid":6,"message":"Optimizing and caching bundles for kibana and statusPage. This may take a few minutes"}
{"type":"log","@timestamp":"2017-03-02T08:40:04Z","tags":["info","optimize"],"pid":6,"message":"Optimization of bundles for kibana and statusPage complete in 588.60 seconds"}
{"type":"log","@timestamp":"2017-03-02T08:40:04Z","tags":["status","plugin:kibana@1.0.0","info"],"pid":6,"state":"green","message":"Status changed from uninitialized to green - Ready","prevState":"uninitialized","prevMsg":"uninitialized"}
{"type":"log","@timestamp":"2017-03-02T08:40:05Z","tags":["status","plugin:elasticsearch@1.0.0","info"],"pid":6,"state":"yellow","message":"Status changed from uninitialized to yellow - Waiting for Elasticsearch","prevState":"uninitialized","prevMsg":"uninitialized"}
{"type":"log","@timestamp":"2017-03-02T08:40:05Z","tags":["status","plugin:kbn_vislib_vis_types@1.0.0","info"],"pid":6,"state":"green","message":"Status changed from uninitialized to green - Ready","prevState":"uninitialized","prevMsg":"uninitialized"}
{"type":"log","@timestamp":"2017-03-02T08:40:05Z","tags":["status","plugin:markdown_vis@1.0.0","info"],"pid":6,"state":"green","message":"Status changed from uninitialized to green - Ready","prevState":"uninitialized","prevMsg":"uninitialized"}
{"type":"log","@timestamp":"2017-03-02T08:40:05Z","tags":["status","plugin:metric_vis@1.0.0","info"],"pid":6,"state":"green","message":"Status changed from uninitialized to green - Ready","prevState":"uninitialized","prevMsg":"uninitialized"}
{"type":"log","@timestamp":"2017-03-02T08:40:06Z","tags":["status","plugin:spyModes@1.0.0","info"],"pid":6,"state":"green","message":"Status changed from uninitialized to green - Ready","prevState":"uninitialized","prevMsg":"uninitialized"}
{"type":"log","@timestamp":"2017-03-02T08:40:06Z","tags":["status","plugin:statusPage@1.0.0","info"],"pid":6,"state":"green","message":"Status changed from uninitialized to green - Ready","prevState":"uninitialized","prevMsg":"uninitialized"}
{"type":"log","@timestamp":"2017-03-02T08:40:06Z","tags":["status","plugin:table_vis@1.0.0","info"],"pid":6,"state":"green","message":"Status changed from uninitialized to green - Ready","prevState":"uninitialized","prevMsg":"uninitialized"}
{"type":"log","@timestamp":"2017-03-02T08:40:06Z","tags":["listening","info"],"pid":6,"message":"Server running at http://0.0.0.0:5601"}
{"type":"log","@timestamp":"2017-03-02T08:40:11Z","tags":["status","plugin:elasticsearch@1.0.0","info"],"pid":6,"state":"yellow","message":"Status changed from yellow to yellow - No existing Kibana index found","prevState":"yellow","prevMsg":"Waiting for Elasticsearch"}
{"type":"log","@timestamp":"2017-03-02T08:40:14Z","tags":["status","plugin:elasticsearch@1.0.0","info"],"pid":6,"state":"green","message":"Status changed from yellow to green - Kibana index ready","prevState":"yellow","prevMsg":"No existing Kibana index found"}
需要注意的是:(这也是坑阿)
- 必须配置dns,否则会出现http://elasticsearch-logging:9200无法连接的状态
- 如果不配置dns,那就只能修改control文件把elasticsearch-logging修改成具体的elasticsearch-logging服务的集群ip
通过
kubectl cluster-info
可以获取kibana服务的地址,其实也就是在
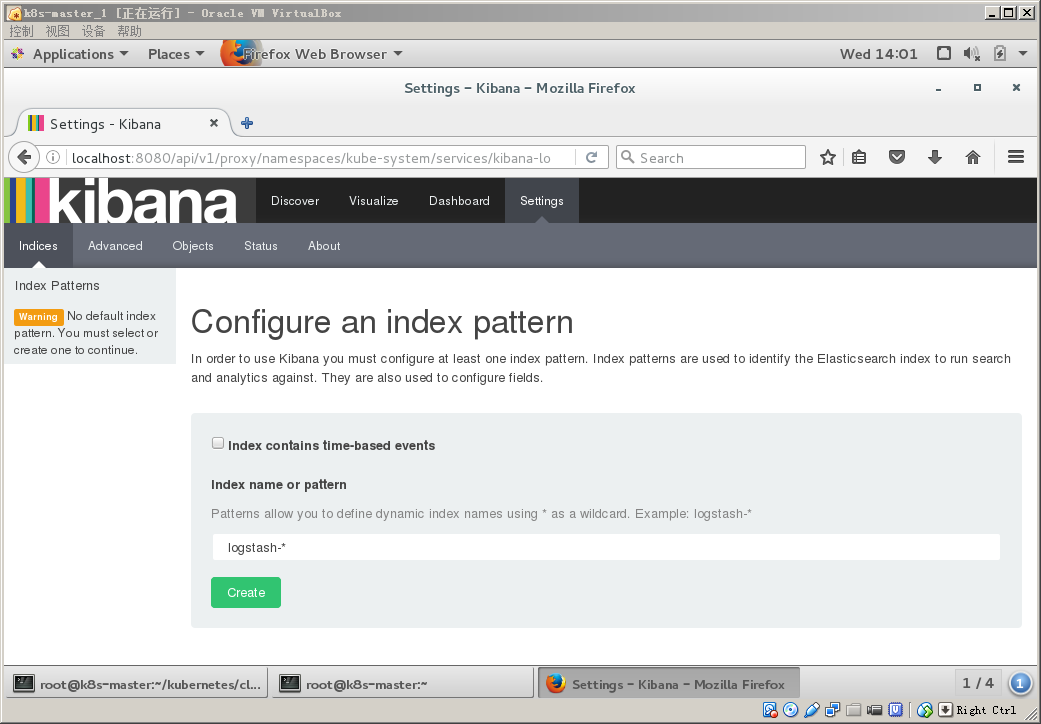
https://{API Server external IP}:{API Server secure port}/api/v1/proxy/namespaces/kube-system/services/kibana-logging/app/kibana#/settings/indices/
在下面这个界面中发现无论怎么搞create都不出现,无法添加index,当然除了直接输入*可以create,但是进去没有任何pod的信息,问题大了!!!!

5.定位问题过程
仔细对照了Tony Bai的搭建文档,有参考了无数前辈的无数的帖子,都想换个CentOS 6.5版本重新来过了,无奈CentOS 6.5暂时也没装上kubernetes集群,所以放弃。
对照了一下日志,出问题的地方很可能是:
- 根本没有日志
- fluentd服务运行问题
- elasticsearch logging日志收集问题
- 修改elasticsearch logging的images(坑阿)
仔细看fluentd的日志/etc/log/fluent.log,发现根本就是没有任何日志的输出,排除fluentd连接elasticsearch logging:9200连接不上的问题,
感觉是elasticseach logging的自己的问题,然后对比tonybai的elasticsearch的日志,发现我的只有
[2017-05-22 06:09:30,446][INFO ][cluster.service          ] [elasticsearch-logging-v1-9jjf1] detected_master {elasticsearch-logging-v1-sbcgt}{9--uDYJOTqegj5ctbbCx_A}{192.168.10.8}{192.168.10.8:9300}{master=true}, added {{elasticsearch-logging-v1-sbcgt}{9--uDYJOTqegj5ctbbCx_A}{192.168.10.8}{192.168.10.8:9300}{master=true},}, reason: zen-disco-receive(from master [{elasticsearch-logging-v1-sbcgt}{9--uDYJOTqegj5ctbbCx_A}{192.168.10.8}{192.168.10.8:9300}{master=true}])
[2017-05-22 06:09:30,453][INFO ][http                     ] [elasticsearch-logging-v1-9jjf1] publish_address {192.168.10.6:9200}, bound_addresses {[::]:9200}
[2017-05-22 06:09:30,465][INFO ][node                     ] [elasticsearch-logging-v1-9jjf1] started
就结束了,而tonybai的是
[2017-03-02 08:26:56,955][INFO ][http                     ] [elasticsearch-logging-v1-dklui] publish_address {172.16.57.8:9200}, bound_addresses {[::]:9200}
[2017-03-02 08:26:56,956][INFO ][node                     ] [elasticsearch-logging-v1-dklui] started
[2017-03-02 08:26:57,157][INFO ][gateway                  ] [elasticsearch-logging-v1-dklui] recovered [0] indices into cluster_state
[2017-03-02 08:27:05,378][INFO ][cluster.metadata         ] [elasticsearch-logging-v1-dklui] [logstash-2017.03.02] creating index, cause [auto(bulk api)], templates [], shards [5]/[1], mappings []
[2017-03-02 08:27:06,360][INFO ][cluster.metadata         ] [elasticsearch-logging-v1-dklui] [logstash-2017.03.01] creating index, cause [auto(bulk api)], templates [], shards [5]/[1], mappings []
[2017-03-02 08:27:07,163][INFO ][cluster.routing.allocation] [elasticsearch-logging-v1-dklui] Cluster health status changed from [RED] to [YELLOW] (reason: [shards started [[logstash-2017.03.01][3], [logstash-2017.03.01][3]] ...]).
[2017-03-02 08:27:07,354][INFO ][cluster.metadata         ] [elasticsearch-logging-v1-dklui] [logstash-2017.03.02] create_mapping [fluentd]
[2017-03-02 08:27:07,988][INFO ][cluster.metadata         ] [elasticsearch-logging-v1-dklui] [logstash-2017.03.01] create_mapping [fluentd]
[2017-03-02 08:27:09,578][INFO ][cluster.routing.allocation] [elasticsearch-logging-v1-dklui] Cluster health status changed from [YELLOW] to [GREEN] (reason: [shards started [[logstash-2017.03.02][4]] ...]).
区别如下:
- recover cluster的信息
- 有logstash的信息
感觉很有可能是image问题,因此把原来的image修改成和tonybai保持一致,把es-control.yaml中官方的v2.4.1-2修改为
bigwhite/elasticsearch:v2.4.1-1
然后启动,发现果然有了recover cluster的信息。但仍然没有logstash的信息。
- 定位日志问题(又是个大坑)
又绕回到第一个问题,明明通过kubectl logs满屏幕的日志
[root@k8s-master fluentd-elasticsearch]# kubectl logs helloworld-service-4d72j
.
.
JAVA Memory arguments: -Djava.security.egd=file:/dev/./urandom
.
CLASSPATH=/u01/oracle/wlserver/../oracle_common/modules/javax.persistence_2.1.jar:/u01/oracle/wlserver/../wlserver/modules/com.oracle.weblogic.jpa21support_1.0.0.0_2-1.jar:/usr/java/jdk1.8.0_101/lib/tools.jar:/u01/oracle/wlserver/server/lib/weblogic_sp.jar:/u01/oracle/wlserver/server/lib/weblogic.jar:/u01/oracle/wlserver/../oracle_common/modules/net.sf.antcontrib_1.1.0.0_1-0b3/lib/ant-contrib.jar:/u01/oracle/wlserver/modules/features/oracle.wls.common.nodemanager_2.0.0.0.jar:/u01/oracle/wlserver/../oracle_common/modules/com.oracle.cie.config-wls-online_8.1.0.0.jar:/u01/oracle/wlserver/common/derby/lib/derbyclient.jar:/u01/oracle/wlserver/common/derby/lib/derby.jar:/u01/oracle/wlserver/server/lib/xqrl.jar
.
PATH=/u01/oracle/wlserver/server/bin:/u01/oracle/wlserver/../oracle_common/modules/org.apache.ant_1.9.2/bin:/usr/java/jdk1.8.0_101/jre/bin:/usr/java/jdk1.8.0_101/bin:/usr/local/sbin:/usr/local/bin:/usr/sbin:/usr/bin:/sbin:/bin:/usr/java/default/bin:/u01/oracle/oracle_common/common/bin:/u01/oracle/oracle_common/common/bin:/u01/oracle/wlserver/common/bin:/u01/oracle/user_projects/domains/base_domain/bin:/u01/oracle
.
***************************************************
*  To start WebLogic Server, use a username and   *
*  password assigned to an admin-level user.  For *
*  server administration, use the WebLogic Server *
*  console at http://hostname:port/console        *
***************************************************
starting weblogic with Java version:
java version "1.8.0_101"
Java(TM) SE Runtime Environment (build 1.8.0_101-b13)
Java HotSpot(TM) 64-Bit Server VM (build 25.101-b13, mixed mode)
Starting WLS with line:
/usr/java/jdk1.8.0_101/bin/java -server   -Djava.security.egd=file:/dev/./urandom -Dweblogic.Name=AdminServer -Djava.security.policy=/u01/oracle/wlserver/server/lib/weblogic.policy  -Dweblogic.ProductionModeEnabled=true   -Djava.endorsed.dirs=/usr/java/jdk1.8.0_101/jre/lib/endorsed:/u01/oracle/wlserver/../oracle_common/modules/endorsed  -da -Dwls.home=/u01/oracle/wlserver/server -Dweblogic.home=/u01/oracle/wlserver/server     -Dweblogic.utils.cmm.lowertier.ServiceDisabled=true  weblogic.Server
<May 24, 2017 2:27:39 AM GMT> <Info> <Security> <BEA-090905> <Disabling the CryptoJ JCE Provider self-integrity check for better startup performance. To enable this check, specify -Dweblogic.security.allowCryptoJDefaultJCEVerification=true.>
<May 24, 2017 2:27:41 AM GMT> <Info> <Security> <BEA-090906> <Changing the default Random Number Generator in RSA CryptoJ from ECDRBG128 to FIPS186PRNG. To disable this change, specify -Dweblogic.security.allowCryptoJDefaultPRNG=true.>
<May 24, 2017 2:27:44 AM GMT> <Info> <WebLogicServer> <BEA-000377> <Starting WebLogic Server with Java HotSpot(TM) 64-Bit Server VM Version 25.101-b13 from Oracle Corporation.>
<May 24, 2017 2:27:47 AM GMT> <Info> <Management> <BEA-141107> <Version: WebLogic Server 12.1.3.0.0  Wed May 21 18:53:34 PDT 2014 1604337 >
<May 24, 2017 2:27:59 AM GMT> <Notice> <WebLogicServer> <BEA-000365> <Server state changed to STARTING.>
<May 24, 2017 2:28:00 AM GMT> <Info> <WorkManager> <BEA-002900> <Initializing self-tuning thread pool.>
<May 24, 2017 2:28:00 AM GMT> <Info> <WorkManager> <BEA-002942> <CMM memory level becomes 0. Setting standby thread pool size to 256.>
<May 24, 2017 2:28:02 AM GMT> <Notice> <Log Management> <BEA-170019> <The server log file /u01/oracle/user_projects/domains/base_domain/servers/AdminServer/logs/AdminServer.log is opened. All server side log events will be written to this file.>
<May 24, 2017 2:28:18 AM GMT> <Notice> <Security> <BEA-090082> <Security initializing using security realm myrealm.>
<May 24, 2017 2:28:31 AM GMT> <Notice> <WebLogicServer> <BEA-000365> <Server state changed to STANDBY.>
<May 24, 2017 2:28:31 AM GMT> <Notice> <WebLogicServer> <BEA-000365> <Server state changed to STARTING.>
May 24, 2017 2:28:31 AM weblogic.wsee.WseeCoreMessages logWseeServiceStarting
INFO: The Wsee Service is starting
<May 24, 2017 2:28:34 AM GMT> <Warning> <Munger> <BEA-2156203> <A version attribute was not found in element "web-app" in the deployment descriptor /u01/oracle/user_projects/domains/base_domain/servers/AdminServer/upload/HelloWorld.war/WEB-INF/web.xml. A version attribute is required, but this version of the WebLogic Server will assume that the latest version is used. Future versions of WebLogic Server will reject descriptors that do not specify the Java EE version. To eliminate this warning, add an appropriate "version=" to element "web-app" in the deployment descriptor.>
<May 24, 2017 2:28:39 AM GMT> <Notice> <Log Management> <BEA-170027> <The server has successfully established a connection with the Domain level Diagnostic Service.>
<May 24, 2017 2:28:41 AM GMT> <Notice> <WebLogicServer> <BEA-000365> <Server state changed to ADMIN.>
<May 24, 2017 2:28:41 AM GMT> <Notice> <WebLogicServer> <BEA-000365> <Server state changed to RESUMING.>
<May 24, 2017 2:28:41 AM GMT> <Notice> <Server> <BEA-002613> <Channel "Default[3]" is now listening on 127.0.0.1:7001 for protocols iiop, t3, ldap, snmp, http.>
<May 24, 2017 2:28:41 AM GMT> <Notice> <Server> <BEA-002613> <Channel "Default" is now listening on 192.168.53.3:7001 for protocols iiop, t3, ldap, snmp, http.>
<May 24, 2017 2:28:41 AM GMT> <Notice> <Server> <BEA-002613> <Channel "Default[2]" is now listening on 0:0:0:0:0:0:0:1:7001 for protocols iiop, t3, ldap, snmp, http.>
<May 24, 2017 2:28:41 AM GMT> <Notice> <WebLogicServer> <BEA-000329> <Started the WebLogic Server Administration Server "AdminServer" for domain "base_domain" running in production mode.>
<May 24, 2017 2:28:41 AM GMT> <Error> <Server> <BEA-002606> <The server is unable to create a server socket for listening on channel "Default[1]". The address fe80:0:0:0:42:c0ff:fea8:3503 might be incorrect or another process is using port 7001: java.net.BindException: Cannot assign requested address>
<May 24, 2017 2:28:41 AM GMT> <Warning> <Server> <BEA-002611> <The hostname "localhost", maps to multiple IP addresses: 127.0.0.1, 0:0:0:0:0:0:0:1.>
<May 24, 2017 2:28:41 AM GMT> <Notice> <WebLogicServer> <BEA-000360> <The server started in RUNNING mode.>
<May 24, 2017 2:28:41 AM GMT> <Notice> <WebLogicServer> <BEA-000365> <Server state changed to RUNNING.>
[root@k8s-master fluentd-elasticsearch]#
再去minion机器上通过docker logs id也是满屏的日志阿!
[root@k8s-node-1 ~]# docker logs bec3e02b2490
.
.
JAVA Memory arguments: -Djava.security.egd=file:/dev/./urandom
.
CLASSPATH=/u01/oracle/wlserver/../oracle_common/modules/javax.persistence_2.1.jar:/u01/oracle/wlserver/../wlserver/modules/com.oracle.weblogic.jpa21support_1.0.0.0_2-1.jar:/usr/java/jdk1.8.0_101/lib/tools.jar:/u01/oracle/wlserver/server/lib/weblogic_sp.jar:/u01/oracle/wlserver/server/lib/weblogic.jar:/u01/oracle/wlserver/../oracle_common/modules/net.sf.antcontrib_1.1.0.0_1-0b3/lib/ant-contrib.jar:/u01/oracle/wlserver/modules/features/oracle.wls.common.nodemanager_2.0.0.0.jar:/u01/oracle/wlserver/../oracle_common/modules/com.oracle.cie.config-wls-online_8.1.0.0.jar:/u01/oracle/wlserver/common/derby/lib/derbyclient.jar:/u01/oracle/wlserver/common/derby/lib/derby.jar:/u01/oracle/wlserver/server/lib/xqrl.jar
.
PATH=/u01/oracle/wlserver/server/bin:/u01/oracle/wlserver/../oracle_common/modules/org.apache.ant_1.9.2/bin:/usr/java/jdk1.8.0_101/jre/bin:/usr/java/jdk1.8.0_101/bin:/usr/local/sbin:/usr/local/bin:/usr/sbin:/usr/bin:/sbin:/bin:/usr/java/default/bin:/u01/oracle/oracle_common/common/bin:/u01/oracle/oracle_common/common/bin:/u01/oracle/wlserver/common/bin:/u01/oracle/user_projects/domains/base_domain/bin:/u01/oracle
.
***************************************************
*  To start WebLogic Server, use a username and   *
*  password assigned to an admin-level user.  For *
*  server administration, use the WebLogic Server *
*  console at http://hostname:port/console        *
***************************************************
starting weblogic with Java version:
java version "1.8.0_101"
Java(TM) SE Runtime Environment (build 1.8.0_101-b13)
Java HotSpot(TM) 64-Bit Server VM (build 25.101-b13, mixed mode)
Starting WLS with line:
/usr/java/jdk1.8.0_101/bin/java -server   -Djava.security.egd=file:/dev/./urandom -Dweblogic.Name=AdminServer -Djava.security.policy=/u01/oracle/wlserver/server/lib/weblogic.policy  -Dweblogic.ProductionModeEnabled=true   -Djava.endorsed.dirs=/usr/java/jdk1.8.0_101/jre/lib/endorsed:/u01/oracle/wlserver/../oracle_common/modules/endorsed  -da -Dwls.home=/u01/oracle/wlserver/server -Dweblogic.home=/u01/oracle/wlserver/server     -Dweblogic.utils.cmm.lowertier.ServiceDisabled=true  weblogic.Server
...........
因为/var/log/fluentd.log老是停留在配置上没有刷动,怀疑是configmap的配置问题,找出之前备份的td-agent.conf一看
# The Kubernetes fluentd plugin is used to write the Kubernetes metadata to the log
# record & add labels to the log record if properly configured. This enables users
# to filter & search logs on any metadata.
# For example a Docker container's logs might be in the directory:
#
#  /var/lib/docker/containers/997599971ee6366d4a5920d25b79286ad45ff37a74494f262e3bc98d909d0a7b
#
# and in the file:
#
#  997599971ee6366d4a5920d25b79286ad45ff37a74494f262e3bc98d909d0a7b-json.log
#
# where 997599971ee6... is the Docker ID of the running container.
# The Kubernetes kubelet makes a symbolic link to this file on the host machine
# in the /var/log/containers directory which includes the pod name and the Kubernetes
# container name:
#
#    synthetic-logger-0.25lps-pod_default_synth-lgr-997599971ee6366d4a5920d25b79286ad45ff37a74494f262e3bc98d909d0a7b.log
终于发现问题, 原来都是通过/var/lib/docker/containers/目录去找,然而我的docker下面容器没有任何log文件。
仔细研究了一下docker,原来所有的docker日志都journal到系统日志 /var/log/messages下了.为什么呢? 因为经常有人说docker日志太多导致container容器增长比较快,所以都通过系统的journal进行统一处理。
修改/etc/sysconfig/docker配置文件,把原来的journal改回到当前json.log方式.
#OPTIONS='--selinux-enabled --log-driver=journald --signature-verification=false'
OPTIONS='--selinux-enabled --log-driver=json-file --signature-verification=false'
改完后就发现container下面有很多log文件了.
然后回到/var/log/fluentd.log文件,发现终于满屏的日志滚动,输出正常了
2017-05-24 05:44:17 +0000 [info]: following tail of /var/log/containers/fluentd-es-v1.22-351lz_kube-system_POD-aca728523bc307598917d78b2526e718e6c7fdbb38b70c05900d2439399efa10.log
2017-05-24 05:44:17 +0000 [info]: following tail of /var/log/containers/helloworld-service-n5f0s_default_POD-ca013e9ab31b825cd4b85ab4700fad2fcaafd5f39c572778d10d438012ea4435.log
2017-05-24 05:44:17 +0000 [info]: following tail of /var/log/containers/fluentd-es-v1.22-351lz_kube-system_POD-2eb78ece8c2b5c222313ab4cfb53ea6ec32f54e1b7616f729daf48b01d393b65.log
2017-05-24 05:44:17 +0000 [info]: following tail of /var/log/containers/helloworld-service-4d72j_default_POD-1dcbbc2ef71f7f542018069a1043a122117a97378c19f03ddb95b8a71dab4637.log
2017-05-24 05:44:17 +0000 [info]: following tail of /var/log/containers/helloworld-service-n5f0s_default_weblogichelloworld-d7229e5c23c6bf7582ed6559417ba24d99e33e44a68a6079159b4792fe05a673.log
2017-05-24 05:44:17 +0000 [info]: following tail of /var/log/containers/helloworld-service-4d72j_default_weblogichelloworld-71d1d7252dd7504fd45351d714d21c3c615facc5e2650553c68c0bf359e8434a.log
2017-05-24 05:44:17 +0000 [info]: following tail of /var/log/containers/kube-dns-v11-x0vr3_kube-system_kube2sky-c77121c354459f22712b0a99623eff1590f4fdb1a5d3ad2db09db000755f9c2c.log
2017-05-24 05:44:17 +0000 [info]: following tail of /var/log/containers/kube-dns-v11-x0vr3_kube-system_skydns-f3c0fbf4ea5cd840c968a807a40569042c90de08f7722e7344282845d5782a20.log
2017-05-24 05:44:17 +0000 [info]: following tail of /var/log/containers/fluentd-es-v1.22-351lz_kube-system_fluentd-es-93795904ff4870758441dd7288972d4967ffac18f2f25272b12e99ea6b692d44.log
2017-05-24 05:45:03 +0000 [warn]: temporarily failed to flush the buffer. next_retry=2017-05-24 05:44:24 +0000 error_class="Fluent::ElasticsearchOutput::ConnectionFailure" error="Can not reach Elasticsearch cluster ({:host=>\"elasticsearch-logging\", :port=>9200, :scheme=>\"http\"})!" plugin_id="object:3f986d0a5150"
  2017-05-24 05:45:03 +0000 [warn]: /opt/td-agent/embedded/lib/ruby/gems/2.1.0/gems/fluent-plugin-elasticsearch-1.5.0/lib/fluent/plugin/out_elasticsearch.rb:122:in `client'
把所有的组件都启动起来
[root@k8s-master fluentd-elasticsearch]# kubectl get pods -n kube-system
NAME                              READY     STATUS    RESTARTS   AGE
elasticsearch-logging-v1-1xwnq    1/1       Running   0          29s
elasticsearch-logging-v1-gx6lc    1/1       Running   0          29s
fluentd-es-v1.22-351lz            1/1       Running   1          3h
kibana-logging-3659310023-gcwrn   1/1       Running   0          15s
kube-dns-v11-x0vr3                4/4       Running   28         1d
访问kibana
[root@k8s-master fluentd-elasticsearch]# kubectl cluster-info
Kubernetes master is running at http://localhost:8080
Elasticsearch is running at http://localhost:8080/api/v1/proxy/namespaces/kube-system/services/elasticsearch-logging
Kibana is running at http://localhost:8080/api/v1/proxy/namespaces/kube-system/services/kibana-logging
KubeDNS is running at http://localhost:8080/api/v1/proxy/namespaces/kube-system/services/kube-dns

To further debug and diagnose cluster problems, use 'kubectl cluster-info dump'.
终于出现绿色的create
create完后进入
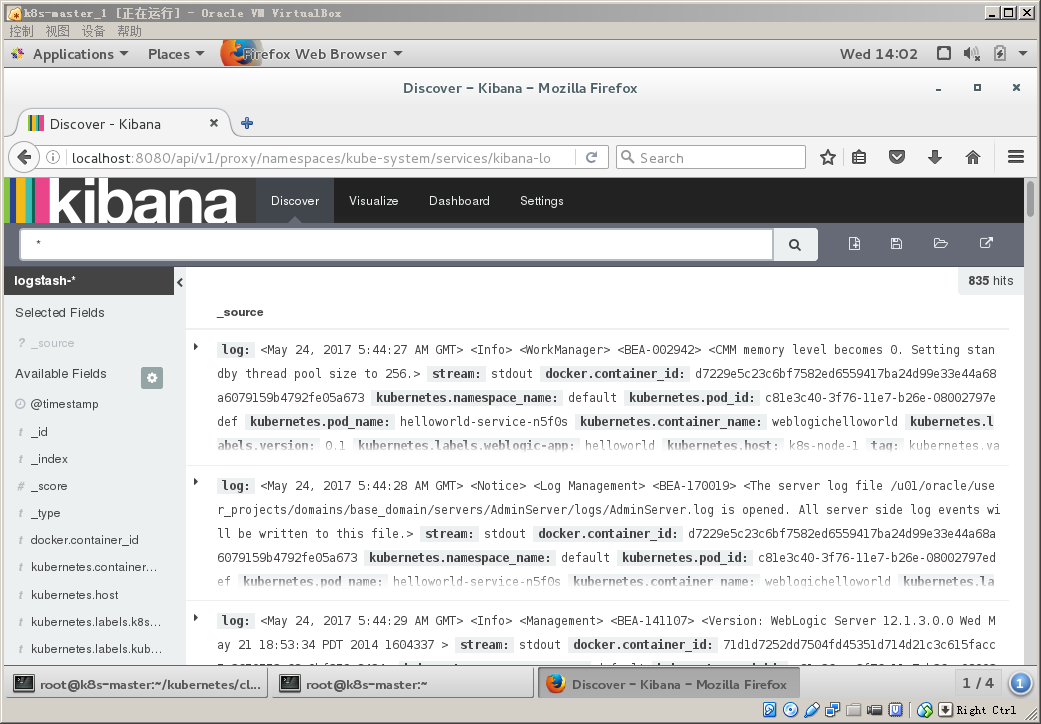
点开kubernetes pod name,可以看到集群内部所有的pod的日志
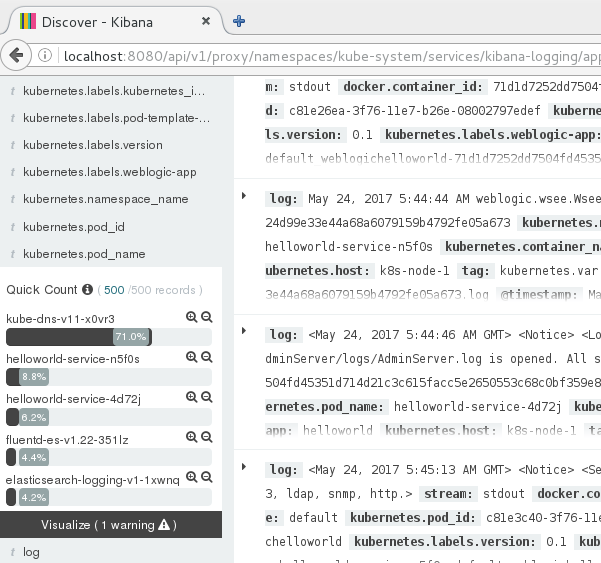
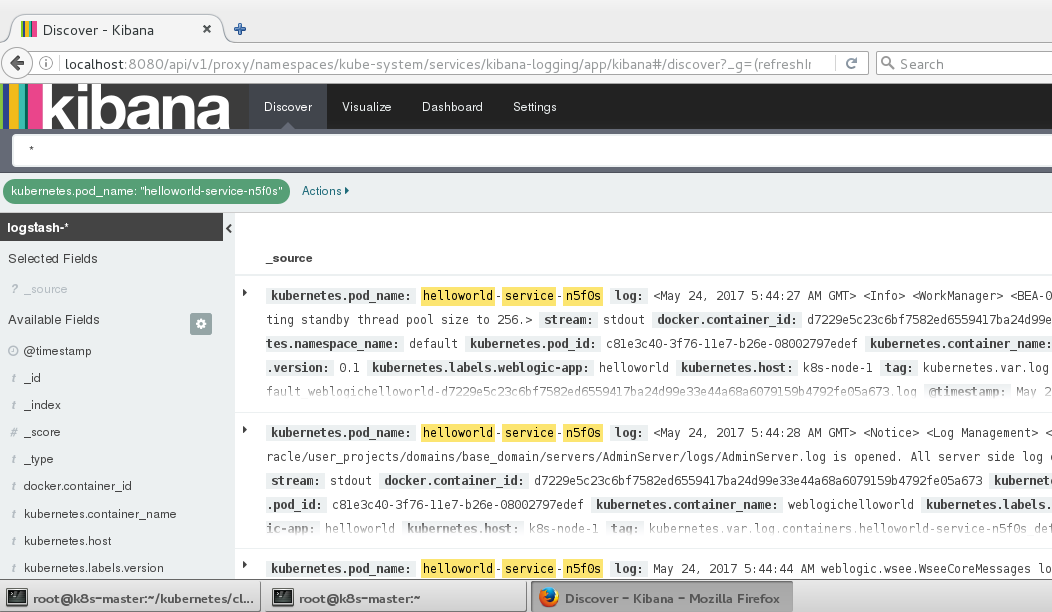
如果我们只是关注helloworld-service,选择旁边的+,然后可以看到每条weblogic日志的输出.
好了,到目前为止配置完成。
6.填坑总结:
- 这次为了配置EFK把DNS,ServiceAccount都配置了一便,也算是收获啦。
- 对kubernetes内部集群的机制有更深的理解,也慢慢的帮助我们加速解决问题吧。
最后真心感谢网上那些尚未谋面的大师的帮助:
http://tonybai.com/2017/03/03/implement-kubernetes-cluster-level-logging-with-fluentd-and-elasticsearch-stack/
http://rootsongjc.github.io/blogs/kubernetes-fluentd-elasticsearch-installation/
http://www.tothenew.com/blog/how-to-install-kubernetes-on-centos/
http://blog.csdn.net/wenwst/article/details/53908144

 浙公网安备 33010602011771号