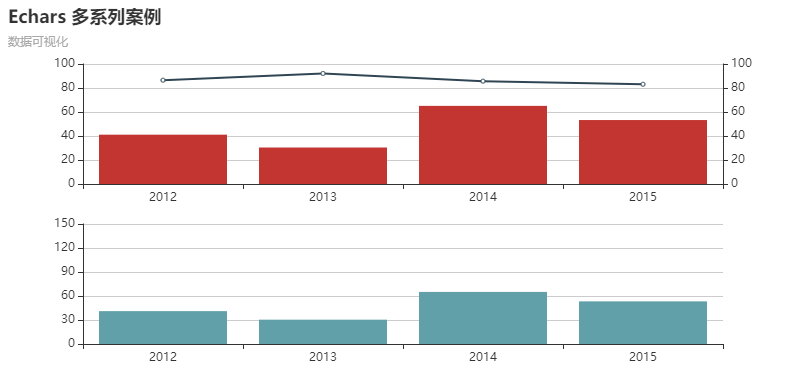
多坐标系案例图
<!DOCTYPE html>
<html>
<head>
<meta charset="utf-8">
<title></title>
<script src="https://cdn.jsdelivr.net/npm/echarts@4.7.0/dist/echarts.js"></script>
<style>
#chart {
width: 800px;
height: 400px;
}
</style>
</head>
<body>
<div id="chart"></div>
<script>
const chartDom = document.getElementById('chart');
// const chart = echarts.init(chartDom,'westeros',{renderer:'svg'});
const chart = echarts.init(chartDom);
chart.setOption({
xAxis:[
{
type:'category',
gridIndex:0
},
{
type:'category',
gridIndex:1
}
],
yAxis:[{
min:0,
max:100,
gridIndex:0
},{
splitLine:{
show: false
},
gridIndex:0
},
{
min:0,
max:150,
gridIndex:1
}] ,
grid:[{
bottom:'55%'
},{
top:'55%'
}],
dataset:{
source:[
['product', '2012', '2013', '2014', '2015'],
['Matcha Latte', 41.1, 30.4, 65.1, 53.3],
['Milk Tea', 86.5, 92.1, 85.7, 83.1]
]
},
title:{
text:"Echars 多系列案例",
// 小标题
subtext:'数据可视化'
},
series:[
{
type:'bar',
seriesLayoutBy:'row',
xAxisIndex:0,
yAxisIndex: 0
},
{
type:'line',
seriesLayoutBy:'row',
xAxisIndex:0,
yAxisIndex: 1
},
{
type:'bar',
seriesLayoutBy:'row',
xAxisIndex:1,
yAxisIndex: 2
}
]
})
</script>
</body>
</html>

 浙公网安备 33010602011771号