function binddata_1() {
var data1 = [];
var value1 = [];
for (var i = 1; i < 13; i++) {
data1.push(i + "月");
}
for (var i = 0; i < data1.length; i++) {
value1.push(i * 100);
}
// 基于准备好的dom,初始化echarts实例
var myChart = echarts.init(document.getElementById('right_1'));
myChart.on('click', function (params) {
// 控制台打印数据的名称
console.log(params.name);
});
// 指定图表的配置项和数据
var option = {};
option = {
tooltip: {
trigger: 'axis'
},
//图例
legend: {
textStyle: {
color: '#fff',
fontSize: 12,
},
right: '5%',
data: ['A', 'B']
},
//网格
grid: {
x: 40,
y: 40,
x2: 20,
y2: 20,
},
xAxis: {
type: 'category',
boundaryGap: false,//坐标轴两端是否留白
axisLabel: {
interval: 0,
textStyle: {
color: '#fff',
fontSize: 12
}
},
axisTick: {
show: false,
},
axisLine: {
show: true,
symbol: ['none', 'none'],
symbolOffset: 12,
lineStyle: {
color: '#0098f3',//X轴颜色
}
},
data: ['1月', '2月', '3月', '4月', '5月', '6月', '7月', '8月', '9月', '10月', '11月', '12月']
},
yAxis: [ //双y轴
{
type: 'value',
axisLine: {
show: true,
symbol: ['none', 'none'],
symbolOffset: 12,
lineStyle: {
color: '#0098f3',//y轴颜色
}
},
axisTick: {
show: false
},
axisLabel: {
textStyle: {
color: '#fff',
fontSize: 12
}
},
splitLine: {
show: true,
lineStyle: {
color: ['#0098f3'],
width: 1,
type: 'solid'
}
}
},
{
type: 'value',
axisLine: {
show: true,
symbol: ['none', 'none'],
symbolOffset: 12,
lineStyle: {
color: '#0098f3',//y轴颜色
}
},
axisTick: {
show: false
},
axisLabel: {
textStyle: {
color: '#fff',
fontSize: 12
}
},
splitLine: {
show: true,
lineStyle: {
color: ['#0098f3'],
width: 1,
type: 'solid'
}
}
}
],
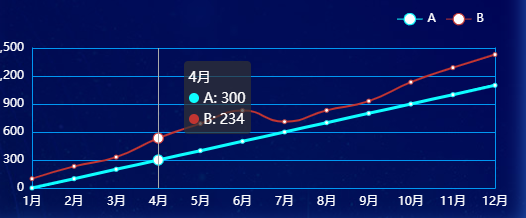
series: [
{
name: 'A',
type: 'line',
stack: '总量',
data: value1,
itemStyle: {
normal: {
color: "#0efdff",//折线点的颜色
lineStyle: {
color: "#0efdff",//折线的颜色
width: 3,
}
},
},
smooth: true
},
{
name: 'B',
type: 'line',
stack: '总量',
data: [100, 132, 131, 234, 290, 330, 110, 132, 131, 234, 290, 330],
smooth: true
},
]
};
// 使用刚指定的配置项和数据显示图表。
myChart.setOption(option);
}
binddata_1();


 浙公网安备 33010602011771号