使用 xhprof 进行 php 的性能分析
基于本机环境(php7,macos)
1、xhprof 扩展
php7 下安装 xhprof 扩展:
git clone https://github.com/longxinH/xhprof
cd xhprof/extension/
phpize
./configure
make
make install
安装完之后,需要修改 php.ini 配置,找不到 php.ini 可以 php -i | grep php.ini,添加以下配置:
extension=/usr/local/Cellar/php@7.1/7.1.18/pecl/20160303/xhprof.so
xhprof.output_dir=/Users/ruby/project/xhprof-test/output
以上路径需要根据本机安装路径进行修改,需要说一下的是,output_dir 项,我们在开启 xhprof 性能分析的时候,最后分析结果会保存到一个文件,而这些输出的文件就保存到这个 output_dir 指定的目录,下面会用到。
2、进入 xhprof/xhprof_html 目录,使用内置的 php 服务器开启 php 服务
xhprof/xhprof_html
php -S 0.0.0.0:9500
然后使用浏览器访问:http://127.0.0.1:9500,可以看到以下界面:
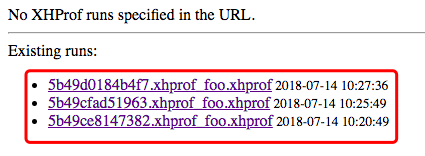
其中的几个超链接就是我们使用 xhprof 的时候产生的性能分析结果文件。我们可以点击进去查看具体的性能分析:

我们可以看到各个函数的调用次数、时间。
3、我们可以点击上图的 "View Full Callgraph",查看性能瓶颈。(需要 graphviz, mac 下安装:brew install graphviz)
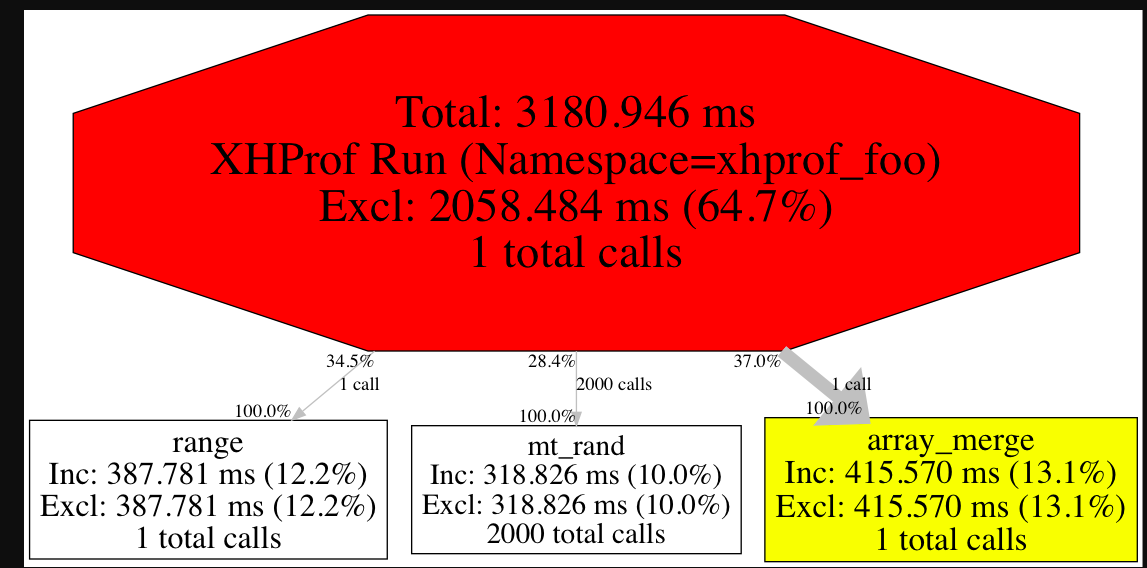
其中红色的部分是耗时最长的,这样我们就可以针对具体的代码进行优化。
附:
1、测试代码:
<?php

$XHPROF_ROOT = realpath(dirname(__FILE__) .'/xhprof');
include_once $XHPROF_ROOT . "/xhprof_lib/utils/xhprof_lib.php";
include_once $XHPROF_ROOT . "/xhprof_lib/utils/xhprof_runs.php";

//开启xhprof
xhprof_enable(0, []);

$range = range(1, 10000);
foreach ($range as $_) {
    $_ ++;
}

$array = [];
for ($i = 0; $i < 1000; $i ++) {
    $array[] = mt_rand($i, $i + 1000);
}

$array1 = [];
for ($i = 0; $i < 1000; $i ++) {
    $array1[] = mt_rand($i, $i + 1000);
}

$new_array = array_merge($array, $array1);

//你也可以手动结束执行,保存分析结果
$xhprof_data = xhprof_disable();
$xhprof_runs = new XHProfRuns_Default();
$run_id = $xhprof_runs->save_run($xhprof_data, "xhprof_foo");
2、更现代化的依赖使用方式
composer require lox/xhprof
3、laravel 集成
public/index.php
<?php

/*
|--------------------------------------------------------------------------
| Create The Application
|--------------------------------------------------------------------------
|
| First we need to get an application instance. This creates an instance
| of the application / container and bootstraps the application so it
| is ready to receive HTTP / Console requests from the environment.
|
*/

xhprof_enable(0, []);

$app = require __DIR__.'/../bootstrap/app.php';

/*
|--------------------------------------------------------------------------
| Run The Application
|--------------------------------------------------------------------------
|
| Once we have the application, we can handle the incoming request
| through the kernel, and send the associated response back to
| the client's browser allowing them to enjoy the creative
| and wonderful application we have prepared for them.
|
*/

$app->run();

$xhprof_data = xhprof_disable();
$xhprof_runs = new XHProfRuns_Default();
$run_id = $xhprof_runs->save_run($xhprof_data, "xhprof_foo");
上面的第一行和最后三行是 xhprof 相关代码
概要报告字段含义
Function Name:方法名称。
Calls:方法被调用的次数。
Calls%:方法调用次数在同级方法总数调用次数中所占的百分比。
Incl.Wall Time(microsec):方法执行花费的时间,包括子方法的执行时间。(单位:微秒)
IWall%:方法执行花费的时间百分比。
Excl. Wall Time(microsec):方法本身执行花费的时间,不包括子方法的执行时间。(单位:微秒)
EWall%:方法本身执行花费的时间百分比。
Incl. CPU(microsecs):方法执行花费的CPU时间,包括子方法的执行时间。(单位:微秒)
ICpu%:方法执行花费的CPU时间百分比。
Excl. CPU(microsec):方法本身执行花费的CPU时间,不包括子方法的执行时间。(单位:微秒)
ECPU%:方法本身执行花费的CPU时间百分比。
Incl.MemUse(bytes):方法执行占用的内存,包括子方法执行占用的内存。(单位:字节)
IMemUse%:方法执行占用的内存百分比。
Excl.MemUse(bytes):方法本身执行占用的内存,不包括子方法执行占用的内存。(单位:字节)
EMemUse%:方法本身执行占用的内存百分比。
Incl.PeakMemUse(bytes):Incl.MemUse峰值。(单位:字节)
IPeakMemUse%:Incl.MemUse峰值百分比。
Excl.PeakMemUse(bytes):Excl.MemUse峰值。单位:(字节)
EPeakMemUse%:Excl.MemUse峰值百分比。

 浙公网安备 33010602011771号