Debugger: Step into Jetty
在开发工具中,调试是非常有用的功能。当下流行的IDEA开发工具社区版不支持配置tomcat等web容器的配置。不过可以使用插件来实现调试时的Web容器,以Maven管理的项目为例,只需要在项目的pom.xml文件的中添加jetty-maven-plugin插件即可。
    <build>
        <plugins>
            <plugin>
                <groupId>org.eclipse.jetty</groupId>
                <artifactId>jetty-maven-plugin</artifactId>
                <version>9.4.20.v20190813</version>
            </plugin>
        </plugins>
    </build>
在启动调试后,如果想从头查看Web容器响应请求的代码,在Debugger Frame的列表里点击Jetty的Frame时却不能进入相应的Jetty源码。
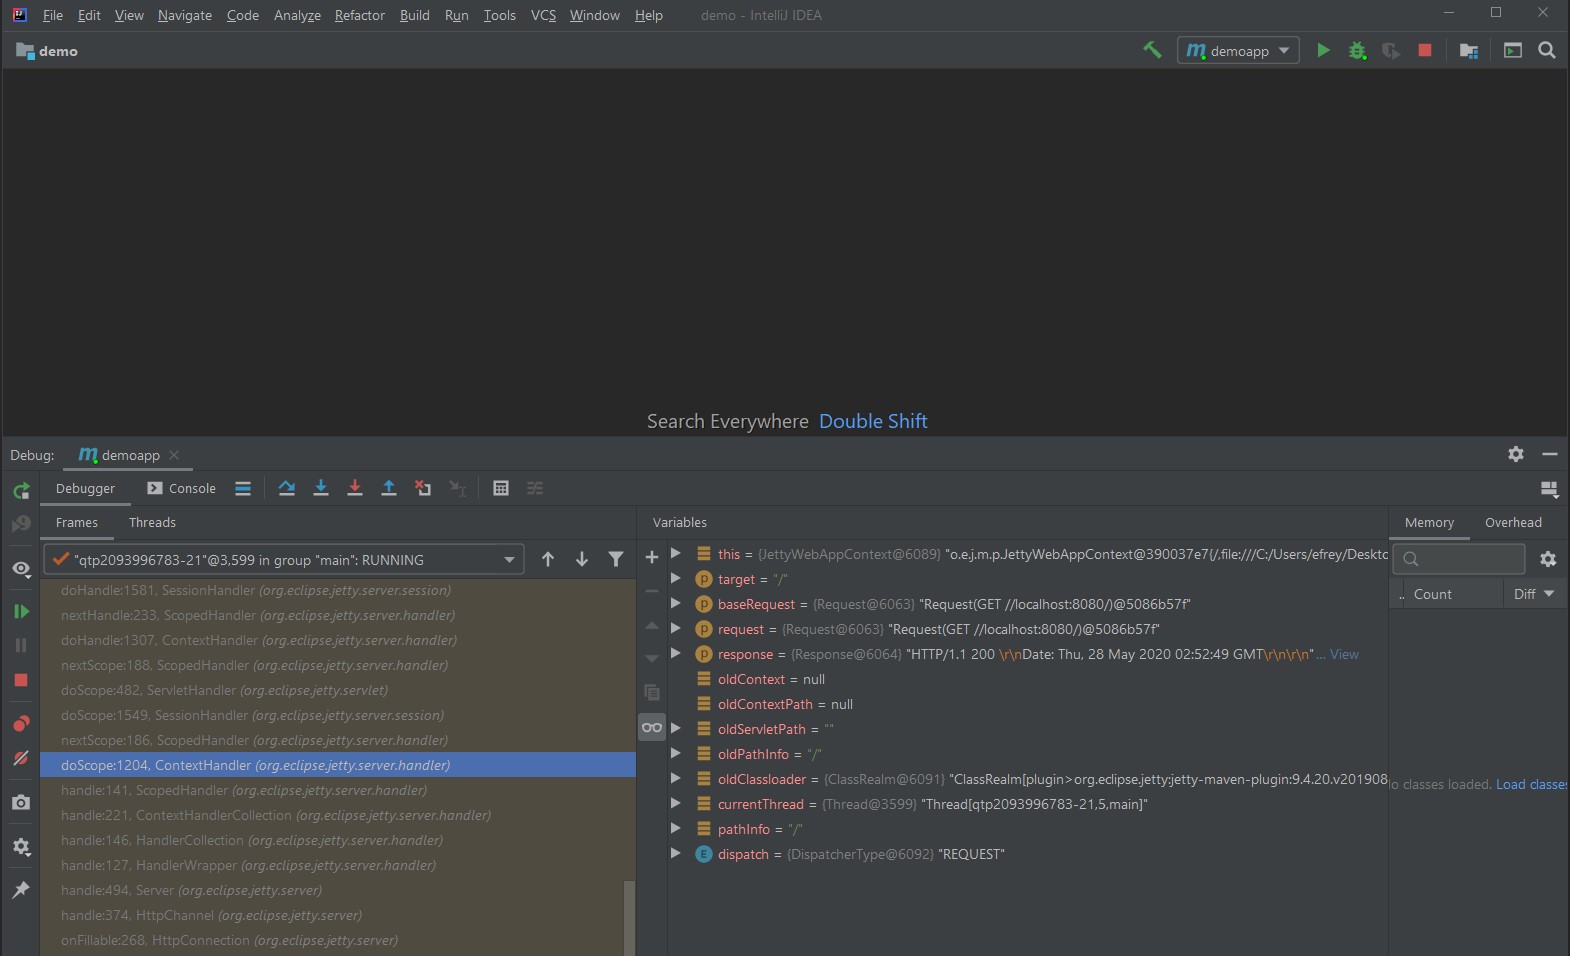
这是由于Jetty是在plugin中被加载的,没有在classpath中。这时只需要在pom.xml中的依赖中添加两个依赖:
        <dependency>
            <groupId>org.eclipse.jetty</groupId>
            <artifactId>jetty-servlet</artifactId>
            <version>9.4.20.v20190813</version>
            <scope>provided</scope>
        </dependency>
        <dependency>
            <groupId>org.eclipse.jetty.websocket</groupId>
            <artifactId>websocket-server</artifactId>
            <version>9.4.20.v20190813</version>
            <scope>provided</scope>
        </dependency>
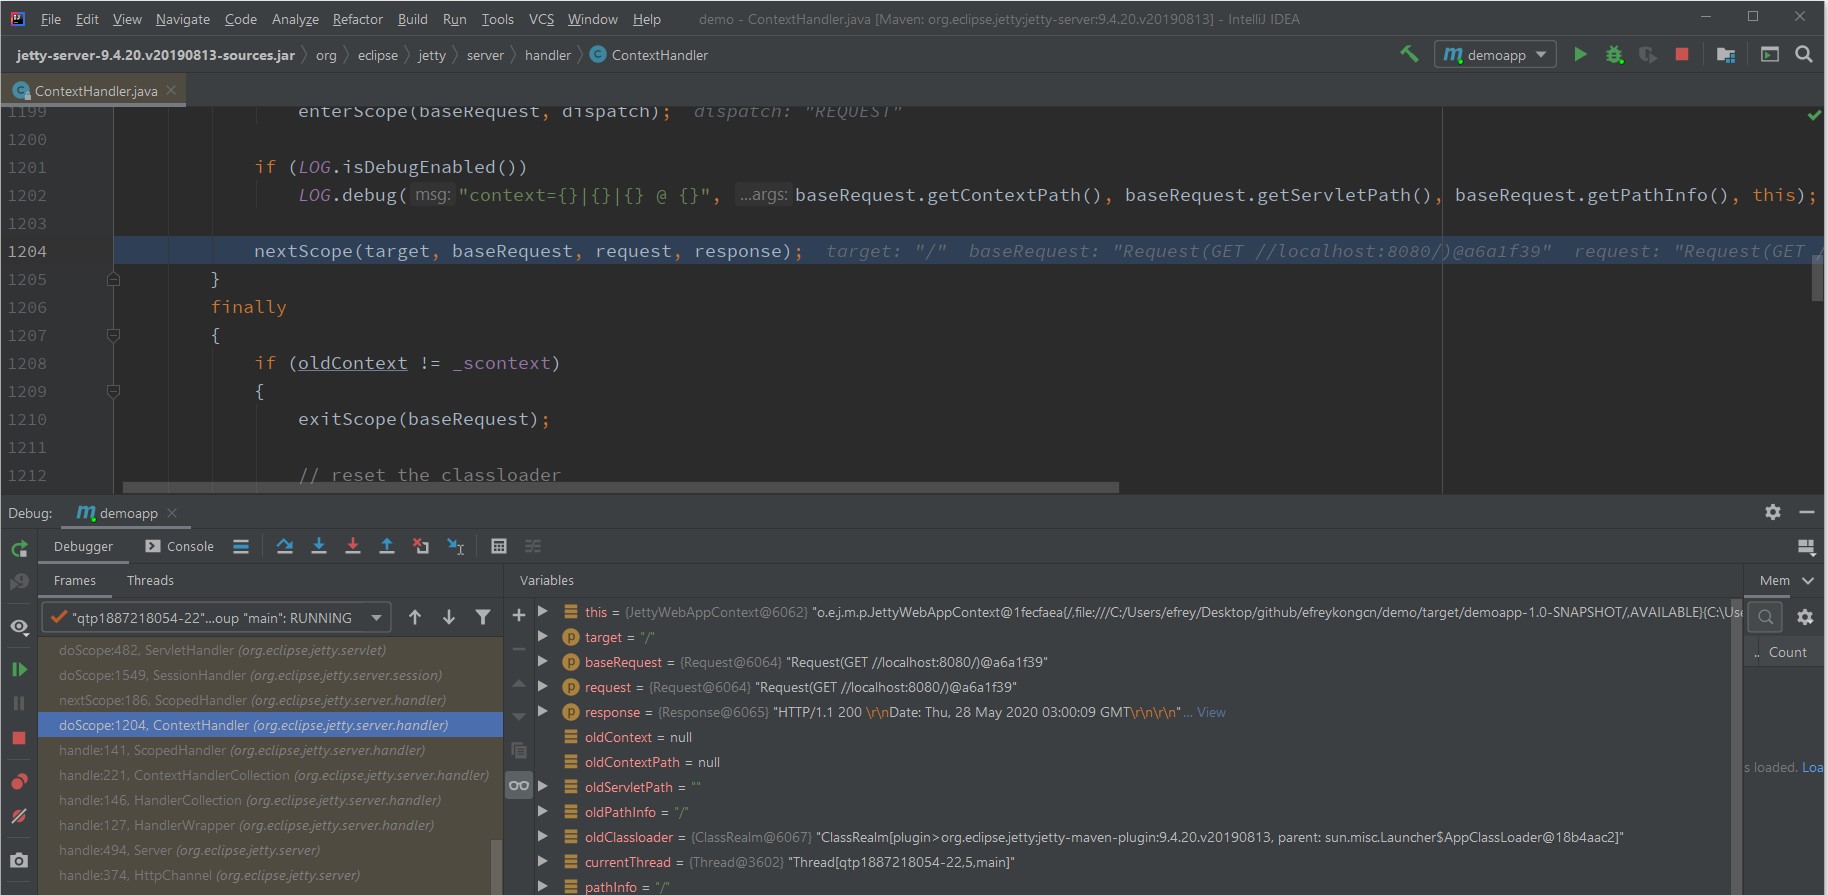
然后重启调试,进入断点后,在Debugger Frame的列表中点击Jetty的Frame,就可以查看到相应的源码了。

 浙公网安备 33010602011771号