[Machine Learning for Trading] {ud501} Lesson 17: 02-07 Dealing with Data | Lesson 18: 02-08 Efficient Markets Hypothesis
How data is aggregated
tick interval can be day, mintue, ... etc.
Price anomaly
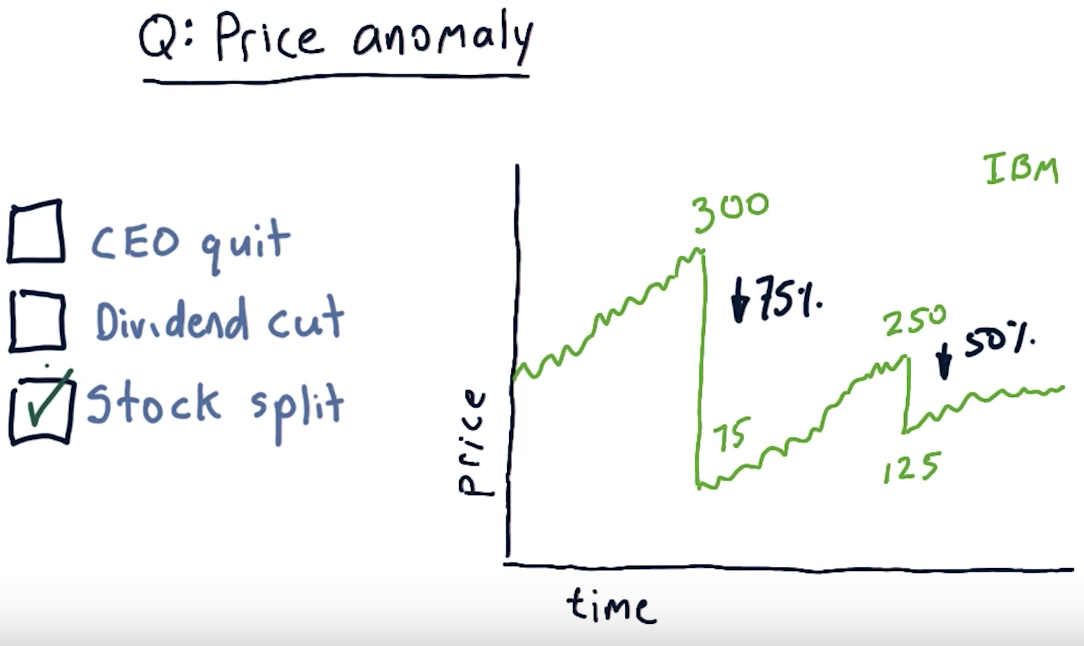
Stock splits
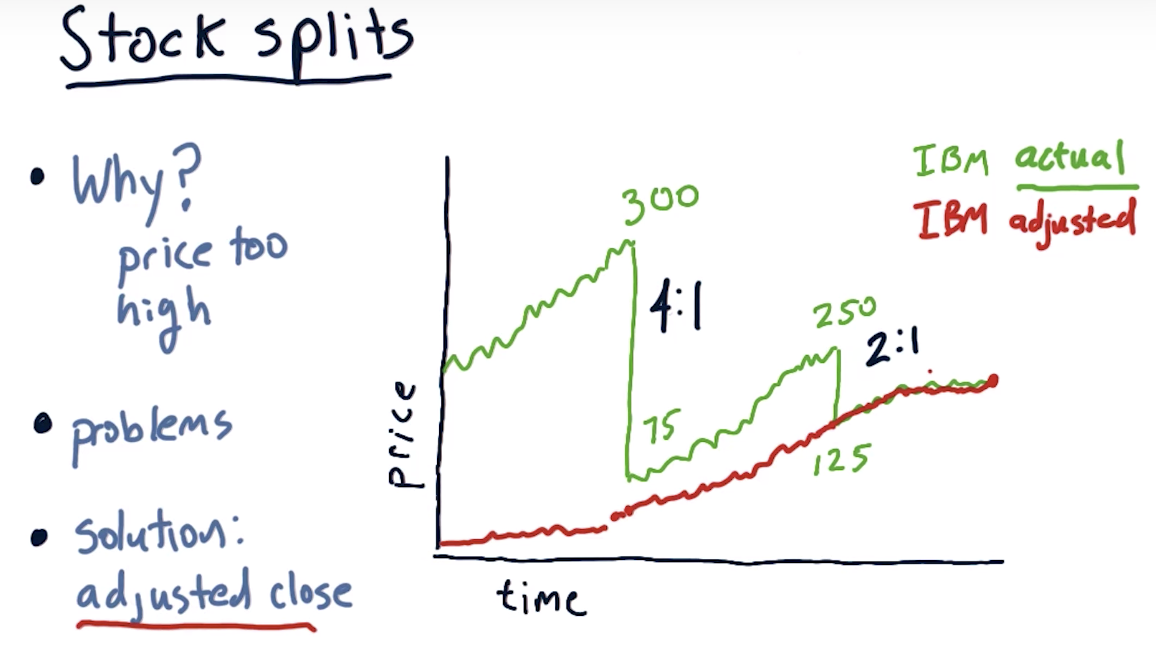
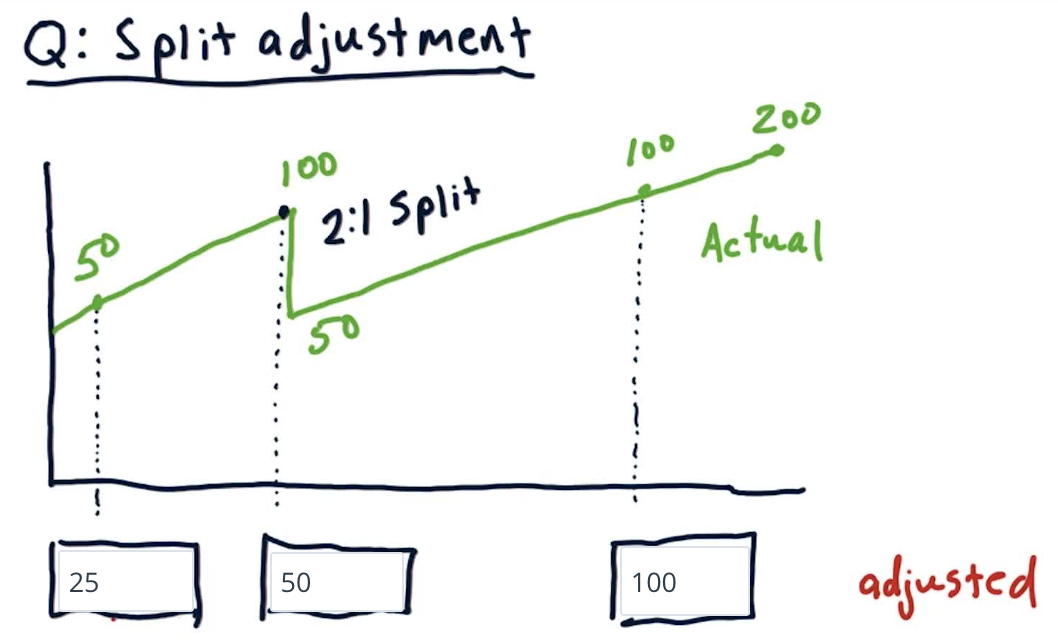
Split adjustment
Dividends
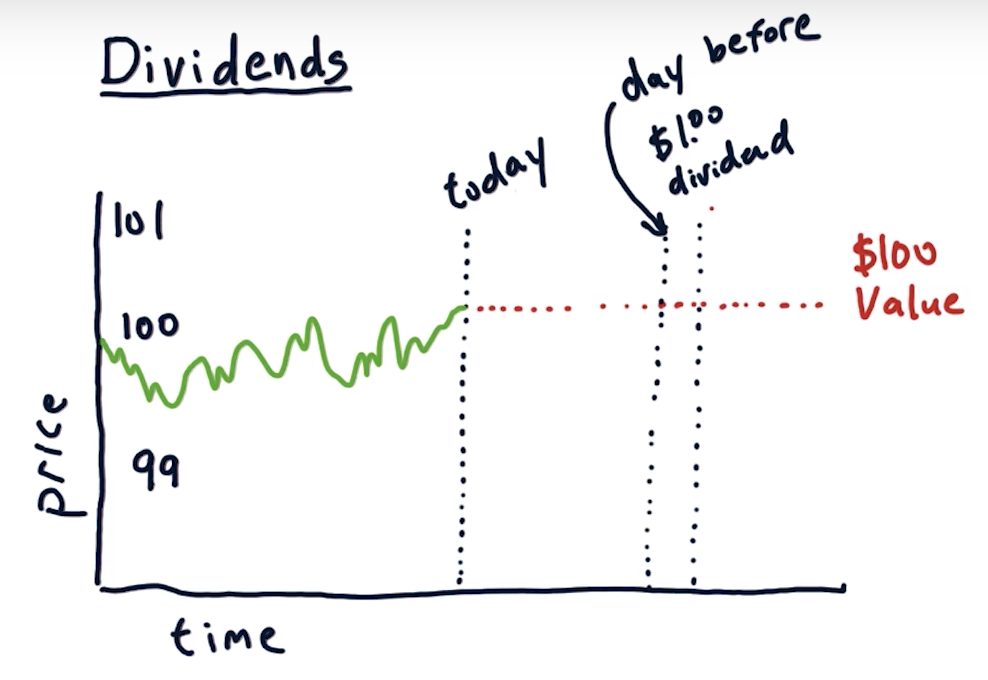
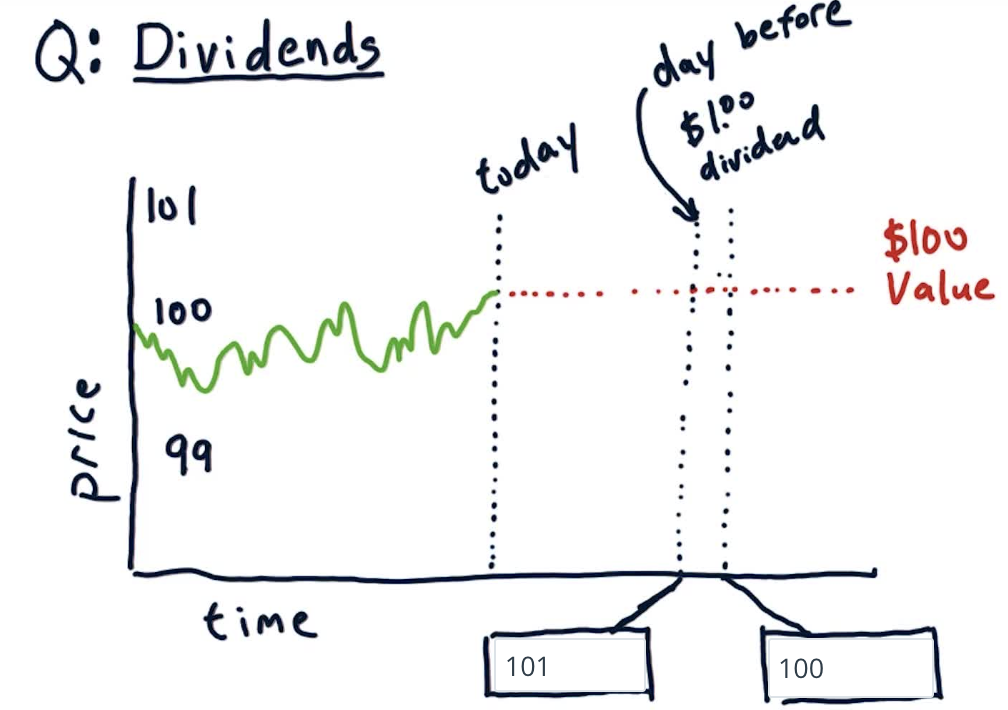
Adjusting for dividends

the close price of 2010 watched in 2012 is lower than the one watched in 2015 => due to the adjustment
Survivor bias
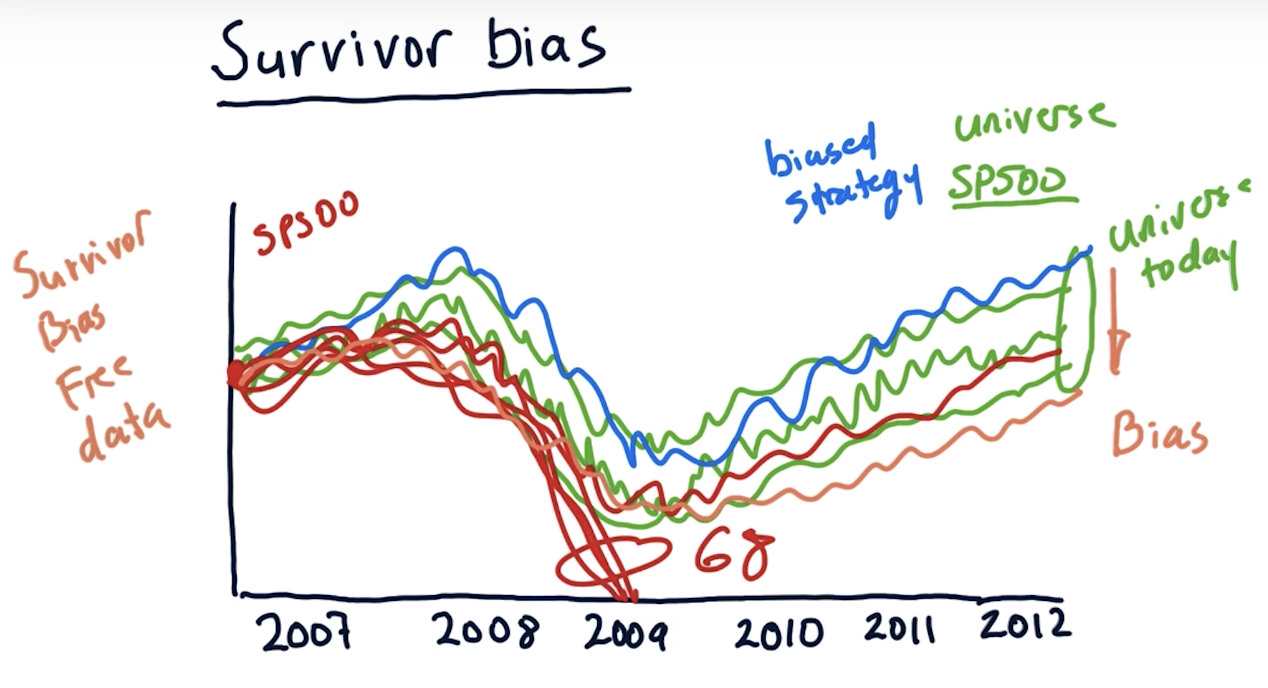
one common mistake is that they look at the membership of that universe as of today
then they go back in time and they use that list of stocks for their strategy
built-in bias => some stocks dies in SP500 and the current stocks in SP500 actually survives during these years!
the strategy trained without considering the survival bias => blue curve => used in real life => brown curve (lower performance)
=> eager for the survival-bias-free data => not free
Efficient Markets Hypothesis
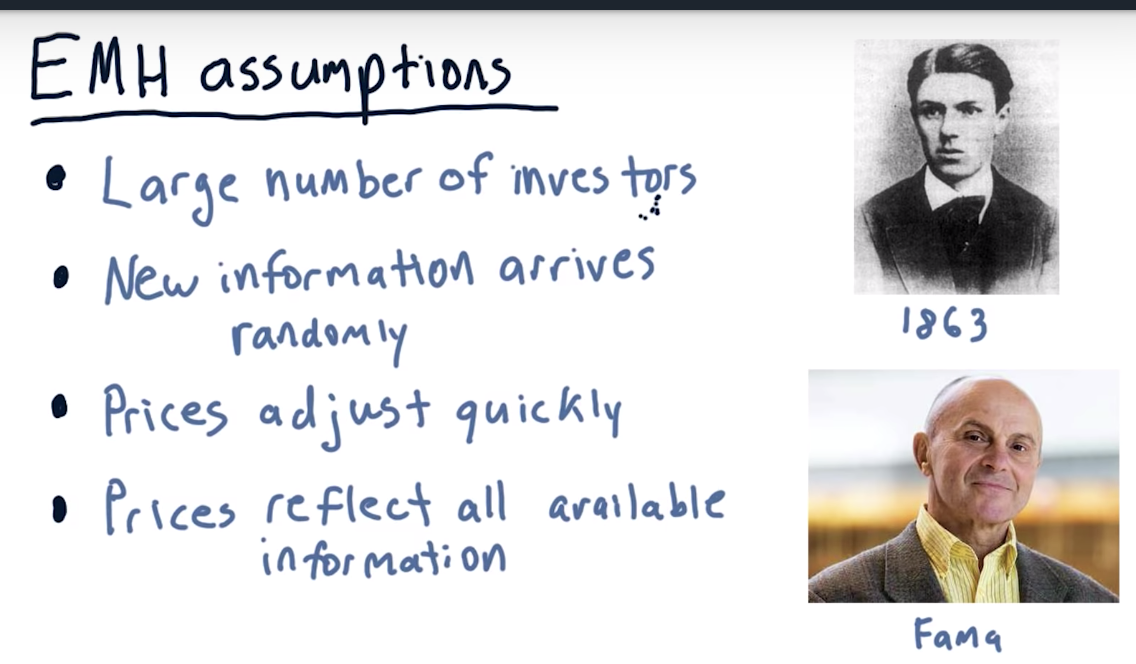
EMH assumptions
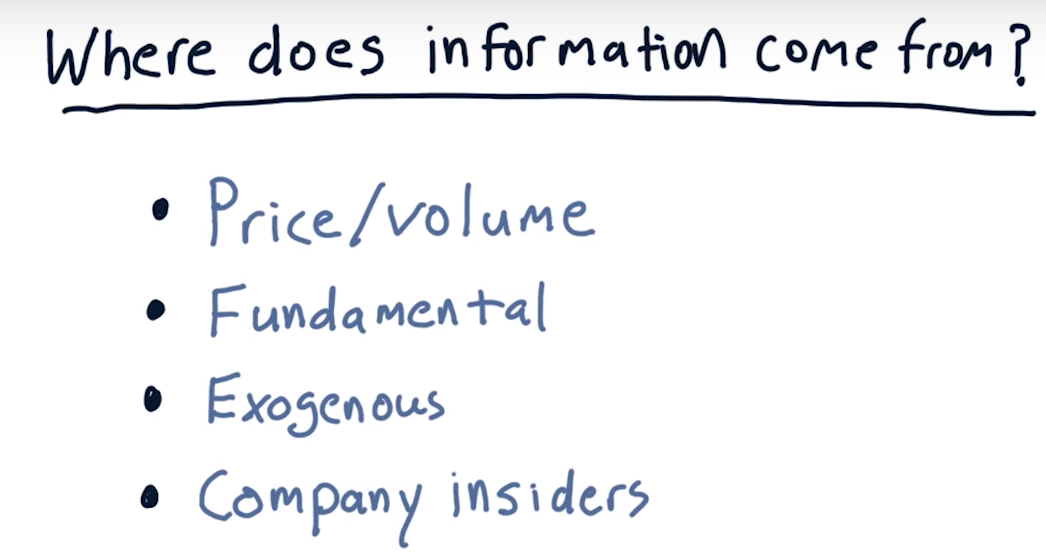
Origin of information
3 forms of the EMH
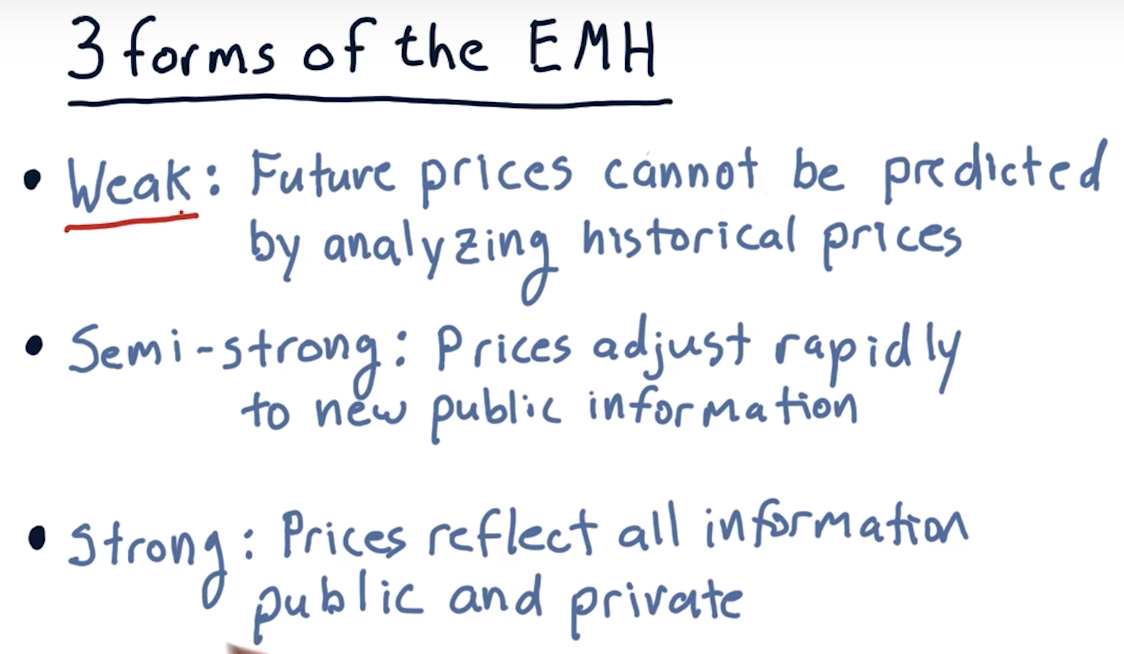
The EMH prohibits

weak => only technical analysis can't make profit
strong => any one of three types can't make profit
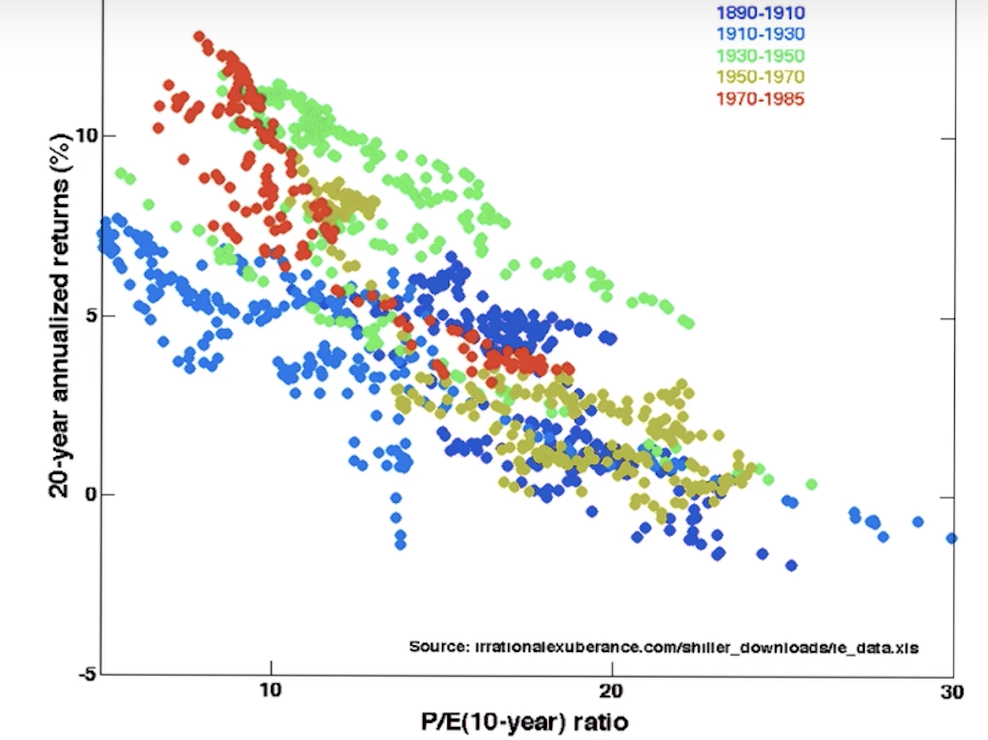
Is the EMH correct? => at least from data, the strong EMH is incorrect

 浙公网安备 33010602011771号