视频笔记 CppCon 2015: Chandler Carruth "Tuning C++: Benchmarks, and CPUs, and Compilers! Oh My!"
CppCon 2015: Chandler Carruth "Tuning C++: Benchmarks, and CPUs, and Compilers! Oh My!"
注:
- 转载请说明出处 http://www.cnblogs.com/eagledai/
-
视频中“废话”有点多,另外视频略微有点老,使用的编译器和OS都不一样,程序运行命令和结果都和笔记中的有部分不同。
-
例子中的 escape/clobber 有效,但是 ugly的技巧,google/benchmark 已经提供的 API: benchmark::DoNotOptimize/ benchmark::ClobberMemory()
10:50 Micro Benchmarks
用来benchmark一小段关键代码
12:00 Library on github
配置安装 google/benchmark (Ubuntu):
git clone https://github.com/google/benchmark.git
cd benchmark
# If you want to build tests and don't use BENCHMARK_DOWNLOAD_DEPENDENCIES, then
# git clone https://github.com/google/googletest.git
mkdir build
cd build
cmake .. -DCMAKE_BUILD_TYPE=RELEASE
make
# 安装到/usr/local/lib/ 和 usr/local/include/
sudo make install
示例文件(与视频没有直接关联):example.cpp (from https://github.com/google/benchmark)
#include <benchmark/benchmark.h>

static void BM_StringCreation(benchmark::State& state) {
  for (auto _ : state)
    std::string empty_string;
}
// Register the function as a benchmarkBENCHMARK(BM_StringCreation);

// Define another benchmarkstatic void BM_StringCopy(benchmark::State& state) {
  std::string x = "hello";
  for (auto _ : state)
    std::string copy(x);
}
BENCHMARK(BM_StringCopy);

BENCHMARK_MAIN();
运行示例:
g++ -O3 -o example example.cpp -std=c++17 -lbenchmark -lpthread
./example
-------------------------------------------------------------
Benchmark                  Time             CPU   Iterations
-------------------------------------------------------------
BM_StringCreation      0.000 ns        0.000 ns   1000000000
BM_StringCopy           6.06 ns         6.05 ns    120777531
视频18:25 vector/bench.cpp
bench_create 仅仅创建 vector,当做 baseline
#include <benchmark/benchmark.h>
#include <vector>

static void bench_create(benchmark::State& state) {
  for (auto _ : state) {
    std::vector<int> v;
    (void)v;
  }
}
BENCHMARK(bench_create);

static void bench_push_back(benchmark::State& state) {
  for (auto _ : state) {
    std::vector<int> v;
    v.push_back(42);
  }
}
BENCHMARK(bench_push_back);

BENCHMARK_MAIN();
运行结果:
Benchmark                Time             CPU   Iterations
-----------------------------------------------------------
bench_create         0.000 ns        0.000 ns   1000000000
bench_push_back       23.6 ns         23.5 ns     31392194
视频20:35 再加入 reserve,作为参照
static void bench_create(benchmark::State& state) {
  for (auto _ : state) {
    std::vector<int> v;
    (void)v;
  }
}
BENCHMARK(bench_create);

static void bench_reserve(benchmark::State& state) {
  for (auto _ : state) {
    std::vector<int> v;
    v.reserve(1);
  }
}
BENCHMARK(bench_reserve);

static void bench_push_back(benchmark::State& state) {
  for (auto _ : state) {
    std::vector<int> v;
    v.reserve(1);
    v.push_back(42);
  }
}
BENCHMARK(bench_push_back);

BENCHMARK_MAIN();
得到的结果和视频中的不一样!
Benchmark                Time             CPU   Iterations
-----------------------------------------------------------
bench_create         0.000 ns        0.000 ns   1000000000
bench_reserve         24.0 ns         24.0 ns     30147044
bench_push_back       25.7 ns         25.6 ns     26591367
视频截图却是:
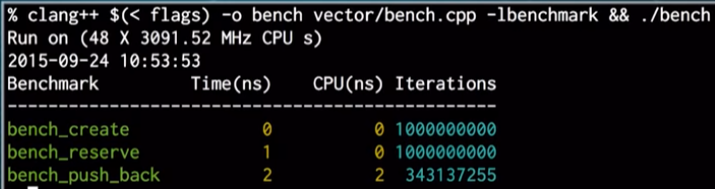
记录(其实是采样)并生成数据。-g 表示生成调用关系图。注:可能需要sudo,程序bug导致。
perf record -g ./bench
perf report -g
视频 28:40
可惜的是,上面的第一句命令的调用关系是反的。需要给 -g 额外参数。
-
下面额外的编译参数使用最小的代价(一个额外的寄存器)实现调用栈的动态定位,用来获得 call graph
-
'graph,0,5,caller'
-
graph: %统计数字是相对于总体的,而不是相对于父函数的
-
0.5: 是个filter,过滤掉数字小的函数
-
caller: 把 call graph 的关系倒过来,更符合普通人的习惯
-
注:验证并没有效果,原因可能是 -O3优化太厉害,导致采样定位不准,换 -O2,可以数据较好看的 call graph,但程序运行要慢一些
依照视频,命令如下:
g++ -O3 -o bench vector/bench.cpp -std=c++17 -fno-omit-frame-pointer -lbenchmark -lpthread
sudo perf record -g ./bench
sudo perf report -g 'graph,0.5,caller'
实际采用O2, 甚至O1(根据需要),就可以得到比较好看好分析的 call graph。问题在于,-O2 较慢,只能参考,真正结果还是需要 -O3
g++ -O2 -o bench vector/bench.cpp -std=c++17 -fno-omit-frame-pointer -lbenchmark -lpthread
sudo perf record -g ./bench
sudo perf report -g
视频 39:00
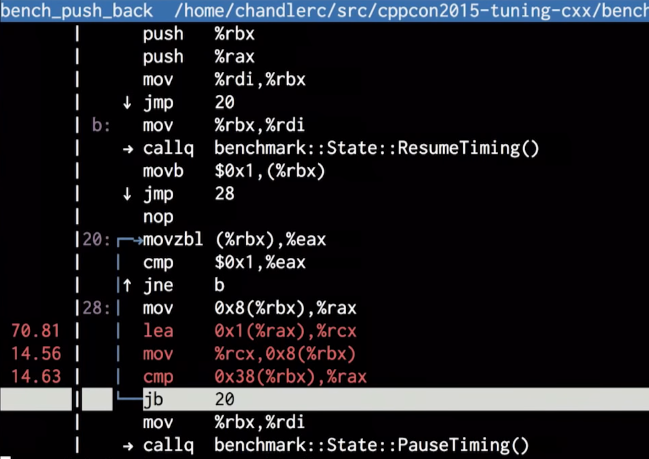
震惊:汇编显示,竟然没有生成 vector,全部被编译器优化掉了!编译器发现代码什么都没有做,干脆删掉。
视频 41:00 - 性能分析,怎么避免需要的代码不被优化
引入神奇的 escape 函数,关闭针对任意指针p的优化,适用于 clang, gcc, icc
static void escape(void *p) {
  asm volatile("" : : "g"(p) : "memory");
}
-
volatile: 告诉编译器,该汇编代码具有side effect,不要去优化汇编。一个例子,需要某段汇编生成确定8个字节的机器码,具有特殊用途,请编译器不要自作聪明去优化它
-
该段代码意思是:接受地址 p 作为汇编的输入,可能把该地址的内容保存在内存的任何地方,也就是可能改变所有的内存,尽管事实上,什么也没去改变。其实是欺骗编译器,所以编译器会关闭优化
-
gcc/clang inline 汇编语法
-
string : CSV of outputs : CSV of inupts : list of clobbers
-
outputs: inline asm => C++
-
inputs: C++ => inline asm
-
clobber: what parts of the program it modified
static void clobber() {
  asm volatile("" : : : "memory");
}
-
告诉编译器我们要往任何内存写数据,或者从任何内存读数据,但其实什么也没有做,没有代码产生
把 escape 和 clobber 应用到代码:
static void bench_create(benchmark::State& state) {
  for (auto _ : state) {
    std::vector<int> v;
    escape(&v); // 需要保证向量地址可见
    (void)v;
  }
}
BENCHMARK(bench_create);

static void bench_reserve(benchmark::State& state) {
  for (auto _ : state) {
    std::vector<int> v;
    v.reserve(1);
    escape(v.data()); // 仅仅需要保证向量分配的内存可见,向量地址本身并不重要
  }
}
BENCHMARK(bench_reserve);

static void bench_push_back(benchmark::State& state) {
  for (auto _ : state) {
    std::vector<int> v;
    v.reserve(1);
    escape(v.data()); // 同上
    v.push_back(42);
    clobber(); // 表示我们需要读写任意地址,所以向量的 push_back 不会被优化掉
    // 很多人使用 no inline attribute 来实现同样的目的,但是有时不起作用(跨越函数边界来优化的时候),即使起作用的时候,
    // 我们还是希望需要 inline 的时候任然有 inline,函数的开销更大,不是真实的数字。
    // 问题:为什么有了 clobber,还需要上面的 escape?
    //      因为 v.reserve(1) 内部的内存分配对 clobber() 并不可见,除非使用 escape() 来注册过了
  }
}
BENCHMARK(bench_push_back);
更多有关 escape/clobber 的信息: https://stackoverflow.com/questions/40122141/preventing-compiler-optimizations-while-benchmarking/40149692
简而言之:
编译器的模型里是一个连通图,每个节点是一块分配的内存区域,边就是指针,具有一个全局的假象的根指针,作为图的入口。新分配的内存(如上面最后一段代码中 v.reserve(1)分配的内存)并不自动加入这个图。escape(p) 保证 p 加入该连通图,相当于一个注册函数。
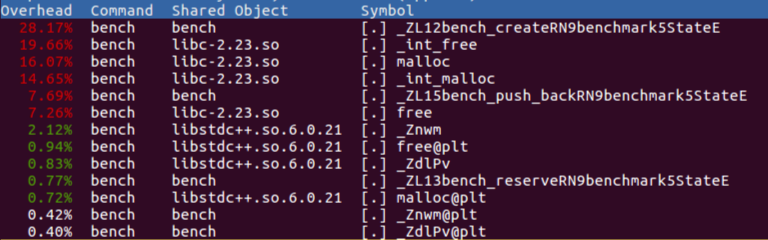
重新编译,profiling (注意,这里使用 O3 优化,perf 也不需要奇怪的参数,perf这几年应该对默认参数有所改进)
g++ -O3 -o bench vector/bench.cpp -std=c++17 -fno-omit-frame-pointer -lbenchmark -lpthread
sudo perf record ./bench
sudo perf report
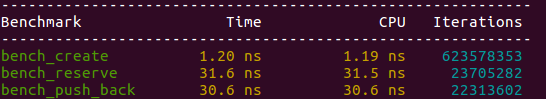
新的结果,
-
上图中 bench_create 不再是0了!编译器不再把该代码段给优化没有了
-
下图中 bench_create 比例较大,但是考虑 google/benchmark 给了它更多的 iterations,并不奇怪
视频 55:30 第二个示例
文件 fastmod/bench.cpp
#include <benchmark/benchmark.h>
#include <vector>
#include <random>

static void generate_arg_pairs(benchmark::internal::Benchmark *b) {
  for (int i = 1 << 4; i <= 1 << 10; i <<= 2) {
    for (int j : {32, 128, 224}) {
      b = b->ArgPair(i, j);
    }
  }
}

static void bench_fastmod(benchmark::State& state) {
  const int size = state.range(0);
  assert(size >= 16 && "Only support 16 intergers at a time!");
  const int ceil = state.range(1);
  std::vector<int> input, output;
  input.resize(size, 0);
  output.resize(size, 0);

  std::mt19937 rng;
  rng.seed(std::random_device()());
  std::uniform_int_distribution<int> dist(0, 255);
  for (int &i : input) {
    i = dist(rng);
  }

  for (auto _ : state) {
    for (int i = 0; i < size; ++i) {
      output[i] = input[i] >= ceil ? input[i] % ceil : input[i];
    }
  }
}

BENCHMARK(bench_fastmod)->Apply(generate_arg_pairs);
BENCHMARK_MAIN();
分析:这里是想评估特殊的 mod 操作(小于 ceil 时直接返回,大于时才进行 mod)。之所以要进行此改进,是因为 mod 的代价非常的大。
程序可以接受4 x 3的输入参数组合。输入参数1是输入/输出向量大小,2是 ceil 参数。输入向量填入随均匀分布的机数。
注:代码及命令均与视频有差异,已经根据OS,编译器 和 benchmark 版本进行改变。
g++ -O3 -o bench fastmod/bench.cpp -std=c++17 -fno-omit-frame-pointer -lbenchmark -lpthread
./bench
------------------------------------------------------------------
Benchmark                       Time             CPU   Iterations
------------------------------------------------------------------
bench_fastmod/16/32          38.5 ns         38.1 ns     19470616
bench_fastmod/16/128         20.6 ns         20.4 ns     24558625
bench_fastmod/16/224         13.1 ns         13.0 ns     51348951
bench_fastmod/64/32           158 ns          157 ns      5024877
bench_fastmod/64/128          106 ns          106 ns      6906793
bench_fastmod/64/224         60.8 ns         60.3 ns     10373068
bench_fastmod/256/32          701 ns          698 ns      1078959
bench_fastmod/256/128         365 ns          363 ns      1746600
bench_fastmod/256/224         211 ns          210 ns      3296786
bench_fastmod/1024/32        2799 ns         2788 ns       249359
bench_fastmod/1024/128       2516 ns         2508 ns       290976
bench_fastmod/1024/224       1763 ns         1758 ns       402332
分析:当 ceil 大的时候,很多mod操作被省略,程序变快!与预期相符。
sudo perf record ./bench
sudo perf report
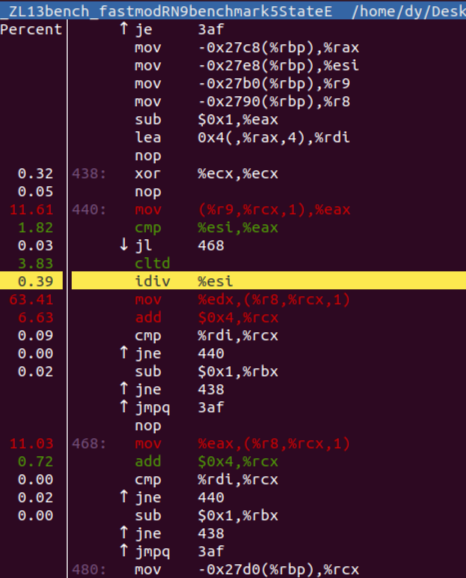
分析:
-
出乎预料,idiv 指令只占用很少的时间,而后面的 mov 却数字惊人。这是由于工具采样错误造成的。事实上,随后的指令时间应该基本上算到 idiv 身上
-
视频中,idiv 出现两次,这是它所用的编译器进行的优化(一个循环内代码重复两次,循环次数减少一半)。我使用的编译器并没有生成这个优化。但不印象随后的手动优化:重复四次!
static void bench_fastmod(benchmark::State& state) {
   ...

  for (auto _ : state) {
    for (int i = 0; i < size; i += 4) {
#define mod(o) \
  output[i + o] = input[i + o] >= ceil ? input[i + o] % ceil : input[i + o];
      mod(0);
      mod(1);
      mod(2);
      mod(3);
    }
  }
}

------------------------------------------------------------------
Benchmark                       Time             CPU   Iterations
------------------------------------------------------------------
bench_fastmod/16/32          29.4 ns         29.4 ns     22096061
bench_fastmod/16/128         19.5 ns         19.5 ns     39823845
bench_fastmod/16/224         8.87 ns         8.86 ns     65449028
bench_fastmod/64/32           126 ns          126 ns      5407309
bench_fastmod/64/128         84.2 ns         84.1 ns      8509984
bench_fastmod/64/224         44.7 ns         44.7 ns     18966107
bench_fastmod/256/32          506 ns          506 ns      1399732
bench_fastmod/256/128         335 ns          334 ns      1933547
bench_fastmod/256/224         168 ns          168 ns      4090361
bench_fastmod/1024/32        2136 ns         2130 ns       359540
bench_fastmod/1024/128       1410 ns         1409 ns       492857
bench_fastmod/1024/224        645 ns          644 ns      1033980
分析:
-
视频中并没有改善很多,但这里的结果改善还是很明显。可能的原因是视频中是从2到4,这里是从1到4
使用 filter 只抓取其中一组数据:
sudo perf record ./bench --benchmark_filter=bench_fastmod/1024/128
sudo perf report
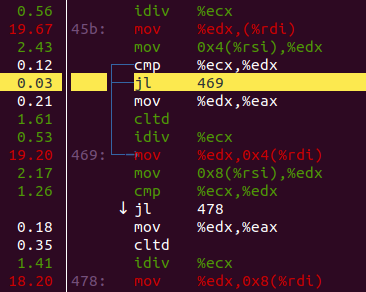
分析:
-
慢的原因是,很多跳转,造成 icache misses
-
怎么修?我们知道大多数的数字比 ceil 要小,我们需要让编译器也明白这点!
#define UNLIKELY(x) __builtin_expect((bool)(x), 0)
...
#define mod(o) \
  output[i + o] = UNLIKELY(input[i + o] >= ceil) ? input[i + o] % ceil : input[i + o];

------------------------------------------------------------------
Benchmark                       Time             CPU   Iterations
------------------------------------------------------------------
bench_fastmod/16/32          34.5 ns         34.3 ns     20429463
bench_fastmod/16/128         20.3 ns         20.1 ns     37576458
bench_fastmod/16/224         12.7 ns         12.7 ns     91676108
bench_fastmod/64/32           138 ns          138 ns      5087081
bench_fastmod/64/128         79.2 ns         79.1 ns      7661134
bench_fastmod/64/224         36.8 ns         36.7 ns     18236189
bench_fastmod/256/32          519 ns          518 ns      1286709
bench_fastmod/256/128         332 ns          332 ns      2024787
bench_fastmod/256/224         144 ns          144 ns      5263624
bench_fastmod/1024/32        2440 ns         2437 ns       288749
bench_fastmod/1024/128       1360 ns         1357 ns       466528
bench_fastmod/1024/224        578 ns          577 ns      1159231
分析:
-
ceil=32 的变慢了一些,因为编译器没有向这个方向优化,而是向着相反的方向优化
-
ceil=224 的快了一些,
sudo perf record ./bench --benchmark_filter=bench_fastmod/1024/224
sudo perf report
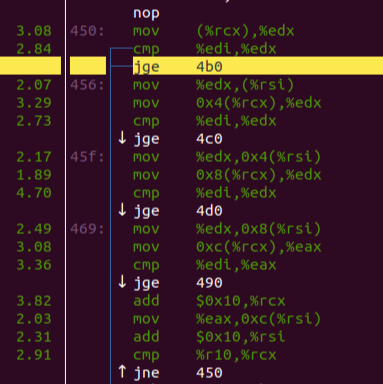
分析:
-
优化过的机器码认为跳转发生的概率低,基本可以不跳转,一路向下走
-
下面(未显示部分)的 idiv 部分,尽管只有20%的概率命中,仍然占据了CPU计算的主要时间
视频 1:11:00 以上 benchmark 都没有 baseline,需要加回来
static void bench_mod(benchmark::State& state) {
  const int size = state.range(0);
  assert(size >= 16 && "Only support 16 intergers at a time!");
  const int ceil = state.range(1);
  std::vector<int> input, output;
  input.resize(size, 0);
  output.resize(size, 0);

  std::mt19937 rng;
  rng.seed(std::random_device()());
  std::uniform_int_distribution<int> dist(0, 255);
  for (int &i : input) {
    i = dist(rng);
  }

  for (auto _ : state) {
    for (int i = 0; i < size; ++i) {
      output[i] = input[i] % ceil;
    }
  }
}
BENCHMARK(bench_mod)->Apply(generate_arg_pairs);
g++ -O3 -o bench fastmod/bench.cpp -std=c++17 -fno-omit-frame-pointer -lbenchmark -lpthread
./bench
------------------------------------------------------------------
Benchmark                       Time             CPU   Iterations
------------------------------------------------------------------
bench_mod/16/32              38.8 ns         38.6 ns     18027258
bench_mod/16/128             41.9 ns         41.8 ns     17730982
bench_mod/16/224             40.6 ns         40.5 ns     17564358
bench_mod/64/32               163 ns          163 ns      4248128
bench_mod/64/128              161 ns          161 ns      4376018
bench_mod/64/224              161 ns          160 ns      4338062
bench_mod/256/32              632 ns          631 ns      1090116
bench_mod/256/128             636 ns          635 ns      1083590
bench_mod/256/224             644 ns          643 ns      1095520
bench_mod/1024/32            2585 ns         2579 ns       271321
bench_mod/1024/128           2606 ns         2602 ns       272193
bench_mod/1024/224           2589 ns         2583 ns       274946
bench_fastmod/16/32          37.2 ns         37.2 ns     18993096
bench_fastmod/16/128         23.6 ns         23.6 ns     30564935
bench_fastmod/16/224         12.1 ns         12.1 ns     75911463
bench_fastmod/64/32           151 ns          151 ns      4424330
bench_fastmod/64/128         84.2 ns         83.4 ns      8381393
bench_fastmod/64/224         38.5 ns         38.2 ns     22431970
bench_fastmod/256/32          499 ns          495 ns      1271434
bench_fastmod/256/128         341 ns          339 ns      1982904
bench_fastmod/256/224         135 ns          134 ns      5086716
bench_fastmod/1024/32        2064 ns         2053 ns       331504
bench_fastmod/1024/128       1360 ns         1353 ns       545493
bench_fastmod/1024/224        596 ns          594 ns      1119850
事实是,fastmod 确实快了一些,特别在 ceil 大的时候。即便在 ceil 小的时候,也有点点改善。
视频 1:14:30 - Q & A
|
视频时间
|
问题
|
回答
|
|
1:14:45
|
perf 里的函数名字哪里来的?
|
程序的二进制代码里面就有
|
|
1:15:12
|
程序里随机数序列是否严格相同?
|
不,但都是均匀分布,而且效果看起来还不错,并没有给 benchmark 带来明显的差异
|
|
1:15:58
|
能不能用 std::chrone 获得时间
|
可以,但是这是 framework 所做的
|
|
1:16:51
|
为什么使用 omit frame pointer参数
|
其它的选项 dwarf unwinding,常常miss掉数据,难以信赖。frame pointer总能获得一致性的结果。
另一个LBR工具很不错,但有时会放大随机错误,导致不准确。
|
|
|
为什么不使用更准确的参数来测量,例如时钟周期,cache misses,指令数
|
Perf 里有很多特征,这里没有时间来细述
|
|
1:18:23
|
昨天有人聊到benchmark冷热不同的代码。google/benchmark为什么不跳过开始的冷代码?
|
有这么多次 iterations,不认为有必要跳过开始的那几轮
|
|
1:19:04
|
为什么不用 flag 关闭优化,就不用担心代码被移除?
|
我可以使用 flag 关闭优化,但问题也在于所有优化被关闭。我希望benchmark的是优化过的代码,更加接近真实生产场景,仅仅希望需要的优化被保留,而不优化掉不该的部分。
|
|
1:19:43
|
例子中采样有错误,为什么不增加采样速率?
|
采样速率增加不能解决这里的问题,这里的真实问题在于收集采样数据的方法。
|
|
|
向量指令benchmark偏差,Perf 工具有神么方法解决?
|
我不认为 Perf 里面有办法解决此问题,“我”自己的方法是, Perf以提供最原始的数据,再结合大脑的分析和修正,应该可以部分解决此问题。另外一个很好的工具是 Intel Architecture Code Analyzer。用户可以输入一段指令,它可以在Intel架构模型上解释这段指令该如何执行。有了这个数据作为参照,即使CPU有偏差,可以推断出对应的数据。“我”其实不信任任何工具帮我修正这些偏差,基本都要靠我自己的分析。
|
|
1:21:43
|
另外一种让编译器不要过于聪明的优化掉被测的不做实质工作代码的方法,是把结果输出到 volatile 变量中。相比 前面的 clobber 函数的方法,各有什么特点和不同? |
是的,有多种方法,包含使用 volatile 变量的方法。过去使用 volatile 变量的方法有个问题,它太迟了,尤其是当benchmark的是一个内存操作序列的时候,例如一序列的push_back calls,这种 volatile 变量法可能会消除掉全部的 push_back 调用,直接保存一个常量到 volatile 变量里。
提问者:volatile 方法另一个问题是,你可以保证它可读(可见性),但不能保证它可写。
是的,“我”的代码更通用,你可以更精确的保留需要保留的代码。另一个把 clopper 放在尾部的原因,可以防止编译器进行 loop computation analysis,就是提前算好结果,然后直接保存结果。这种优化在真是生成环境中并不会发生,因为还有上下文的存在。
|
|
1:25:00
|
escape 函数接受一个指针作为参数,并不知道它指向数据的大小,结构,甚至是个 vector,编译器怎么能理解它的数据大小和结构呢?
|
编译器并不理解指针的结构。
asm volatile("" : : "g"(p), "memory");
汇编中clobber参数用的是 "memory",意思是要 r/w 所有的内存。编译器认为,inline asm“看不见“的地方并不被认为是 memory,所以需要一个指针把它一块内存注册进入,后面 clobber() 调用时,才可以被编译器保证不被优化扔掉。
|
|
1:27:14
|
你有没有使用 gtest 或者其他工具来做 benchmark 的回归测试?
|
我个人没有做 benchmark 类的回归测试。搞编译器的人一般接受一定的性能波动,有时甚至是相当大的波动,我们需要常常进行回归测试来跟踪性能。但是一般不会使用固定的框架,因为没有固定的代表性数字标准,也没有固定的代表性机器。对于搞编译器的人,挺难使用此类方法。
|
|
1:28:08
|
我发现一个性能问题,我是该把它抠出来研究,还是整体一起 benchmark
|
都需要。先整体评估,然后把代码隔离,具体分析。
|
|
1:29:12
|
关于 LIKELY/UNLIKELY,有没有工具可以显示出,假如你说这是 unlikely,但是我的运行发现它和你宣称的不一致?
|
我的方法是人工去看。我想 VTune 或者其它工具也许有这个功能,但我还不是很清楚。
|


 浙公网安备 33010602011771号