

服务容错保护断路器Hystrix之三:断路器监控(Hystrix Dashboard)-单体监控
turbine:英 [ˈtɜ:baɪn] 美 [ˈtɜ:rbaɪn] n.汽轮机;涡轮机;透平机
一、Hystrix Dashboard简介
在微服务架构中为了保证程序的可用性,防止程序出错导致网络阻塞,出现了断路器模型。断路器的状况反应了一个程序的可用性和健壮性,它是一个重要指标。Hystrix Dashboard是作为断路器状态的一个组件,提供了数据监控和友好的图形化界面。
本文我们将从两个方面来看Hystrix仪表盘的使用,一方面是监控单体应用,另一方面则整合Turbine,对集群进行监控。
背景
Hystrix除了隔离依赖服务的调用外,Hystrix还提供了近乎实时的监控,Hystrix会实时的,累加的记录所有关于HystrixCommand的执行信息,包括执行了每秒执行了多少请求,多少成功,多少失败等等,更多指标请查看:https://github.com/Netflix/Hystrix/wiki/Metrics-and-Monitoring
导出监控数据
有了这些指标,Netflix还提供了一个类库(hystrix-metrics-event-stream:https://github.com/Netflix/Hystrix/tree/master/hystrix-contrib/hystrix-metrics-event-stream)把这些指标信息以‘text/event-stream’的格式开放给外部使用,用法非常简单,首先,把hystrix-metrics-event-stream库添加到项目中:
dependencies {
    compile(
             ...
            'com.netflix.hystrix:hystrix-metrics-event-stream:1.3.9',
            ...
    )
}
然后,在web.xml中配置一个Servlet来获取Hystrix提供的数据:
<servlet>
        <description></description>
        <display-name>HystrixMetricsStreamServlet</display-name>
        <servlet-name>HystrixMetricsStreamServlet</servlet-name>
        <servlet-class>com.netflix.hystrix.contrib.metrics.eventstream.HystrixMetricsStreamServlet</servlet-class>
    </servlet>

    <servlet-mapping>
        <servlet-name>HystrixMetricsStreamServlet</servlet-name>
        <url-pattern>/hystrix.stream</url-pattern>
    </servlet-mapping>
配置好,重新启动应用。访问http://hostname:port/appname/hystrix.stream, 可以看到如下的输出:
data: {"type":"HystrixCommand","name":"Address","group":"Address","currentTime":1393154954462,"isCircuitBreakerOpen":false,"errorPercentage":0,"errorCount":0,"requestCount":0,"rollingCountCollapsedRequests"......
系统会不断刷新以获取实时的数据。
从上面的输出可以看到,这样的纯字符输出可读性实在太差,运维人员很难从中就看出系统的当前状态,于是Netflix又开发了一个开源项目(Dashboard:https://github.com/Netflix/Hystrix/wiki/Dashboard)来可视化这些数据,帮助运维人员更直观的了解系统的当前状态。
二、监控单体应用
监控环境搭建
不管是监控单体应用还是Turbine集群监控,我们都需要一个Hystrix Dashboard,当然我们可以在要监控的单体应用上继续添加功能,让它也具备仪表盘的功能,但是这样并不符合我们微服务的思想,所以,Hystrix仪表盘我还是单独创建一个新的工程专门用来做Hystrix Dashboard。OK,在Spring Cloud中创建一个Hystrix Dashboard非常简单,如下:
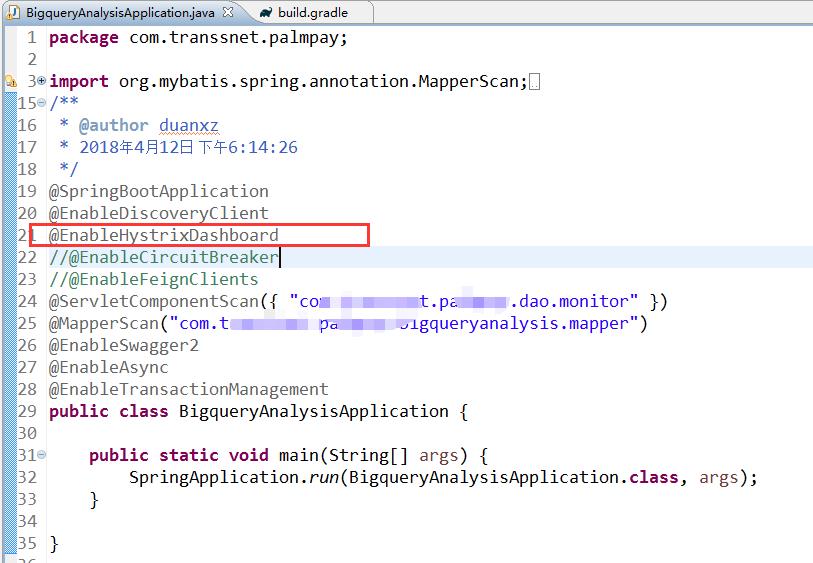
在现有的单体应用上添加Hystrix Dashboard功能
例如:在之前的工程上jar和开启Hystrix Dashboard功能
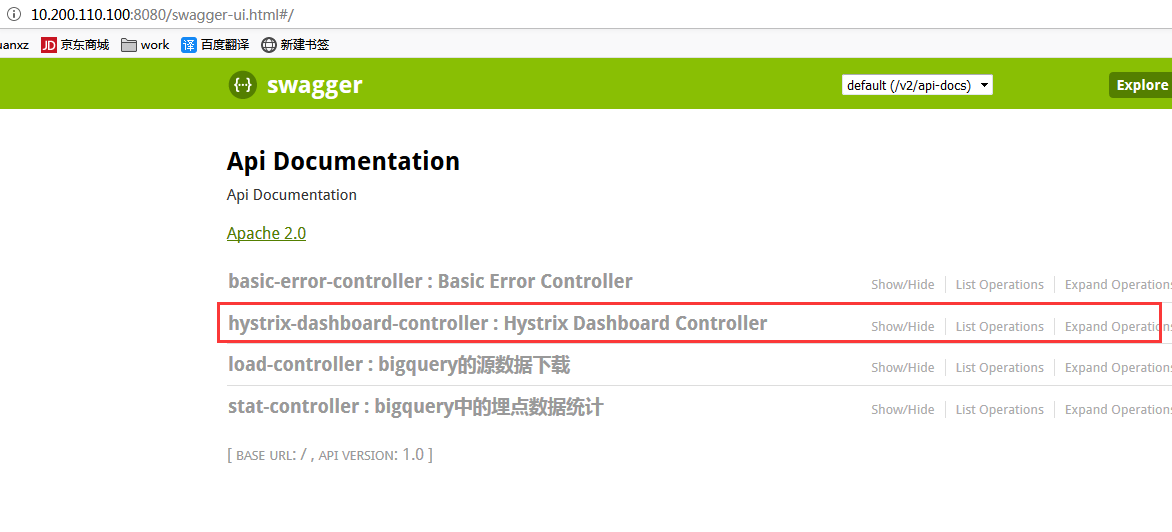
其它什么都不需要修改,启动后,看swagger:
第一步:创建一个普通的Spring Boot工程
创建一个Spring Boot工程这个比较简单,直接创建一个名为hystrix-dashboard的Spring Boot工程。
本文涉及2个工程:
一个有熔断功能的示例,前面文章《服务容错保护断路器Hystrix之一:入门介绍》中的ribbon-consumer
一个是新建的断路器监控(Hystrix Dashboard)工程
三、开始创建断路器监控(Hystrix Dashboard)
创建一个hystrix-dashboard的springboot工程,pom的工程文件引入相应的依赖:
<?xml version="1.0" encoding="UTF-8"?>
<project xmlns="http://maven.apache.org/POM/4.0.0" xmlns:xsi="http://www.w3.org/2001/XMLSchema-instance"
    xsi:schemaLocation="http://maven.apache.org/POM/4.0.0 http://maven.apache.org/xsd/maven-4.0.0.xsd">
    <modelVersion>4.0.0</modelVersion>

    <groupId>com.dxz.dashboard</groupId>
    <artifactId>dashboard</artifactId>
    <version>0.0.1-SNAPSHOT</version>
    <packaging>jar</packaging>

    <name>hystrix-dashboard</name>
    <description>dashboard project for Spring Boot</description>

    <parent>
        <groupId>org.springframework.boot</groupId>
        <artifactId>spring-boot-starter-parent</artifactId>
        <version>1.3.5.RELEASE</version>   <!--配合spring cloud版本 -->
        <relativePath /> <!-- lookup parent from repository -->
    </parent>
    <properties>
        <!--设置字符编码及java版本 -->
        <project.build.sourceEncoding>UTF-8</project.build.sourceEncoding>
        <java.version>1.8</java.version>
    </properties>
    <dependencies>
        <!--增加hystrix的依赖 -->
        <dependency>
            <groupId>org.springframework.cloud</groupId>
            <artifactId>spring-cloud-starter-hystrix</artifactId>
        </dependency>
        <!--增加dashboard的依赖 -->
        <dependency>
            <groupId>org.springframework.cloud</groupId>
            <artifactId>spring-cloud-starter-hystrix-dashboard</artifactId>
        </dependency>
        <!--用于测试的,本例可省略 -->
        <dependency>
            <groupId>org.springframework.boot</groupId>
            <artifactId>spring-boot-starter-test</artifactId>
            <scope>test</scope>
        </dependency>
    </dependencies>

    <!--依赖管理,用于管理spring-cloud的依赖 -->
    <dependencyManagement>
        <dependencies>
            <dependency>
                <groupId>org.springframework.cloud</groupId>
                <artifactId>spring-cloud-starter-parent</artifactId>
                <version>Brixton.SR3</version>   <!--官网为Angel.SR4版本,但是我使用的时候总是报错 -->
                <type>pom</type>
                <scope>import</scope>
            </dependency>
        </dependencies>
    </dependencyManagement>

    <build>
        <plugins>
            <!--使用该插件打包 -->
            <plugin>
                <groupId>org.springframework.boot</groupId>
                <artifactId>spring-boot-maven-plugin</artifactId>
            </plugin>
        </plugins>
    </build>
</project>
在程序的入口HystrixDashboardApplication类,加上@EnableHystrixDashboard注解开启断路器,开启HystrixDashboard
package com.dxz.dashboard;

import org.springframework.boot.SpringApplication;
import org.springframework.boot.autoconfigure.SpringBootApplication;
import org.springframework.cloud.netflix.hystrix.dashboard.EnableHystrixDashboard;

@EnableHystrixDashboard
@SpringBootApplication
public class HystrixDashboardApplication {

    public static void main(String[] args) {
        SpringApplication.run(HystrixDashboardApplication.class, args);
    }
}
配置端口信息application.properties
spring.application.name=hystrix-dashboard
server.port=2259
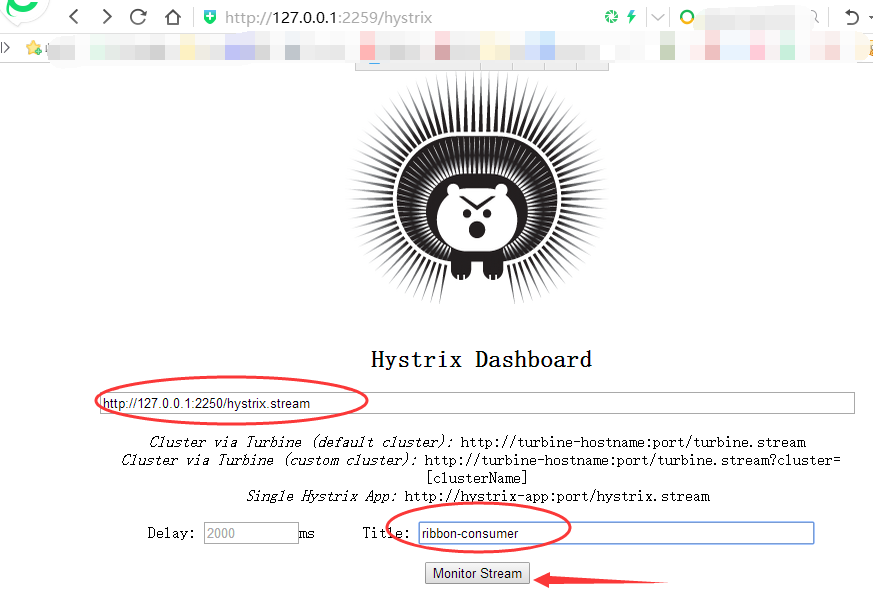
运行程序,访问http://127.0.0.1:2259/hystrix
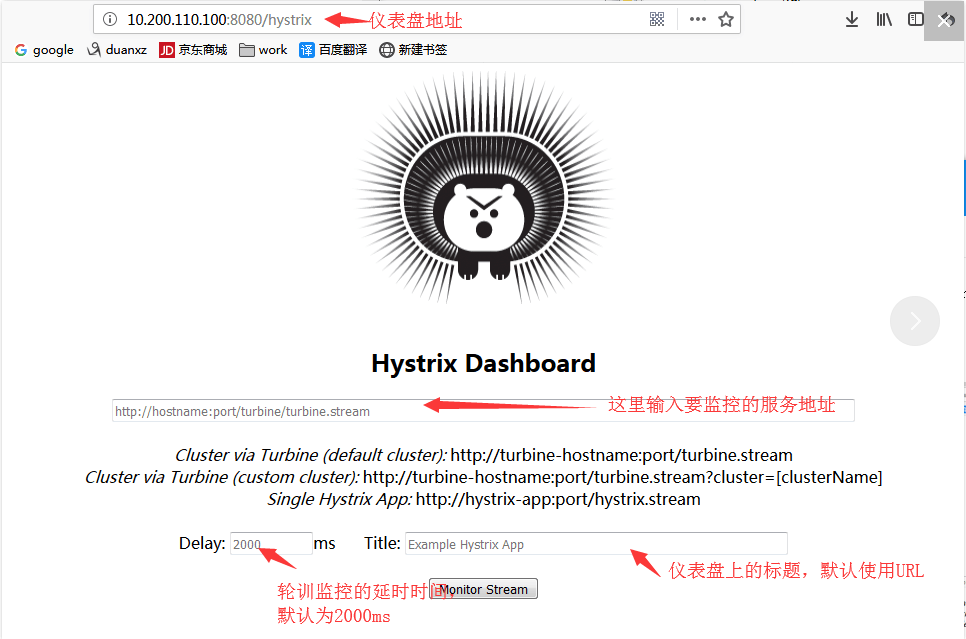
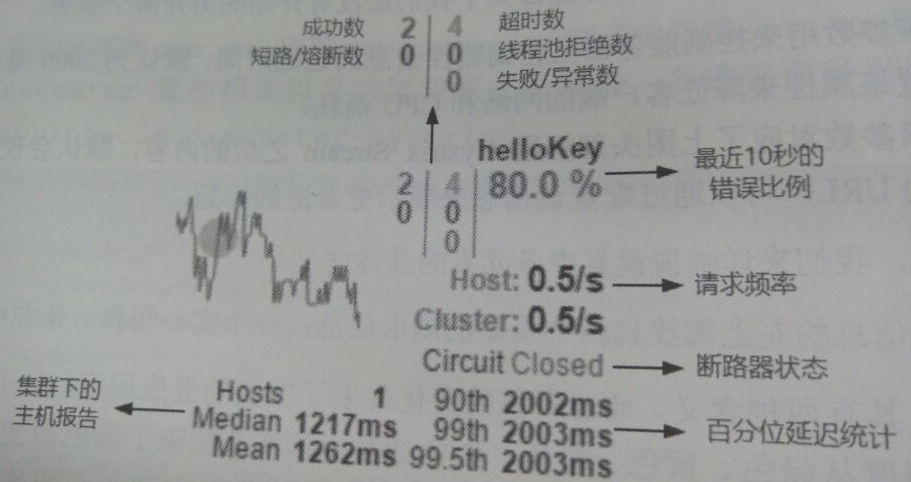
三个参数的含义我已在图中标注出来了。
OK,现在我们的仪表盘工程已经创建成功了,但是还不能用来监控某一个服务,要监控某一个服务,需要该服务提供一个/hystrix.stream接口,so,我们需要对我们的服务消费者工程稍加改造。
改造要监控的服务
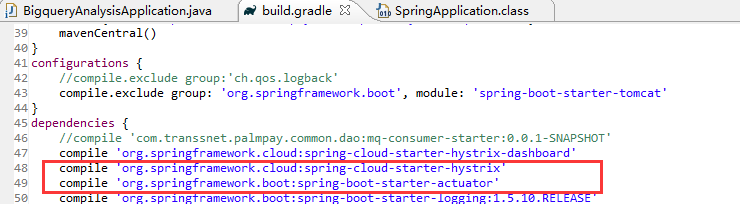
我们来改造一下我们的服务消费者工程,改造方式很简单,两个步骤就搞定,首先在pom.xml文件中添加如下依赖:
<dependency>
    <groupId>org.springframework.cloud</groupId>
    <artifactId>spring-cloud-starter-hystrix</artifactId>
</dependency>
<dependency>
    <groupId>org.springframework.boot</groupId>
    <artifactId>spring-boot-starter-actuator</artifactId>
</dependency>
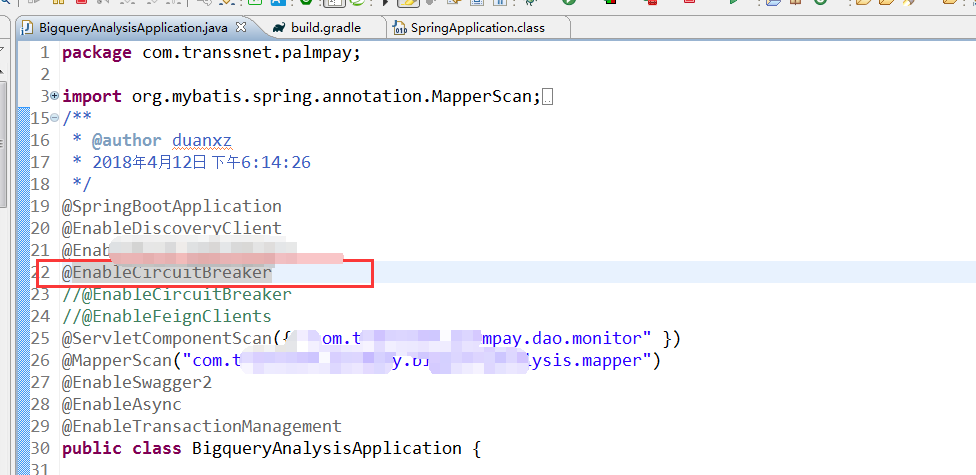
然后在服务消费者工程的入口类上添加@EnableCircuitBreaker注解,表示开启断路器功能。此时,我们再来启动我们的eureka-server、provider、和consumer工程,在consumer工程的启动日志中,我们可以看到如下信息:
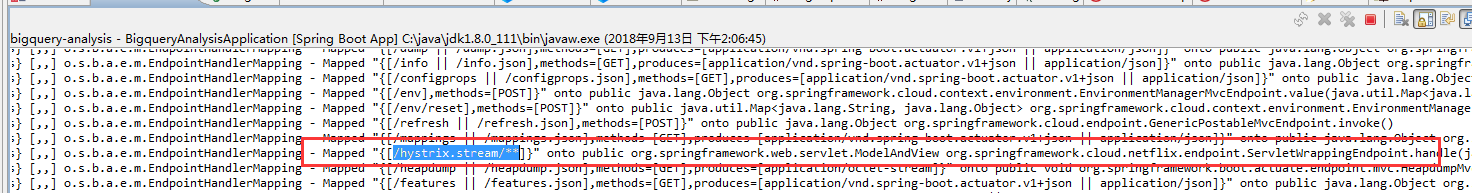
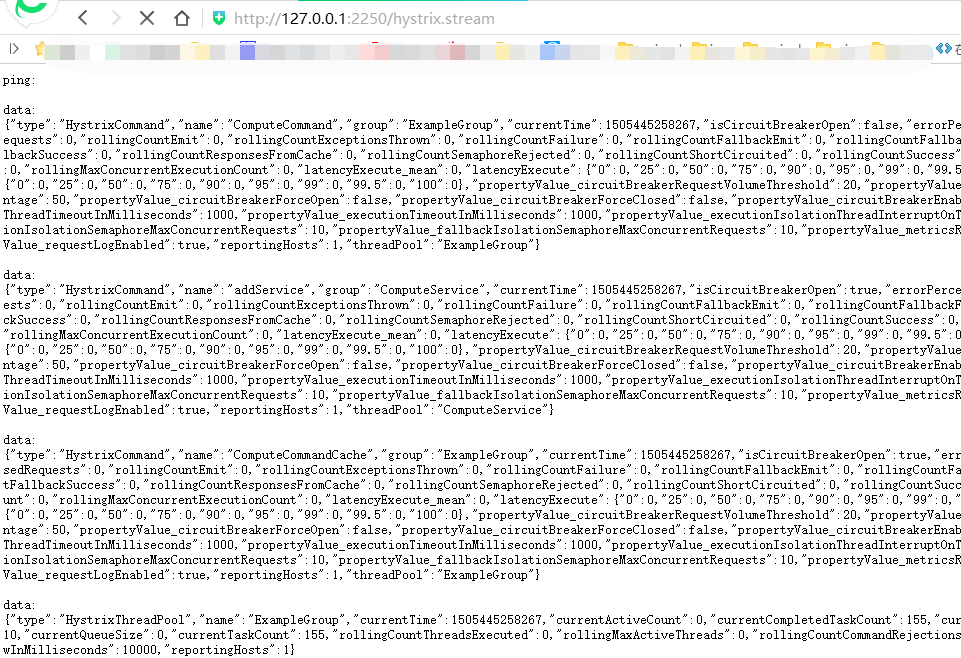
这个信息表明我们的consumer工程目前已经具备了/hystrix.stream接口,我们可以直接访问这个接口了。但是这里有一个细节需要小伙伴们注意:要访问/hystrix.stream接口,得先访问consumer工程中的任意一个其他接口,否则如果直接访问/hystrix.stream接口的话,会打印出一连串的ping: ping: ...。 OK,我先访问consumer中的任意一个其他接口,然后在访问/hystrix.stream接口,访问地址如下:http://localhost:9000/hystrix...,访问结果如下:
再启动ribbon-consumer(eureka-server,computer-service),
访问ribbon-consumer的http://127.0.0.1:2250/hystrix.stream,会打印大量的监控端点信心,如下所示:
四、Hystrix Dashboard图形展示
上面的是一段json文件,单纯的查看json数据,我们很难分析出结果,所以,我们要在Hystrix仪表盘中来查看这一段json,在hystrix仪表盘中输入监控地址,如下:
将上面http://127.0.0.1:2250/hystrix.stream(ribbon-consumer项目的url)的url填入dashboard主页里的文本框内,再点击monitor stream
结果:
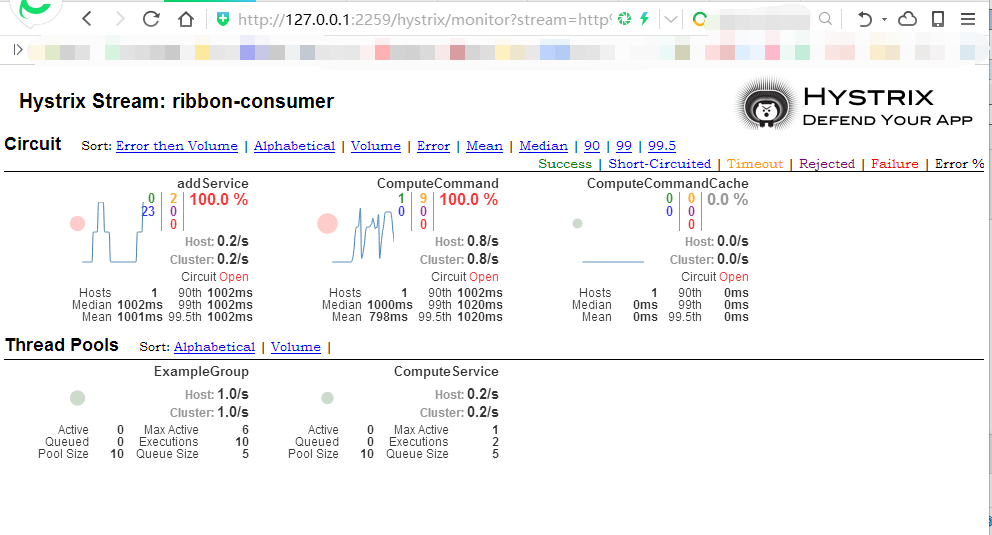
参数详解
OK,仪表盘已经显示出来了,那么仪表盘上的各项数据都是什么意思呢?我们来看下面一张图,下面有文字介绍
五、Hystrix Dashboard注意点
被监控的单机服务需要有:
       <dependency>
            <groupId>org.springframework.boot</groupId>
            <artifactId>spring-boot-starter-actuator</artifactId>
        </dependency>
        <dependency>
            <groupId>org.springframework.cloud</groupId>
            <artifactId>spring-cloud-starter-hystrix</artifactId>
        </dependency>
spring-boot-starter-actuator监控模块以开启监控相关的断点
spring-cloud-starter-hystrix并确保引入断路器的依赖
六、Hystrix Dashboard功能介绍
6.1、在主页中我们可以知道有3种监控方式:
默认的集群监控:通过URL http://turbine-hostname:port/turbine.stream开启,实现对默认集群的监控。
指定的集群监控:通过URL http://turbine-hostname:port/turbine.stream?cluster=[clusterName]开启,实现对clusterName的监控。
单体应用监控:通过URL http://hystrix-app:port/hystrix.stream开启,实现对某个具体的服务监控。
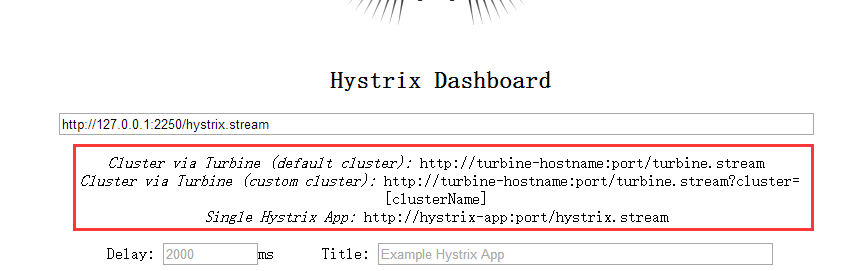
6.2、首页中还有2个参数:
Delay:采集时间间隔默认为2000毫秒。
Title:监控图上面的标题,自定义就好。
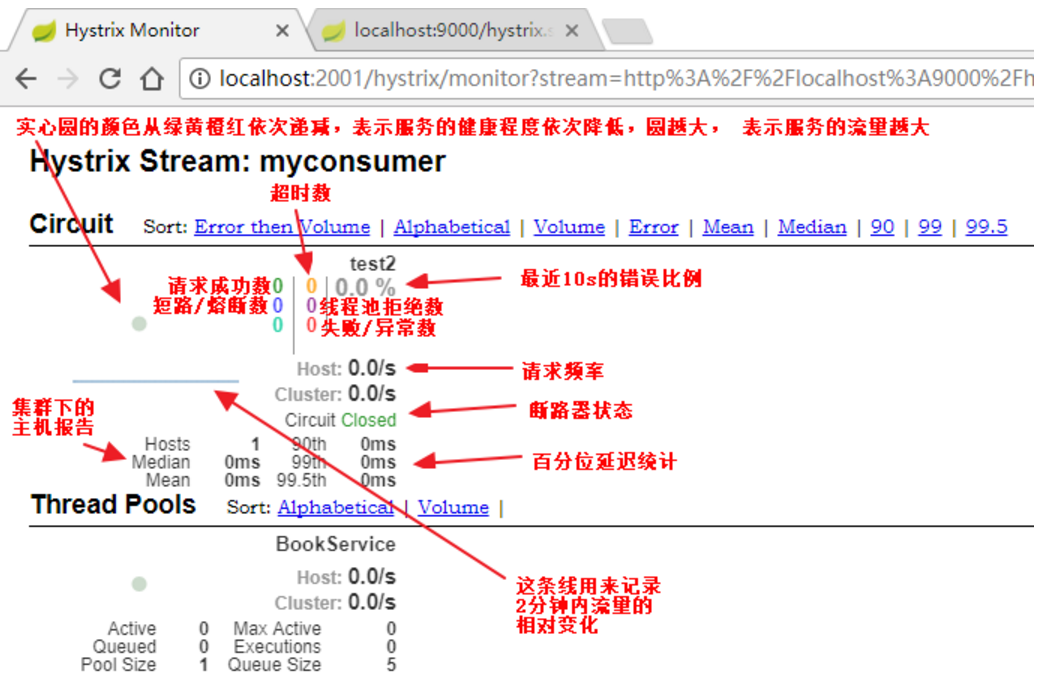
6.2、监控页面各元素的具体意义:
6.2.1、一个实心圆和一条曲线
实心圆:
实心圆通过颜色表示健康状态,健康度从绿色、黄色、橙色、红色递减。
实心圆大小,表示流量。
曲线:记录2分钟内流量的相对变化,表现出流量的升降趋势。
6.2.2、其他指标
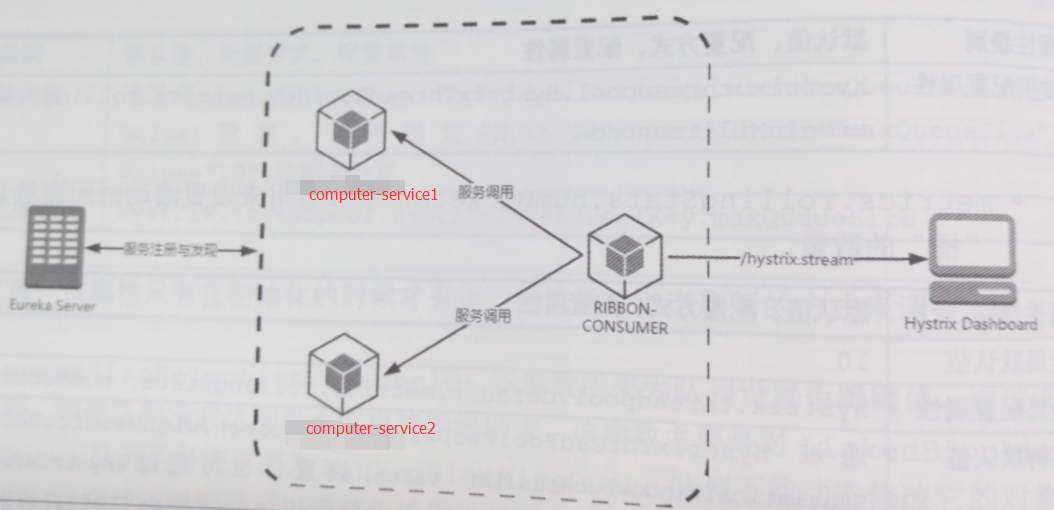
Turbine集群监控
见下一节

 浙公网安备 33010602011771号