

Redis 慢查询日志
《Redis性能问题排查解决手册》
《Redis的基本操作以及info命令》
《redis object命令》
《清理 redis 死键》
一、什么是slowlog
Slow log 是 Redis 用来记录查询执行时间的日志系统。提供的一种用于观察系统性能的功能, 这个功能的实现非常简单, 这里我们也简单地讲解一下。
Redis的慢查询日志用来记录执行时间(不包括像客户端响应(talking)、发送回复等 IO 操作,而单单是执行一个查询命令所耗费的时间)超过给定时长的命令请求,用户可以通过这个功能生产的日志来监视和优化查询速度。
另外,slowlog 保存在内存里面,读写速度非常快,因此你可以放心地使用它,不必担心因为开启 slow log 而损害 Redis 的速度。
下图是redis请求的全过程:
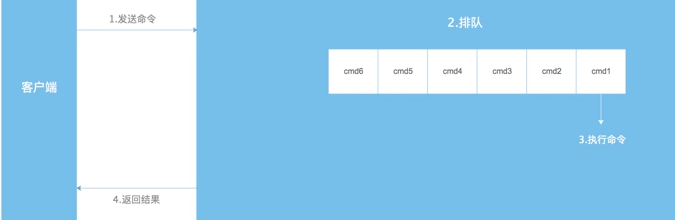
慢查询发生在第3个阶段。
二、设置slowlog
服务器配置有两个slowlog的行为相关的选项:可以通过改写 redis.conf 文件或者用 CONFIG GET 和 CONFIG SET 命令对它们动态地进行修改。
- slowlog-log-slower-than:规定执行时间超过多少微秒(1 秒=1000000 微秒)的命令会被记录到日志上。默认10 000微妙
- slowlog-max-len:执行服务器上可以保存多少条慢查询日志。slow log 本身是一个 FIFO(先进先出)队列,当队列大小超过 slowlog-max-len 时,最旧的一条日志将被删除,而最新的一条日志加入到 slow log ,以此类推。默认值128
慢日志配置示例:
CONFIG SET slowlog-log-slower-than 100 #比如执行以下命令将让 slow log 记录所有查询时间大于等于 100 微秒的查询
slowlog-log-slower-than=0 #记录所有命令
slowlog-log-slower-than<0 #不记录任何命令
示例2:
CONFIG SET slowlog-max-len 1000 #以下命令让 slow log 最多保存 1000 条日志
使用 CONFIG GET 命令可以查询两个选项的当前值:
127.0.0.1:6379> config get slowlog-log-slower-than
1) "slowlog-log-slower-than"
2) "10000"
127.0.0.1:6379> config get slowlog-max-len
1) "slowlog-max-len"
2) "128"
2.1 slowlog的设置有两种方式:
2.1.1 redis.conf设置
在redis.conf中有关于slowlog的设置:
slowlog-log-slower-than 10000
slowlog-max-len 128
其中slowlog-log-slower-than表示slowlog的划定界限,只有query执行时间大于slowlog-log-slower-than的才会定义成慢查询,才会被slowlog进行记录。slowlog-log-slower-than设置的单位是微妙,默认是10000微妙,也就是10ms
slowlog-max-len表示慢查询最大的条数,当slowlog超过设定的最大值后,会将最早的slowlog删除,是个FIFO队列
2.1.2 使用config方式动态设置slowlog
如下,可以通过config方式动态设置slowlog
    - 查看当前slowlog-log-slower-than设置
    127.0.0.1:6379> CONFIG GET slowlog-log-slower-than
    1) "slowlog-log-slower-than"
    2) "10000"
    - 设置slowlog-log-slower-than为100ms
    127.0.0.1:6379> CONFIG SET slowlog-log-slower-than 100000
    OK
    - 设置slowlog-max-len为1000
    127.0.0.1:6379> CONFIG SET slowlog-max-len 1000
    OK
三、slowlog相关数据结构
本章先介绍和慢查询功能相关的数据结构和变量, 然后介绍 Redis 是如何记录命令的执行时间, 以及如何为执行超过限制事件的命令记录慢查询日志的。
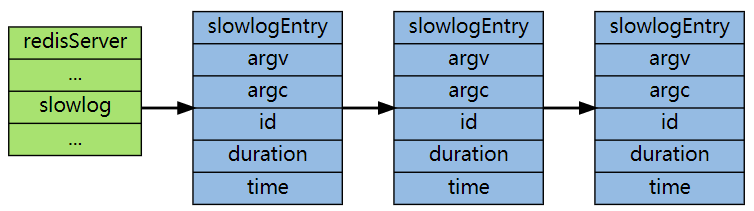
每条慢查询日志都以一个 slowlog.h/slowlogEntry 结构定义:
typedef struct slowlogEntry {

    // 命令参数
    robj **argv;

    // 命令参数数量
    int argc;

    // 唯一标识符
    long long id;       /* Unique entry identifier. */

    // 执行命令消耗的时间,以纳秒(1 / 1,000,000,000 秒)为单位
    long long duration; /* Time spent by the query, in nanoseconds. */

    // 命令执行时的时间
    time_t time;        /* Unix time at which the query was executed. */

} slowlogEntry;
记录服务器状态的 redis.h/redisServer 结构里保存了几个和慢查询有关的属性:
struct redisServer {

    // ... other fields

    // 保存慢查询日志的链表
    list *slowlog;                  /* SLOWLOG list of commands */

    // 慢查询日志的当前 id 值
    long long slowlog_entry_id;     /* SLOWLOG current entry ID */

    // 慢查询时间限制
    long long slowlog_log_slower_than; /* SLOWLOG time limit (to get logged) */

    // 慢查询日志的最大条目数量
    unsigned long slowlog_max_len;     /* SLOWLOG max number of items logged */

    // ... other fields
};
slowlog 属性是一个链表, 链表里的每个节点保存了一个慢查询日志结构, 所有日志按添加时间从新到旧排序,新的日志在链表的左端,旧的日志在链表的右端。
slowlog_entry_id 在创建每条新的慢查询日志时增一,用于产生慢查询日志的 ID (这个 ID 在执行 SLOWLOG RESET 之后会被重置)。
slowlog_log_slower_than 是用户指定的命令执行时间上限,执行时间大于等于这个值的命令会被慢查询日志记录。
slowlog_max_len 慢查询日志的最大数量,当日志数量等于这个值时,添加一条新日志会造成最旧的一条日志被删除。
下图展示了一个 slowlog 属性的实例:
四、慢查询记录的保存
1.2 慢查询日志的记录
在每次执行命令之前, Redis 都会用一个参数记录命令执行前的时间, 在命令执行完之后, 再计算一次当前时间, 然后将两个时间值相减, 得出执行命令所耗费的时间值 duration , 并将 duration 传给 slowlogPushEntryIfNeed 函数。
如果 duration 超过服务器设置的执行时间上限 server.slowlog_log_slower_than 的话, slowlogPushEntryIfNeed 就会创建一条新的慢查询日志, 并将它加入到慢查询日志链表里。
可以用一段伪代码来表示这个过程:
def execute_redis_command_with_slowlog():

    # 命令执行前的时间
    start = ustime()

    # 执行命令
    execute_command(argv, argc)

    # 计算命令执行所耗费的时间
    duration = ustime() - start

    if slowlog_is_enabled:
        slowlogPushEntryIfNeed(argv, argc, duration)


def slowlogPushEntryIfNeed(argv, argc, duration)

    # 如果执行命令耗费的时间超过服务器设置命令执行时间上限
    # 那么创建一条新的 slowlog
    if duration > server.slowlog_log_slower_than:

        # 创建新 slowlog
        log = new slowlogEntry()

        # 设置各个域
        log.argv = argv
        log.argc = argc
        log.duration = duration
        log.id = server.slowlog_entry_id
        log.time = now()

        # 将新 slowlog 追加到日志链表末尾
        server.slowlog.append(log)

        # 更新服务器 slowlog
        server.slowlog_entry_id += 1
二、慢查询日志的操作
2.1 slowlog设置
slowlog的设置有两种方式:
2.1.1 redis.conf设置
在redis.conf中有关于slowlog的设置:
slowlog-log-slower-than 10000
slowlog-max-len 128
其中slowlog-log-slower-than表示slowlog的划定界限,只有query执行时间大于slowlog-log-slower-than的才会定义成慢查询,才会被slowlog进行记录。slowlog-log-slower-than设置的单位是微妙,默认是10000微妙,也就是10ms
slowlog-max-len表示慢查询最大的条数,当slowlog超过设定的最大值后,会将最早的slowlog删除,是个FIFO队列
2.1.2 使用config方式动态设置slowlog
如下,可以通过config方式动态设置slowlog
    - 查看当前slowlog-log-slower-than设置
    127.0.0.1:6379> CONFIG GET slowlog-log-slower-than
    1) "slowlog-log-slower-than"
    2) "10000"
    - 设置slowlog-log-slower-than为100ms
    127.0.0.1:6379> CONFIG SET slowlog-log-slower-than 100000
    OK
    - 设置slowlog-max-len为1000
    127.0.0.1:6379> CONFIG SET slowlog-max-len 1000
    OK
2.2 slowlog查看
- slowlog len:查看当前日志的数量,请注意这个值和 slower-max-len 的区别,它们一个是当前日志的数量,一个是允许记录的最大日志的数量
- slowlog get [n] : 获取慢查询队列,使用 SLOWLOG GET 或者 SLOWLOG GET number 命令,前者打印所有 slow log ,最大长度取决于 slowlog-max-len 选项的值,而 SLOWLOG GET number 则只打印指定数量的日志。最新的日志会最先被打印 #为测试需要,将 slowlog-log-slower-than 设成了 10 微秒
注意事项
slowlog-max-len:线上建议调大慢查询列表,记录慢查询时Redis会对长命令做阶段操作,并不会占用大量内存.增大慢查询列表可以减缓慢查询被剔除的可能,例如线上可设置为1000以上。
slowlog-log-slower-than:默认值超过10毫秒判定为慢查询,需要根据Redis并发量调整该值.由于Redis采用单线程相应命令,对于高流量的场景,如果命令执行时间超过1毫秒以上,那么Redis最多可支撑OPS不到1000因此对于高OPS场景下的Redis建议设置为1毫秒。
慢查询只记录命令的执行时间,并不包括命令排队和网络传输时间.因此客户端执行命令的时间会大于命令的实际执行时间.因为命令执行排队机制,慢查询会导致其他命令级联阻塞,因此客户端出现请求超时时,需要检查该时间点是否有对应的慢查询,从而分析是否为慢查询导致的命令级联阻塞。
由于慢查询日志是一个先进先出的队列,也就是说如果慢查询比较多的情况下,可能会丢失部分慢查询命令,为了防止这种情况发生,可以定期执行slowlog get命令将慢查询日志持久化到其他存储中(例如:MySQL、ElasticSearch等),然后可以通过可视化工具进行查询。
示例:
2.2.1 查看slowlog总条数
示例:
10.200.140.20:36379> slowlog len
(integer) 18
10.200.140.20:36379>
2.2.2 查看slowlog
127.0.0.1:6379> SLOWLOG GET
1) 1) (integer) 25
   2) (integer) 1440057769
   3) (integer) 6
   4) 1) "SLOWLOG"
      2) "LEN"
2) 1) (integer) 24
   2) (integer) 1440057756
   3) (integer) 36
   4) 1) "CONFIG"
      2) "GET"
      3) "slowlog-log-slower-than"
3) 1) (integer) 23
   2) (integer) 1440057752
   3) (integer) 11
   4) 1) "CONFIG"
      2) "SET"
      3) "slowlog-log-slower-than"
      4) "1"
4) 1) (integer) 22
   2) (integer) 1440057493
   3) (integer) 27
   4) 1) "CONFIG"
      2) "GET"
      3) "slowlog-log-slower-than"
5) 1) (integer) 21
   2) (integer) 1440057133
   3) (integer) 7
   4) 1) "monitor"
如果要获取指定的条数可以使用SLOWLOG GET N命令127.0.0.1:6379> SLOWLOG GET 1 1) 1) (integer) 26 // slowlog唯一编号id 2) (integer) 1440057815 // 查询的时间戳 3) (integer) 47 // 查询的耗时(微妙),如表示本条命令查询耗时47微秒 4) 1) "SLOWLOG" // 查询命令,完整命令为 SLOWLOG GET,slowlog最多保存前面的31个key和128字符 2) "GET"
2.3 slowlog清空
命令:slowlog reset
10.200.140.20:36379> slowlog reset
OK
10.200.140.20:36379> slowlog get 1
(empty list or set)
10.200.140.20:36379>
2.4 获取slowlog数量
命令:slowlog len
10.200.140.20:36379> slowlog len
(integer) 18
- Redis 用一个链表以 FIFO 的顺序保存着所有慢查询日志。
- 每条慢查询日志以一个慢查询节点表示,节点中记录着执行超时的命令、命令的参数、命令执行时的时间,以及执行命令所消耗的时间等信息。
转自:
https://redisbook.readthedocs.io/en/latest/feature/slowlog.html
https://blog.csdn.net/qq_36263268/article/details/111504650

 浙公网安备 33010602011771号