

Telegraf安装与介绍
Telegraf 是什么?
Telegraf 是一个用 Go 编写的代理程序,是收集和报告指标和数据的代理。可收集系统和服务的统计数据,并写入到 InfluxDB 数据库。Telegraf 具有内存占用小的特点,通过插件系统开发人员可轻松添加支持其他服务的扩展。
Telegraf是TICK Stack的一部分,是一个插件驱动的服务器代理,用于收集和报告指标。
Telegraf 集成了直接从其运行的容器和系统中提取各种指标,事件和日志,从第三方API提取指标,甚至通过StatsD和Kafka消费者服务监听指标。
它还具有输出插件,可将指标发送到各种其他数据存储,服务和消息队列,包括InfluxDB,Graphite,OpenTSDB,Datadog,Librato,Kafka,MQTT,NSQ等等。
Telegraf作为数据采集模块,需要安装至被监控的目标主机上。Telegraf设计目标是较小的内存使用,通过插件来构建各种服务和第三方组件的metrics收集
Telegraf由4个独立的插件驱动:
- Input Plugins
输入插件,收集系统、服务、第三方组件的数据。 - Processor Plugins
处理插件,转换、处理、过滤数据。 - Aggregator Plugins
聚合插件,数据特征聚合。 - Output Plugins
输出插件,写metrics数据。
Influxdb 是一个开源的(集群版收费)分布式时序、时间和指标数据库,使用 Go 语言编写,无需外部依赖。Influxdb 有如下三大特性:
- 时序性(Time Series):与时间相关的函数的灵活使用(诸如最大、最小、求和等);
- 度量(Metrics):对实时大量数据进行计算;
- 事件(Event):支持任意的事件数据,换句话说,任意事件的数据我们都可以做操作。
为什么要用?
在平台监控系统中,可以使用 Telegraf 采集多种组件的运行信息,而不需要自己手写脚本定时采集,大大降低数据获取的难度;且 Telegraf 配置极为简单,只要有基本的 Linux 基础即可快速上手。Telegraf 按照时间序列采集数据,数据结构中包含时序信息,时序数据库就是为此类数据设计而来,使用 Influxdb 可以针采集得到的数据完成各种分析计算操作。
怎么用?
这里不介绍过多原理性的东西,尽可能快速地在现有系统上安装部署 Telegraf 和 Influxdb,并使用 Telegraf 采集部分数据写入到 Influxdb 中。使用 wget 方式下载可能会较为缓慢,建议使用迅雷等下载工具下载后再分发至服务器上。
1.安装 Telegraf
[root@node1 ~]# wget http://get.influxdb.org/telegraf/telegraf-0.11.1-1.x86_64.rpm
[root@node1 ~]# rpm -ivh telegraf-0.11.1-1.x86_64.rpm
[root@node1 ~]# systemctl start telegraf
2.安装 Influxdb
[root@node1 ~]# wget http://dl.influxdata.com/influxdb/releases/influxdb-1.0.2.x86_64.rpm
[root@node1 ~]# rpm -ivh influxdb-1.0.2.x86_64.rpm
[root@node1 ~]# systemctl start influxd
3.创建 Influxdb 用户和数据库
[root@node1 ~]# influx
   Visit https://enterprise.influxdata.com to register for updates, InfluxDB server management, and monitoring.
   Connected to http://localhost:8086 version 1.0.2
   InfluxDB shell version: 1.0.2
   > create user "telegraf" with password 'password'
   > show users;
   user     admin
   telegraf false
   > create database telegraf
   > show databases
   name: databases
   ---------------
   name
   _internal
   telegraf
4.配置Telegraf
[root@node1 ~]# vim /etc/telegraf/telegraf.conf
   ## 修改内容如下:
   [[outputs.influxdb]]
     urls = ["http://localhost:8086"] # required
     database = "telegraf" # required
     retention_policy = ""
     precision = "s"
     timeout = "5s"
     username = "telegraf"
     password = "password"
[root@node1 ~]# systemctl restart telegraf
5.查看数据
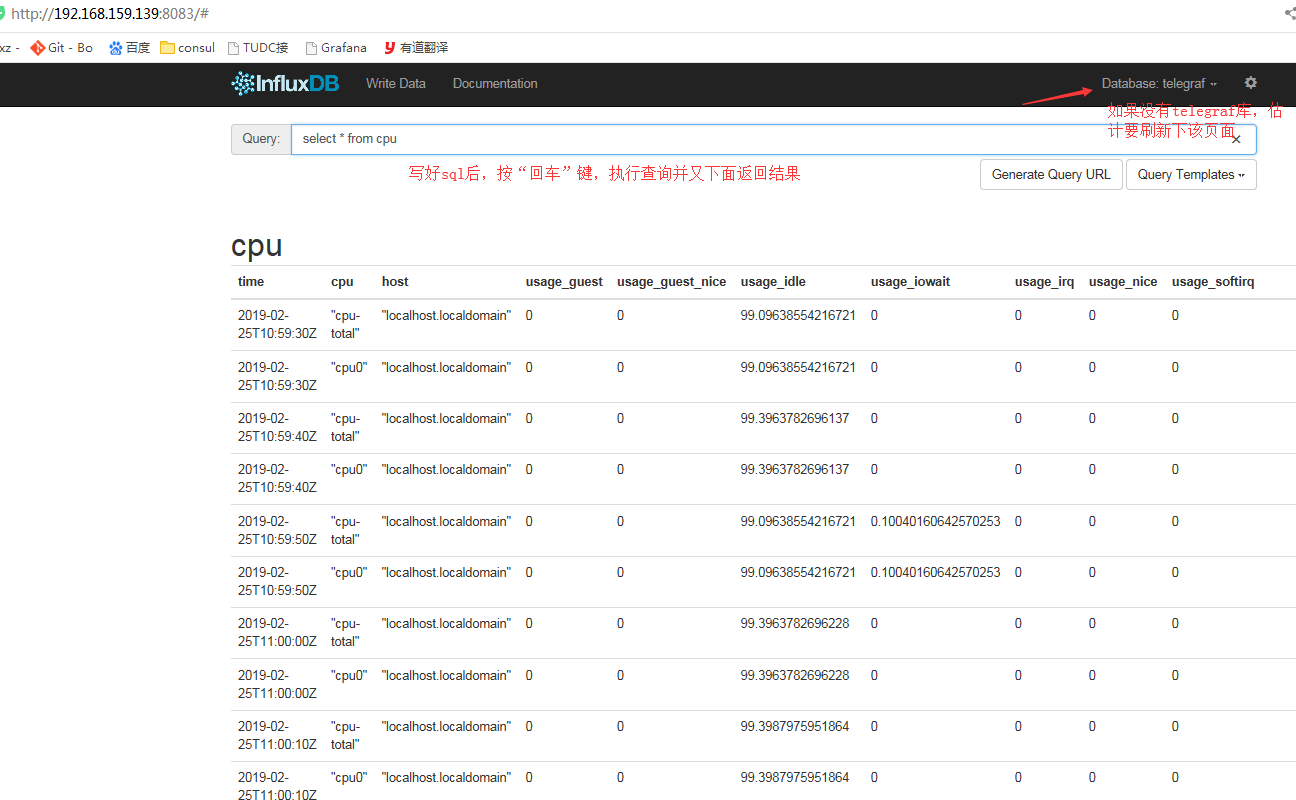
打开 Influxdb 查询界面:http://node1:8083 , 输入查询语句seclect * from cpu可查询到 CPU 相关信息。
生成配置文件
可执行文件在 usr/bin/telegraf,配置文件在/etc/telegraf目录下,也可直接配置生成
查看帮助
telegraf --help
生成配置文件
telegraf config > telegraf-mysql.conf # 比如在当前目录下生成mysql相关的配置文件
建议生成的配置放置在 /etc/telegraf/telegraf.d目录下
生成指定输入和输出插件的配置文件
telegraf --input-filter <pluginname>[:<pluginname>] --output-filter <outputname>[:<outputname>] config > telegraf.conf
例如,生成带 cpu、memroy、disk、diskio、net 和 influxdb 插件的配置文件 telegraf.conf,指定输出到 influxdb 和 opentsdb
telegraf --input-filter cpu:mem:disk:diskio:net --output-filter influxdb:opentsdb config > telegraf.conf
也可使用默认的配置文件
telegraf --input-filter cpu:mem:http_listener --output-filter influxdb config
telegraf 支持读取多个配置文件,可将多个配置文件放置在 /etc/telegraf/telegraf.d 目录下
测试配置是否成功
示例
# 测试 /etc/telegraf/telegraf.conf 配置文件中输入 cpu 配置是否正确
telegraf -config /etc/telegraf/telegraf.conf -input-filter cpu -test
# 测试 /etc/telegraf/telegraf.conf 输出 influxdb 配置是否正确
telegraf -config /etc/telegraf/telegraf.conf -output-filter influxdb -test
# 测试 /etc/telegraf/telegraf.d/mysql.conf 输入 cpu 和 输出 influxdb 配置是否正确
telegraf -config /etc/telegraf/telegraf.d/mysql.conf -input-filter cpu -output-filter influxdb -test
配置正确的话,会输出当前时间戳的配置指标和值;
配置错误的话,会显示错误信息;
其他测试配置文件方法可以类比以上示例
查看 telegraf 的日志
telegraf 日志目录 /var/log/telegraf/telegraf.log
配置文件保存修改后,记得要重启 telegraf
# 重启 telegraf 服务,使配置文件生效
service telegraf restart
# Linux 不同系统服务的启动方式不同
systemctl start telegraf
Note: Telegraf will start automatically using the default configuration when installed from a deb package.
/etc/telegraf/telegraf.d is the default directory of configuration files.
配置多个配置文件示例
步骤:
生成配置文件
配置输入输出插件
修改配置文件中输入输出插件具体内容
在 /etc/telegraf/telegraf.d 生成其他插件的配置文件(如需要配置多个配置文件)
测试配置文件是否配置正确
重启 telegraf
# 例子:配置 os 和 redis 采集的配置文件
# 配置 os
cd /etc/telegraf
# 1.生成配置文件(将配置文件权限更改为777,以免出现报错)
telegraf config > telegraf.conf
chmod 777 telegraf.conf
# 2.在指定配置文件中添加输入输出插件相关的配置
telegraf --input-filter cpu:mem:disk:diskio:net --output-filter influxdb:opentsdb config > telegraf.conf
# 3.修改配置文件内容
vim telegraf.conf
# 4.<配置多个配置文件> 如,配置 redis
cd /etc/telegraf/telegraf.d
telegraf config > redis.conf
chmod 777 telegraf.conf
telegraf --input-filter redis --output-filter opentsdb:influxdb config > redis.conf
vim redis.conf
# 5.测试配置文件是否配置正确
telegraf -config redis.conf --input-filter redis --output-filter opentsdb:influxdb -test
# 6.重启 telegraf
service telegraf restart
其中以 redis.conf 配置内容为例,说明需要配置的内容
###############################################################################
# INPUT PLUGINS #
###############################################################################
# Read metrics from one or many redis servers
[[inputs.redis]]
## specify servers via a url matching:
## [protocol://][:password]@address[:port]
## e.g.
## tcp://localhost:6379
## tcp://:password@192.168.99.100
## unix:///var/run/redis.sock
##
## If no servers are specified, then localhost is used as the host.
## If no port is specified, 6379 is used
#servers = ["tcp://localhost:6379"]
# 配置 Redis 环境的地址
servers = ["tcp://10.132.49.128:6379"]
## specify server password
# password = "s#cr@t%"
## Optional TLS Config
# tls_ca = "/etc/telegraf/ca.pem"
# tls_cert = "/etc/telegraf/cert.pem"
# tls_key = "/etc/telegraf/key.pem"
## Use TLS but skip chain & host verification
# insecure_skip_verify = true
###############################################################################
# OUTPUT PLUGINS #
###############################################################################
# Configuration for OpenTSDB server to send metrics to
[[outputs.opentsdb]]
## prefix for metrics keys
# opentsdb 输出的 metric 的前缀
prefix = "telegraf.redis."
## DNS name of the OpenTSDB server
## Using "opentsdb.example.com" or "tcp://opentsdb.example.com" will use the
## telnet API. "http://opentsdb.example.com" will use the Http API.
host = "10.128.2.97"
## Port of the OpenTSDB server
port = 44242
## Number of data points to send to OpenTSDB in Http requests.
## Not used with telnet API.
http_batch_size = 50
## URI Path for Http requests to OpenTSDB.
## Used in cases where OpenTSDB is located behind a reverse proxy.
http_path = "/api/put"
## Debug true - Prints OpenTSDB communication
debug = false
# Configuration for sending metrics to InfluxDB
[[outputs.influxdb]]
## The full HTTP or UDP URL for your InfluxDB instance.
##
## Multiple URLs can be specified for a single cluster, only ONE of the
## urls will be written to each interval.
# urls = ["unix:///var/run/influxdb.sock"]
# urls = ["udp://127.0.0.1:8089"]
urls = ["http://127.0.0.1:8086"]
## The target database for metrics; will be created as needed.
database = "telegraf"
## If true, no CREATE DATABASE queries will be sent. Set to true when using
## Telegraf with a user without permissions to create databases or when the
## database already exists.
# skip_database_creation = false
## Name of existing retention policy to write to. Empty string writes to
## the default retention policy. Only takes effect when using HTTP.
# retention_policy = ""
## Write consistency (clusters only), can be: "any", "one", "quorum", "all".
## Only takes effect when using HTTP.
# write_consistency = "any"
## HTTP Basic Auth
username = "admin"
password = "admin"
## HTTP User-Agent
# user_agent = "telegraf"
## UDP payload size is the maximum packet size to send.
# udp_payload = 512
## Optional TLS Config for use on HTTP connections.
# tls_ca = "/etc/telegraf/ca.pem"
# tls_cert = "/etc/telegraf/cert.pem"
# tls_key = "/etc/telegraf/key.pem"
## Use TLS but skip chain & host verification
# insecure_skip_verify = false
## HTTP Proxy override, if unset values the standard proxy environment
## variables are consulted to determine which proxy, if any, should be used.
# http_proxy = "http://corporate.proxy:3128"
## Additional HTTP headers
# http_headers = {"X-Special-Header" = "Special-Value"}
具体其他配置含义见附录说明
附录说明
每一个input插件配置文件内容不同,具体插件配置项可参看 Telegraf plugins
mysql 输入插件配置内容
###############################################################################
# INPUT PLUGINS #
###############################################################################
# Read metrics from one or many mysql servers
[[inputs.mysql]]
## specify servers via a url matching:
## [username[:password]@][protocol[(address)]]/[?tls=[true|false|skip-verify|custom]]
## see https://github.com/go-sql-driver/mysql#dsn-data-source-name
## e.g.
## servers = ["user:passwd@tcp(127.0.0.1:3306)/?tls=false"]
## servers = ["user@tcp(127.0.0.1:3306)/?tls=false"]
#
## If no servers are specified, then localhost is used as the host.
servers = ["root@tcp(127.0.0.1:3306)/"]
## Selects the metric output format.
##
## This option exists to maintain backwards compatibility, if you have
## existing metrics do not set or change this value until you are ready to
## migrate to the new format.
##
## If you do not have existing metrics from this plugin set to the latest
## version.
##
## Telegraf >=1.6: metric_version = 2
## <1.6: metric_version = 1 (or unset)
metric_version = 2
## the limits for metrics form perf_events_statements
perf_events_statements_digest_text_limit = 120
perf_events_statements_limit = 250
perf_events_statements_time_limit = 86400
#
## if the list is empty, then metrics are gathered from all databasee tables
table_schema_databases = []
#
## gather metrics from INFORMATION_SCHEMA.TABLES for databases provided above list
gather_table_schema = false
#
## gather thread state counts from INFORMATION_SCHEMA.PROCESSLIST
gather_process_list = true
#
## gather user statistics from INFORMATION_SCHEMA.USER_STATISTICS
gather_user_statistics = true
#
## gather auto_increment columns and max values from information schema
gather_info_schema_auto_inc = true
#
## gather metrics from INFORMATION_SCHEMA.INNODB_METRICS
gather_innodb_metrics = true
#
## gather metrics from SHOW SLAVE STATUS command output
gather_slave_status = true
#
## gather metrics from SHOW BINARY LOGS command output
gather_binary_logs = false
#
## gather metrics from PERFORMANCE_SCHEMA.TABLE_IO_WAITS_SUMMARY_BY_TABLE
gather_table_io_waits = false
#
## gather metrics from PERFORMANCE_SCHEMA.TABLE_LOCK_WAITS
gather_table_lock_waits = false
#
## gather metrics from PERFORMANCE_SCHEMA.TABLE_IO_WAITS_SUMMARY_BY_INDEX_USAGE
gather_index_io_waits = false
#
## gather metrics from PERFORMANCE_SCHEMA.EVENT_WAITS
gather_event_waits = false
#
## gather metrics from PERFORMANCE_SCHEMA.FILE_SUMMARY_BY_EVENT_NAME
gather_file_events_stats = false
#
## gather metrics from PERFORMANCE_SCHEMA.EVENTS_STATEMENTS_SUMMARY_BY_DIGEST
gather_perf_events_statements = false
#
## Some queries we may want to run less often (such as SHOW GLOBAL VARIABLES)
interval_slow = "30m"
## Optional TLS Config (will be used if tls=custom parameter specified in server uri)
# tls_ca = "/etc/telegraf/ca.pem"
# tls_cert = "/etc/telegraf/cert.pem"
# tls_key = "/etc/telegraf/key.pem"
## Use TLS but skip chain & host verification
# insecure_skip_verify = false
按照自己实际需要对照说明进行修改
redis 输入插件
###############################################################################
# INPUT PLUGINS #
###############################################################################
# Monitor process cpu and memory usage
[[inputs.procstat]]
## PID file to monitor process
#pid_file = "/var/run/nginx.pid"
# 配置需要监控的进程的 PID 文件目录
pid_file = "/var/run/grafana-server.pid"
## executable name (ie, pgrep <exe>)
# exe = "nginx"
## pattern as argument for pgrep (ie, pgrep -f <pattern>)
# pattern = "nginx"
## user as argument for pgrep (ie, pgrep -u <user>)
# user = "nginx"
## Systemd unit name
# systemd_unit = "nginx.service"
## CGroup name or path
# cgroup = "systemd/system.slice/nginx.service"
## override for process_name
## This is optional; default is sourced from /proc/<pid>/status
# process_name = "bar"
## Field name prefix
# prefix = ""
## Add PID as a tag instead of a field; useful to differentiate between
## processes whose tags are otherwise the same. Can create a large number
## of series, use judiciously.
# pid_tag = false
## Method to use when finding process IDs. Can be one of 'pgrep', or
## 'native'. The pgrep finder calls the pgrep executable in the PATH while
## the native finder performs the search directly in a manor dependent on the
## platform. Default is 'pgrep'
# pid_finder = "pgrep"
Prometheus 输入插件
###############################################################################
# INPUT PLUGINS #
###############################################################################
# Read metrics from one or many prometheus clients
[[inputs.prometheus]]
## An array of urls to scrape metrics from.
#urls = ["http://localhost:9100/metrics"]
# 配置 prometheus 的接口地址
urls = ["http://10.132.49.114:9104/metrics"]
## An array of Kubernetes services to scrape metrics from.
# kubernetes_services = ["http://my-service-dns.my-namespace:9100/metrics"]
## Use bearer token for authorization
# bearer_token = /path/to/bearer/token
## Specify timeout duration for slower prometheus clients (default is 3s)
# response_timeout = "3s"
## Optional TLS Config
# tls_ca = /path/to/cafile
# tls_cert = /path/to/certfile
# tls_key = /path/to/keyfile
## Use TLS but skip chain & host verification
# insecure_skip_verify = false
其他配置文件说明
Agent 配置
Telegraf有一些可以在配置[agent]部分下配置的选项。
interval:所有输入的默认数据收集间隔
round_interval:将收集间隔舍入为“interval”例如,如果interval =“10s”则始终收集于:00,:10,:20等。
metric_batch_size:Telegraf将指标发送到大多数metric_batch_size指标的批量输出。
metric_buffer_limit:Telegraf将缓存metric_buffer_limit每个输出的指标,并在成功写入时刷新此缓冲区。这应该是倍数,metric_batch_size不能少于2倍metric_batch_size。
collection_jitter:集合抖动用于随机抖动集合。每个插件在收集之前将在抖动内随机休眠一段时间。这可以用来避免许多插件同时查询sysfs之类的东西,这会对系统产生可测量的影响。
flush_interval:所有输出的默认数据刷新间隔。您不应将此设置为以下间隔。最大值flush_interval为flush_interval+flush_jitter
flush_jitter:将刷新间隔抖动一个随机量。这主要是为了避免运行大量Telegraf实例的用户出现大量写入峰值。例如,flush_jitter5s和flush_interval10s之一意味着每10-15秒就会发生一次冲洗。
precision:默认情况下,precision将设置为与收集时间间隔相同的时间戳顺序,最大值为1s。精度不会用于服务输入,例如logparser和statsd。有效值为 ns,us(或µs)ms,和s。
logfile:指定日志文件名。空字符串表示要登录stderr。
debug:在调试模式下运行Telegraf。
quiet:以安静模式运行Telegraf(仅限错误消息)。
hostname:覆盖默认主机名,如果为空使用os.Hostname()。
omit_hostname:如果为true,则不host在Telegraf代理中设置标记。
Input 配置
以下配置参数可用于所有输入:
interval:收集此指标的频率。普通插件使用单个全局间隔,但是如果一个特定输入应该运行得更少或更频繁,则可以在此处进行配置。
name_override:覆盖度量的基本名称。(默认为输入的名称)。
name_prefix:指定附加到度量名称的前缀。
name_suffix:指定附加到度量名称的后缀。
tags:要应用于特定输入测量的标签映射。
Aggregator 配置
以下配置参数可用于所有聚合器:
period:刷新和清除每个聚合器的时间段。聚合器将忽略在此时间段之外使用时间戳发送的所有度量标准。
delay:刷新每个聚合器之前的延迟。这是为了控制聚合器在从输入插件接收度量标准之前等待多长时间,如果聚合器正在刷新并且输入在相同的时间间隔内收集。
drop_original:如果为true,聚合器将丢弃原始度量标准,并且不会将其发送到输出插件。
name_override:覆盖度量的基本名称。(默认为输入的名称)。
name_prefix:指定附加到度量名称的前缀。
name_suffix:指定附加到度量名称的后缀。
tags:要应用于特定输入测量的标签映射。
Processor 配置
以下配置参数可用于所有处理器:
order:这是执行处理器的顺序。如果未指定,则处理器执行顺序将是随机的。
Measurement filtering (测量过滤)
可以根据输入,输出,处理器或聚合器配置过滤器,请参阅下面的示例。
namepass:一个glob模式字符串数组。仅发出测量名称与此列表中的模式匹配的点。
命名工作:逆转namepass。如果找到匹配,则丢弃该点。这是在通过namepass测试后的点上测试的。
fieldpass:一个glob模式字符串数组。仅发出其字段键与此列表中的模式匹配的字段。不适用于输出。
fielddrop:逆的fieldpass。具有匹配其中一个模式的字段键的字段将从该点中丢弃。不适用于输出。
tagpass:将标记键映射到glob模式字符串数组的表。仅发出表中包含标记键的点和与其模式之一匹配的标记值。
tagdrop:逆的tagpass。如果找到匹配,则丢弃该点。这是在通过tagpass测试后的点上测试的。
taginclude:一个glob模式字符串数组。仅发出具有与其中一个模式匹配的标签键的标签。相反tagpass,它将根据其标记传递整个点,taginclude从该点移除所有不匹配的标记。此滤波器可用于输入和输出,但 建议在输入上使用,因为在摄取点过滤掉标签更有效。
tagexclude:倒数taginclude。具有与其中一个模式匹配的标记键的标记将从该点被丢弃。
注意: 由于解析TOML的方式,tagpass并且tagdrop必须在插件定义的末尾定义参数,否则后续插件配置选项将被解释为tagpass / tagdrop表的一部分。

 浙公网安备 33010602011771号