

sklearn通用学习模式-【老鱼学sklearn】
选择学习方法
机器学习中有很多方法可以使用,但具体我们选择哪个机器学习的方法呢?
sklean向我们提供了一个选择哪个机器学习的决策图:
http://scikit-learn.org/stable/_static/ml_map.png
通用学习模式
sklearn提供了一个通用的机器学习模式,这样便于我们使用者以统一的方式来使用。
本处以分类器作为例子来进行讲述。
分类算法在机器学习中应用非常广泛,我甚至可以把某些回归问题看成一定颗粒度上的分类问题。
本处以非常经典的判断花卉的分类作为例子:
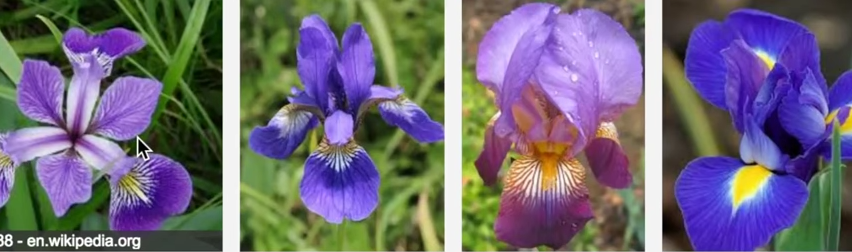
这是几种不同的花,区分这些花是根据如下这几个属性来进行判断的:
花瓣的长度
花瓣的宽度
茎的长度
茎的度度
也就是提供某种花的这些特征后,系统自动会判断出这是哪种花。
加载数据集
在sklearn中提供了很多测试数据集,这些数据集也可以用于其它机器学习的框架中。
本次花的测试数据集加载方式为:
from sklearn import datasets

# 加载iris花的数据集
iris = datasets.load_iris()
print(iris)
我们来看下加载后的数据集长什么模样的:
{'data': array([[ 5.1,  3.5,  1.4,  0.2],
       [ 4.9,  3. ,  1.4,  0.2],
       [ 4.7,  3.2,  1.3,  0.2],
       [ 4.6,  3.1,  1.5,  0.2],
       [ 5. ,  3.6,  1.4,  0.2],
       [ 5.4,  3.9,  1.7,  0.4],
       [ 4.6,  3.4,  1.4,  0.3],
       [ 5. ,  3.4,  1.5,  0.2],
       [ 4.4,  2.9,  1.4,  0.2],
       [ 4.9,  3.1,  1.5,  0.1],
       [ 5.4,  3.7,  1.5,  0.2],
        [ 6.5,  3. ,  5.2,  2. ],
       [ 6.2,  3.4,  5.4,  2.3],
       [ 5.9,  3. ,  5.1,  1.8]]), 'target': array([0, 0, 0, 0, 0, 0, 0, 0, 0, 0, 0, 0, 0, 0, 0, 0, 0, 0, 0, 0, 0, 0, 0,
       0, 0, 0, 0, 0, 0, 0, 0, 0, 0, 0, 0, 0, 0, 0, 0, 0, 0, 0, 0, 0, 0, 0,
       0, 0, 0, 0, 1, 1, 1, 1, 1, 1, 1, 1, 1, 1, 1, 1, 1, 1, 1, 1, 1, 1, 1,
       1, 1, 1, 1, 1, 1, 1, 1, 1, 1, 1, 1, 1, 1, 1, 1, 1, 1, 1, 1, 1, 1, 1,
       1, 1, 1, 1, 1, 1, 1, 1, 2, 2, 2, 2, 2, 2, 2, 2, 2, 2, 2, 2, 2, 2, 2,
       2, 2, 2, 2, 2, 2, 2, 2, 2, 2, 2, 2, 2, 2, 2, 2, 2, 2, 2, 2, 2, 2, 2,
       2, 2, 2, 2, 2, 2, 2, 2, 2, 2, 2, 2]), 'target_names': array(['setosa', 'versicolor', 'virginica'],
      dtype='<U10'), 'DESCR': 'Iris Plants Database\n====================\n\nNotes\n-----\nData Set Characteristics:\n    :Number of Instances: 150 (50 in each of three classes)\n    :Number of Attributes: 4 numeric, predictive attributes and the class\n    :Attribute Information:\n        - sepal length in cm\n        - sepal width in cm\n        - petal length in cm\n        - petal width in cm\n        - class:\n                - Iris-Setosa\n                - Iris-Versicolour\n                - Iris-Virginica\n    :Summary Statistics:\n\n    ============== ==== ==== ======= ===== ====================\n                    Min  Max   Mean    SD   Class Correlation\n    ============== ==== ==== ======= ===== ====================\n    sepal length:   4.3  7.9   5.84   0.83    0.7826\n    sepal width:    2.0  4.4   3.05   0.43   -0.4194\n    petal length:   1.0  6.9   3.76   1.76    0.9490  (high!)\n    petal width:    0.1  2.5   1.20  0.76     0.9565  (high!)\n    ============== ==== ==== ======= ===== ====================\n\n    :Missing Attribute Values: None\n    :Class Distribution: 33.3% for each of 3 classes.\n    :Creator: R.A. Fisher\n    :Donor: Michael Marshall (MARSHALL%PLU@io.arc.nasa.gov)\n    :Date: July, 1988\n\nThis is a copy of UCI ML iris datasets.\nhttp://archive.ics.uci.edu/ml/datasets/Iris\n\nThe famous Iris database, first used by Sir R.A Fisher\n\nThis is perhaps the best known database to be found in the\npattern recognition literature.  Fisher\'s paper is a classic in the field and\nis referenced frequently to this day.  (See Duda & Hart, for example.)  The\ndata set contains 3 classes of 50 instances each, where each class refers to a\ntype of iris plant.  One class is linearly separable from the other 2; the\nlatter are NOT linearly separable from each other.\n\nReferences\n----------\n   - Fisher,R.A. "The use of multiple measurements in taxonomic problems"\n     Annual Eugenics, 7, Part II, 179-188 (1936); also in "Contributions to\n     Mathematical Statistics" (John Wiley, NY, 1950).\n   - Duda,R.O., & Hart,P.E. (1973) Pattern Classification and Scene Analysis.\n     (Q327.D83) John Wiley & Sons.  ISBN 0-471-22361-1.  See page 218.\n   - Dasarathy, B.V. (1980) "Nosing Around the Neighborhood: A New System\n     Structure and Classification Rule for Recognition in Partially Exposed\n     Environments".  IEEE Transactions on Pattern Analysis and Machine\n     Intelligence, Vol. PAMI-2, No. 1, 67-71.\n   - Gates, G.W. (1972) "The Reduced Nearest Neighbor Rule".  IEEE Transactions\n     on Information Theory, May 1972, 431-433.\n   - See also: 1988 MLC Proceedings, 54-64.  Cheeseman et al"s AUTOCLASS II\n     conceptual clustering system finds 3 classes in the data.\n   - Many, many more ...\n', 'feature_names': ['sepal length (cm)', 'sepal width (cm)', 'petal length (cm)', 'petal width (cm)']}
其中我们就能看出此数据集中有data属性和target属性,还有target_names属性等,具体使用方法可以在IDEA开发环境中按住Ctrl键并用鼠标点击load_iris函数,就能看到相应的用法以及所拥有的属性数据了,我们不必费力地来记忆其数据中有哪些属性。
在data属性中,其数据结构类似:
[ 4.9, 3.1, 1.5, 0.1],
这里有4个维度的数据,分别代表了我们前面提到的花瓣的长度、花瓣的宽度、茎的长度以及茎的宽度。
而在target中就指出了这种属性对是属于哪种花,target中的取值是0,1,2,也就是分属于3种类型的花,具体花的名字不是很重要,虽然在target_names中指明了花的名字。
我们打印一下data的维度:
from sklearn import datasets

# 加载iris花的数据集
iris = datasets.load_iris()
data = iris.data
print("data的维度:", data.shape)

target = iris.target
print("target的维度:", target.shape)
输出为:
data的维度: (150, 4)
target的维度: (150,)
也就是测试数据集总共有150行(150个测试案例),而每行有4个属性列的值,相应的,对这150个测试案例都进行了人工标注,总共标注了150个数据,每个标注结果为1个数字,分别为0,1,2,代表属于哪种花的种类。
训练集与测试集分离
在机器学习中,通过数据中隐含的规律来进行学习,因此需要有一部分训练集,从训练集中找出这些数据的规律,然后再根据从训练集中找出的规律来进行测试,看从训练集中找出的规律是否具有一定的普遍性。这样就还需要有测试集,就像我们上学时的学习一样,平常要做练习题,阶段性后还会有考试来检验我们平常学得如何。
创建训练集和测试集的方法为:
from sklearn.model_selection import train_test_split

# 对原始数据集按照测试集占总量的30%,训练集占总量的70%进行拆分。
X_train, X_test, y_train, y_test = train_test_split(data, target, test_size=0.3)
这里测试集占总量的30%,训练集占总量的70%,就像我们平常学习时,训练题做得多一点,考试不是那么经常考的,一般一周学习后才会考一次试。
如果我们把y_test打印出来的话,会发现其结果是乱序的,跟我们平常学习也类似,一般训练题或考试题都不会一直对同一个知识点连续地考,会把知识点进行分散地来考试。
有了训练数据集,我们就在此数据上进行训练,但怎么训练呢?这里我们用K近邻法(k-nearst neighbors,KNN)进行训练。
KNN的目的是当提供了一个未知的特征集后,我们能够根据这些特征集寻找到最接近此特征集的分类。
举个简单的例子,例如提供一个运动员的身高,其身高1.98米,你认为他是什么运动员?篮球运动员嘛,因为篮球运动员一般身高比较高。
也就是提供一堆运动员的身高以及他们所从事的运动项目,进行KNN训练后,模型中自动会总结出身高同运动项目的关系,这样当提供一个新的身高数据,系统会根据KNN算法计算同此身高最接近的训练集中的数据,并概括出此类似身高所从事的体育项目。
KNN的核心就是距离计算,这里就不细展开了,只要明白KNN是搜索出同此属性最接近的所属分类就可以了。
sklearn中使用fit函数,也就是根据训练集数据进行适应或者训练,代码为:
knn = KNeighborsClassifier()
knn.fit(X_train, y_train)
训练完成后,我们来测试一下看看,看学到了这些数据中的规律:
print("预测值:")
print(knn.predict(X_test))
print("实际值:")
print(y_test)
输出为:
预测值:
[2 1 2 1 0 0 2 1 2 2 0 2 0 2 0 0 2 1 1 1 0 2 2 1 0 1 0 0 2 2 2 1 1 2 1 2 0
 2 0 1 2 0 2 1 1]
实际值:
[2 1 2 1 0 0 2 1 2 2 0 2 0 1 0 0 2 1 1 1 0 2 2 1 0 1 0 0 2 2 2 1 1 2 1 2 0
 2 0 1 2 0 2 1 1]
从结果上看,基本上都预测对了。
完整的代码如下:
from sklearn import datasets
from sklearn.model_selection import train_test_split
from sklearn.neighbors import KNeighborsClassifier

# 加载iris花的数据集


iris = datasets.load_iris()
data = iris.data
print("data的维度:", data.shape)

target = iris.target
print("target的维度:", target.shape)

# 对原始数据集按照测试集占总量的30%,训练集占总量的70%进行拆分。
X_train, X_test, y_train, y_test = train_test_split(data, target, test_size=0.3)

# 训练数据
knn = KNeighborsClassifier()
knn.fit(X_train, y_train)

# 预测数据
print("预测值:")
print(knn.predict(X_test))
print("实际值:")
print(y_test)

出处:http://www.cnblogs.com/dreampursuer/
本文版权归作者所有,欢迎转载,但未经作者同意必须保留此段声明,且在文章页面明显位置给出原文连接,否则保留追究法律责任的权利。

 浙公网安备 33010602011771号