
部署prometheus监控vllm
1、访问官网下载:
wget https://github.com/prometheus/prometheus/releases/download/v3.5.0/prometheus-3.5.0.linux-amd64.tar.gz
2、安装:
mkdir /usr/local/prometheus
tar -zxf prometheus-3.5.0.linux-amd64.tar.gz
cp -r prometheus-3.5.0.linux-amd64/* /usr/local/prometheus/
3、配置服务项:
vim /etc/systemd/system/prometheus.service ,内容如下:
[Unit]
Description="prometheus"
Documentation=https://prometheus.io/
After=network.target
[Service]
Type=simple
ExecStart=/usr/local/prometheus/prometheus  --config.file=/usr/local/prometheus/prometheus.yml --storage.tsdb.path=/usr/local/prometheus/data --web.enable-lifecycle --enable-feature=remote-write-receiver --query.lookback-delta=2m --web.enable-admin-api
ExecReload=/bin/kill -HUP $MAINPID
Restart=on-failure
SuccessExitStatus=0
LimitNOFILE=65536
StandardOutput=syslog
StandardError=syslog
SyslogIdentifier=prometheus
[Install]
WantedBy=multi-user.target
启动服务:
systemctl start prometheus
systemctl enable prometheus
systemctl status prometheus
4、访问http://127.0.0.1:9000可以打开页面
编辑配置文件,增加对vllm的监控,如下:
vim /usr/local/prometheus/prometheus.yml
scrape_configs:
  # The job name is added as a label `job=<job_name>` to any timeseries scraped from this config.
  - job_name: "vllm_job"

    # metrics_path defaults to '/metrics'
    # scheme defaults to 'http'.

    static_configs:
      - targets: ["10.0.11.5:801"]
       # The label name is added as a label `label_name=<label_value>` to any timeseries scraped from this config.
        labels:
          app: "vllm"
~
保存后system reload prometheus
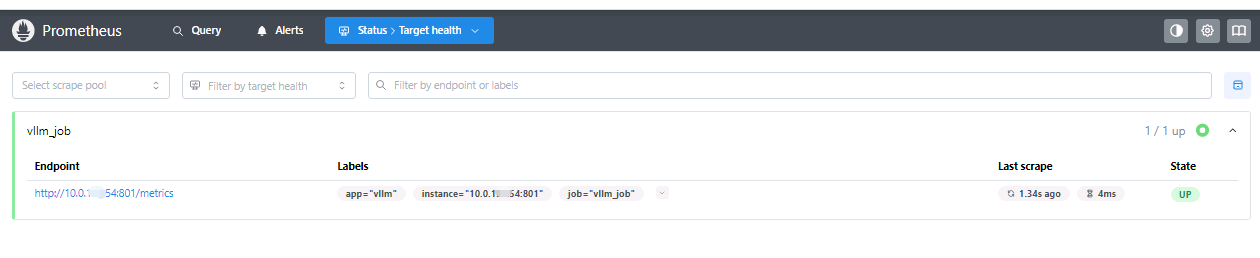
在Status-Target health页面下可以看到监控目标服务器:
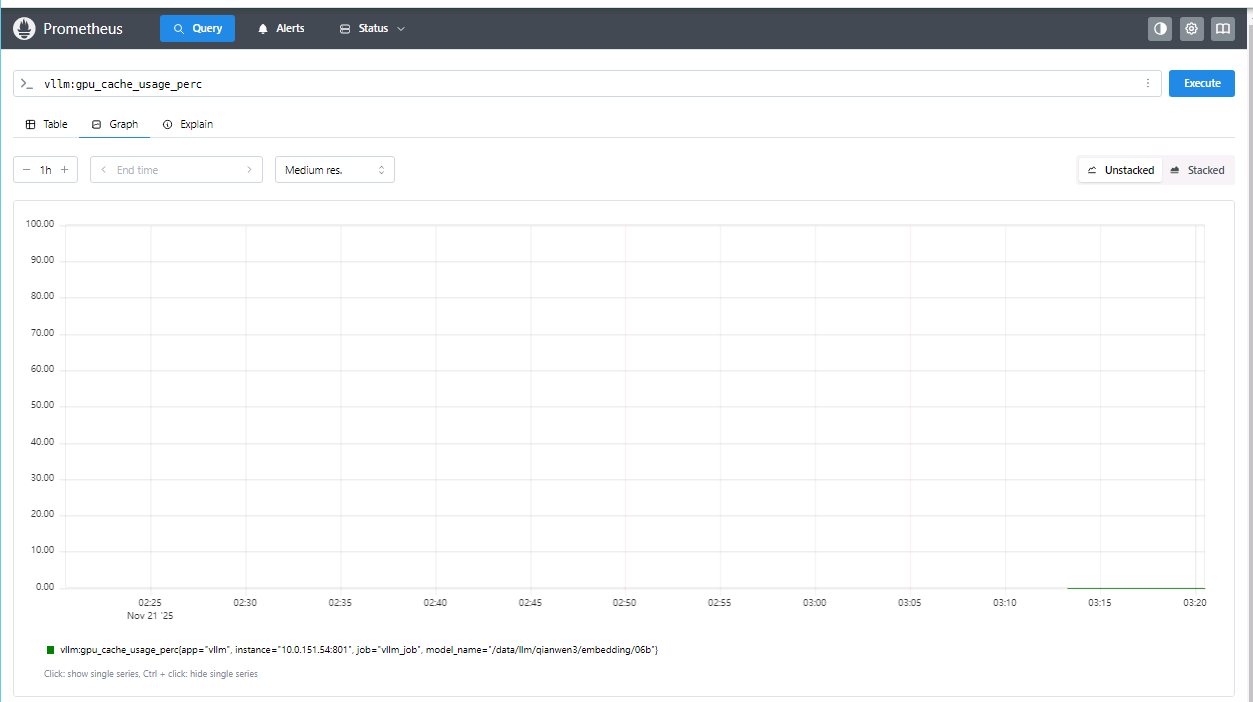
在Query页面,可以查询vllm的各个监控指标

 浙公网安备 33010602011771号