《数据分析实战-托马兹.卓巴斯》读书笔记第6章-回归模型
第6章涵盖了许多回归模型,有线性的,也有非线性的。我们还会复习随机森林和支持向量机,它们可用来解决分类或回归问题。
本章会介绍一些技术,以预测发电厂生产的电量。你将学习以下主题:
·识别并解决数据中的多重共线性
·构建线性回归模型,预测发电厂生产的电量
·使用OLS预测生产的电量
·使用CART估算发电厂生产的电量
·将kNN模型用于回归问题
·将随机森林模型用于回归分析
·使用SVM预测发电厂生产的电量
·训练神经网络,预测发电厂生产的电量
6.1导论
现实世界中一个常见的问题就是预测数量,或者用更抽象的说法,是在自变量和因变量之间找到联系。本章中,我们专注于预测发电厂生产的电量。
本章使用的数据集来自于美国联邦能源信息管理局(U.S.Energy Information Adminis-tration)。从网站上下载2014年的数据:http://www.eia.gov/electricity/data/eia923/xls/f923_2014.zip。
下载页面:https://www.eia.gov/electricity/data/eia923/ 右边选择ZIP下载即可。
我们仅使用EIA923_Schedules_2_3_4_5_M_12_2014_Final_Revision.xlsx文件中Generation and Fuel Data这一sheet的数据。我们将预测净产量(兆瓦时)。所有数据都是类别变量(州名或燃料类型),我们决定将它们硬编码。
最终,我们的数据集仅有4494行记录,是整个数据集的一个子集。我们仅选择少数州2014年超出100MWh的发电厂。我们也只选取使用特定燃料类型的发电厂——Aggregate Fuel Code(AER):coal(COL),distillate(DFO),hydroelectric conventional(HYC),biogenic municipal solid waste and landfill gas(MLG),natural gas(NG),nuclear(NUC),solar(SUN)以及wind(WND)。另外,只选取特定发动机的发电厂:combined-cycle combustion turbine part(CT),combustion turbine(GT),hydraulic turbine(HY),internal combustion(IC),photovoltaic(PV),steam turbine(ST)以及wind turbine(WT)。
发电厂的电量数据方差很大,并且高度偏斜,中位数是18219MWh,平均数是448213MWh;25%的发电厂(2017家)在2014年的电量少于3496MWh,而美国人均用电量是12kWh左右(2010年的数据,http://energyalmanac.ca.gov/electricity/us_per_capita_electricity-2010.html),几乎相当于291人的小镇,如下图所示: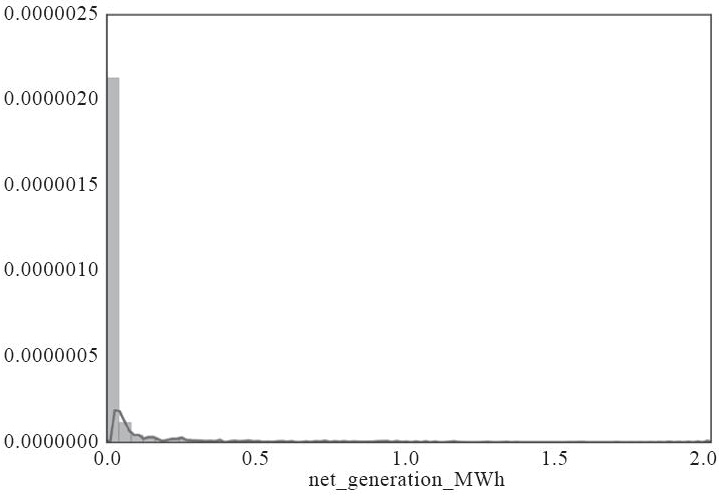
大部分发电厂使用天然气(超过1300家),将近750家使用水力或光生发电,接近580家使用风力发电。这样,我们得到了我们数据集中使用可再生能源的发电厂比例:
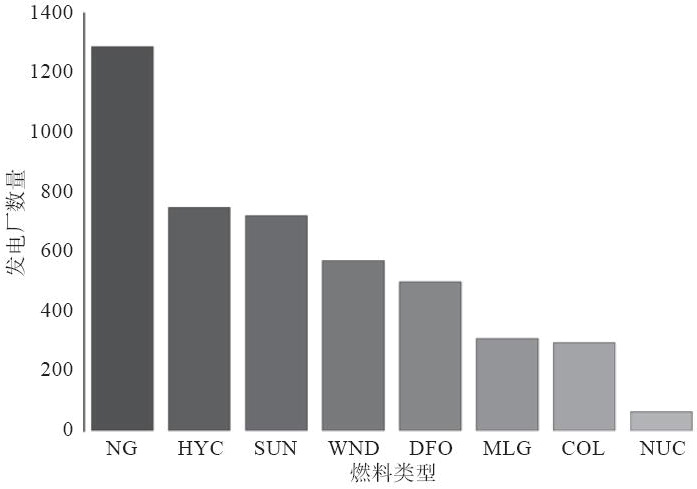
NG天然气,HYC水力,SUN太阳能、光生,WND风力
接近2500家发电厂使用蒸汽涡轮生产电力,紧接着的是水轮机和燃气涡轮:
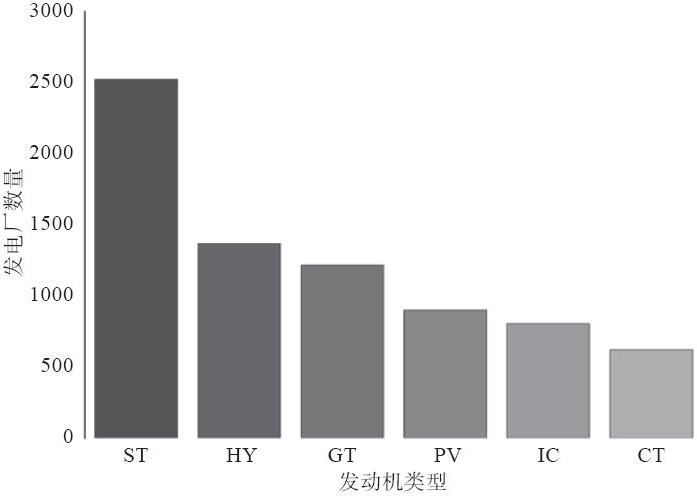
ST蒸汽涡轮,HY水轮,GT燃气轮机
我们数据集中加利福尼亚的发电厂最多,超过1200家。德克萨斯以超过500家的数量位居第二,排第三的是马萨诸塞:
6.2识别并解决数据中的多重共线性
多重共线性指的是这样的场景,一个(或多个)自变量可以表示为其他自变量的线性组合。
例如,假设我们用州中的人口、家庭数和发电厂数来预测用电量。这种情况下,可以想见,州中人口越多,家庭数应该也越多,也就是说,家庭数可以表示为州中人口的某些(接近)线性关系。
现在,如果我们要基于多重共线的数据估算模型,很有可能会有一个(甚至所有的共线变量)是不显著的。将这个变量移除(并只保留和因变量最相关的变量,这样,保留了大部分对方差的贡献),并不会降低模型的解释能力。
准备:需装好pandas、NumPy和Scikit。我们使用Scikit降低维度。
要判断我们的数据是否共线,我们需要查看自变量协方差矩阵的特征值;如果数据共线,对协方差矩阵的分析有助于辨别变量(regression_multicollinearity.py文件):
 1 # this is needed to load helper from the parent folder
 2 import sys
 3 sys.path.append('..')
 4
 5 # the rest of the imports
 6 import helper as hlp
 7 import pandas as pd
 8 import numpy as np
 9 import sklearn.decomposition as dc
10
11 def reduce_PCA(x, n):
12     '''
13         Reduce the dimensions using Principal Component
14         Analysis
15     '''
16     # create the PCA object
17     pca = dc.PCA(n_components=n, whiten=True)
18
19     # learn the principal components from all the features
20     return pca.fit(x)
21
22 # the file name of the dataset
23 r_filename = '../../Data/Chapter06/power_plant_dataset.csv'
24
25 # read the data
26 csv_read = pd.read_csv(r_filename)
27
28 x = csv_read[csv_read.columns[:-1]].copy()
29 y = csv_read[csv_read.columns[-1]]
30
31 # produce correlation matrix for the independent variables
32 #生成自变量协方差矩阵
33 corr = x.corr()
34
35 # and check the eigenvectors and eigenvalues of the matrix
36 #检查矩阵的特征向量与特征值
37 w, v = np.linalg.eig(corr)
38 print('Eigenvalues: ', w)
39
40 # values that are close to 0 indicate multicollinearity
41 #接近0的值意味着多重共载
42 s = np.nonzero(w < 0.01)
43 # inspect which variables are collinear
44 #找出共线变量
45 print('Indices of eigenvalues close to 0:', s[0])
46
47 all_columns = []
48 for i in s[0]:
49     print('\nIndex: {0}. '.format(i))
50
51     t = np.nonzero(abs(v[:,i]) > 0.33)
52     all_columns += list(t[0]) + [i]
53     print('Collinear: ', t[0])
原理:首先,我们和往常一样载入必需的模块并读入数据集。然后,我们将数据集拆分成自变量x(我们为原始的数据集创建一个副本)和因变量y。
接下来,我们生成所有自变量之间的协方差矩阵,使用NumPy在linalg模块中的eig(...)方法找到特征值和特征向量。eig(...)方法要求输入一个方阵。
只有方阵才有特征向量和特征值。非方形的矩阵有奇异值(https://www.math.washington.edu/~greenbau/Math_554/Course_Notes/ch1.5.pdf)。
接近于0的特征值意味着(多重)共线性。要找到这些值(我们的例子中,<0.01)的索引,我们先创建一个真值向量:每个元素不是False(0)就是True(1)。简单一句w<0.001就可以完成;这个操作的结果就是到原始向量w的等长真值向量,这个向量中小于0.001的值标为True。然后我们可以使用NumPy的.nonzero(...)方法返回非零元素的索引列表(我们的例子中,返回的就是True元素的索引)。你很有可能在不止一个位置获得特征值接近0的元素。对于我们的数据集,你可能得到类似的结果:
/*
Indices of eigenvalues close to 0: [28 29 30 31 32]
*/
我们遍历索引,找到相应的特征向量。特征向量中显著大于0的元素会帮我们找到共线的变量。由于特征向量可以有负值,我们返回绝对值>0.33的元素索引:
/*
Index: 28.
Collinear:  [0 1 3]

Index: 29.
Collinear:  [ 9 11 12 13]

Index: 30.
Collinear:  [15]

Index: 31.
Collinear:  [ 2 10]

Index: 32.
Collinear:  [ 4 14]
*/
注意这些变量的重复。我们将这些值存到all_columns列表。等我们遍历所有接近0的特征值,我们来看看哪些变量是共线的:
for i in np.unique(all_columns):
    print('Variable {0}: {1}'.format(i, x.columns[i]))
我们遍历all_columns列表中去重后的值(使用NumPy的.unique(...)方法),输出x中所有列相应的变量名:
/*
Variable 0: fuel_aer_NG
Variable 1: fuel_aer_DFO
Variable 2: fuel_aer_HYC
Variable 3: fuel_aer_SUN
Variable 4: fuel_aer_WND
Variable 9: mover_GT
Variable 10: mover_HY
Variable 11: mover_IC
Variable 12: mover_PV
Variable 13: mover_ST
Variable 14: mover_WT
Variable 15: state_CA
Variable 28: state_OH
Variable 29: state_GA
Variable 30: state_WA
Variable 31: total_fuel_cons
Variable 32: total_fuel_cons_mmbtu
*/
现在我们能清楚看出来数据集中的共线性了:某种发动机当然与某种燃料相关。比如,风力发动机用的是风,光能发动机用的是太阳能,水力发电靠的是水。另外,加利福尼亚州也出现了;加利福尼亚是拥有最多风力涡轮机的州(第二位是德克萨斯,http://www.awea.org/resources/statefactsheets.aspx?itemnumber=890)。
(除了删减模型中的变量而外)解决多重共线性的一个方法就是对数据集降维。我们可以通过PCA做到这一点(参考本书5.3节)。
我们重用reduce_PCA(...)方法:
 1 # and reduce the data keeping only 5 principal components
 2 n_components = 5
 3 z = reduce_PCA(x, n=n_components)
 4 pc = z.transform(x)
 5
 6 # how much variance each component explains?
 7 #每个成分对方差贡献多少大?
 8 print('\nVariance explained by each principal component: ',
 9     z.explained_variance_ratio_)
10
11 # and total variance accounted for
12 #一共贡献多少方差
13 print('Total variance explained: ',
14     np.sum(z.explained_variance_ratio_))
我们希望得到5个PC(principal components,主成分)。reduce_PCA(...)方法估算模型,.transform(...)方法转换我们的数据,返回5个主成分。我们可以查看每个主成分对整体方差的贡献:
第一个主成分大约贡献了14.5%,第二个约13%,第三个约11%。剩下两个的贡献加起来大约16%,所以一共是:
/*
Variance explained by each principal component:  [0.14446578 0.13030196 0.11030824 0.0935897  0.06694611]
Total variance explained:  0.5456117974906106
*/
我们将主成分和其他变量一起存到一个文件中:
 1 # append the reduced dimensions to the dataset
 2 for i in range(0, n_components):
 3     col_name = 'p_{0}'.format(i)
 4     x[col_name] = pd.Series(pc[:, i])
 5
 6 x[csv_read.columns[-1]] = y
 7 csv_read = x
 8
 9 # output to file
10 w_filename = '../../Data/Chapter06/power_plant_dataset_pc.csv'
11 with open(w_filename, 'w',newline='') as output:
12     output.write(csv_read.to_csv(index=False))
首先,我们将主成分附加到x数据集后面;我们希望将因变量放在最后。然后,我们将数据集输出到power_plant_dataset_pc.csv供后续使用。
6.3构建线性回归模型
线性回归无疑是最易于构建的模型。当你知道因变量和自变量之间是线性关系时就可以选择。
准备:需装好pandas、NumPy和Scikit。
用Scikit估算回归模型很简单(regression_linear.py文件):
 1 # this is needed to load helper from the parent folder
 2 import sys
 3 sys.path.append('..')
 4
 5 # the rest of the imports
 6 import helper as hlp
 7 import pandas as pd
 8 import numpy as np
 9 import sklearn.linear_model as lm
10
11 @hlp.timeit
12 def regression_linear(x,y):
13     '''
14         Estimate a linear regression估算线性回归
15     '''
16     # create the regressor object创建回归对象
17     linear = lm.LinearRegression(fit_intercept=True,
18         normalize=True, copy_X=True, n_jobs=-1)
19
20     # estimate the model估算模型
21     linear.fit(x,y)
22
23     # return the object
24     return linear
25
26 # the file name of the dataset
27 r_filename = '../../Data/Chapter06/power_plant_dataset_pc.csv'
28
29 # read the data
30 csv_read = pd.read_csv(r_filename)
31
32 # select the names of columns
33 dependent = csv_read.columns[-1]
34 independent_reduced = [
35     col
36     for col
37     in csv_read.columns
38     if col.startswith('p')
39 ]
40
41 independent = [
42     col
43     for col
44     in csv_read.columns
45     if      col not in independent_reduced
46         and col not in dependent
47 ]
48
49 # split into independent and dependent features
50 #拆成自变量和因变量特征
51 x     = csv_read[independent]
52 x_red = csv_read[independent_reduced]
53 y     = csv_read[dependent]
54
55
56 # estimate the model using all variables (without PC)
57 #使用所有变量估算模型
58 regressor = regression_linear(x,y)
59
60 # print model summary
61 print('\nR^2: {0}'.format(regressor.score(x,y)))
62 coeff = [(nm, coeff)
63     for nm, coeff
64     in zip(x.columns, regressor.coef_)]
65 intercept = regressor.intercept_
66 print('Coefficients: ', coeff)
67 print('Intercept', intercept)
68 print('Total number of variables: ',
69     len(coeff) + 1)
原理:按照惯例,我们先导入必需的模块并读入数据集。然后将数据拆成子集。
首先,我们取出代表因变量的列名(数据集的最后一列)、主成分(independent_reduced)以及自变量。选取主成分时,由于所有的主成分列都以p_开头(参见本书6.2节中的“更多”部分),我们使用Python内建的.startswith(...)方法。选取自变量时,我们取出所有既不是independent_reduced也不是dependent的列。然后我们从数据集中提取这些列。
我们调用regression_linear(...)方法估算模型。这个方法接受两个参数:自变量x和因变量y。
regression_linear(...)方法内部,我们先用.LinearRegression(...)方法创建模型对象。我们指定模型要估算常数(fit_intercept=True),正规化数据,并复制自变量。
Python(默认情况下)传参是传引用(不像C或C++那样是传值),所以方法改变了传入的数据,这一可能性总是存在的。http://www.python-course.eu/passing_arguments.php。
我们也将并行跑的任务数设为计算机的核数。尽管对于线性回归来说,这一般不是个问题。
有了模型对象,我们应用(.fit(...)方法)数据,即估算并返回模型。
线性回归模型的性能可以R2(R平方)的形式表示。这个指标可以理解为模型对方差的贡献的度量。
在本书6.4节,我们会介绍如何手动计算R2。
LinearRegression对象提供了.score(...)方法。我们的模型有如下的结果:
/*
R^2: 0.9965751657989851
 */
我们使用列表表达式创建了coeff列表,以将所有变量的列表及相应的系数打印出来。我们先(用zip(...)方法)将x的列和回归器的coeff_属性压缩在一起;这创建了一个元组构成的列表,我们将遍历列表中的元组以创建coeff列表:

注意州的系数之间的差距有多大。另外,所有电力相关的变量(燃料和发动机)都是负的。这体现了州对我们的模型的整体表现有一个最小的影响,特别是与截距相比时:
/*
Intercept -11531009013.842264
*/
我们已由前一技巧知道,燃料总量是相关变量,所以我们可以安心地将其移除。
别忘了数据集中有多重共线性,我们只用主成分估算模型:
 1 # estimate the model
 2 regressor_nm = regression_linear(x_no_state,y)
 3
 4 # print model summary
 5 print('\nR^2: {0}'.format(regressor_nm.score(x_no_state,y)))
 6 coeff = [(nm, coeff)
 7     for nm, coeff
 8     in zip(x_no_state.columns, regressor_nm.coef_)]
 9 intercept = regressor_nm.intercept_
10 print('Coefficients: ', coeff)
11 print('Intercept', intercept)
12 print('Total number of variables: ',
13     len(coeff) + 1)
这个模型的R2结果更差:
/*
R^2: 0.12740548278756392
 */
由于州的影响不大,我们决定试试不考虑这个因素。我们也不考虑total_fuel_consumption:
1 # removing the state variables and keeping only fuel and state
2 columns = [col for col in independent if 'state' not in col and col != 'total_fuel_cons']
3 x_no_state = x[columns]
R2有下降,但不显著:
/*
R^2: 0.9957289744500172
*/
不过,现在我们模型的自变量由35个(包括截距)变成了18个。有个精神要把握住,类似的表现下,你应该选解释变量更少的模型。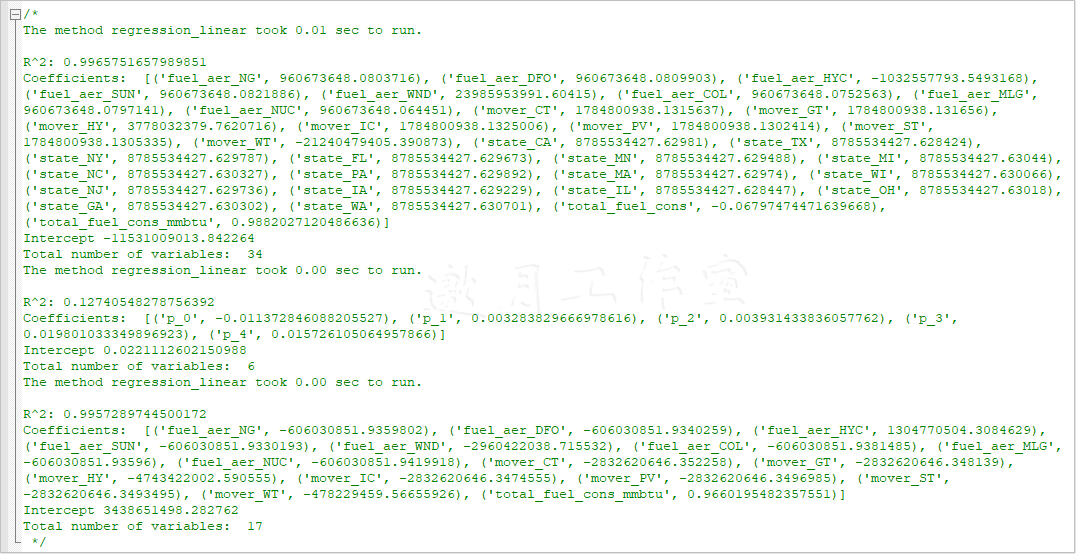
要找到最佳直线(并且你只有一个解释变量),你可以使用Seaborn。尽管结果并不直观,但我们可以使用主成分来展示。
首先,由于我们将主成分存在列中,我们将它们放在栈顶,这样数据集中只有三列——PC是主成分,x是主成分的值,y是正规化的发电量:
 1 # stack up the principal components
 2 #将主成分放在栈顶
 3 pc_stack = pd.DataFrame()
 4
 5 # stack up the principal components
 6 #将主成分放在栈顶
 7 for col in x_red.columns:
 8     series = pd.DataFrame()
 9     series['x'] = x_red[col]
10     series['y'] = y
11     series['PC'] = col
12     pc_stack = pc_stack.append(series)
我们先创建一个空的pandas DataFrame。然后,我们遍历x_red中的列(只有主成分)。DataFrame的内部序列将主成分的值放在x,将因变量的值放在y,将主成分的名字放在PC。然后我们将序列附加到pc_stack。
现在绘制图线:
1 # Show the results of a linear regression within each
2 # principal component
3 sns.lmplot(x='x', y='y', col='PC', hue='PC', data=pc_stack,
4            col_wrap=2, size=5)
5
6 pl.savefig('../../Data/Chapter06/charts/regression_linear.png',
7     dpi=300)
.lmplot(...)方法将线性回归用到我们的数据上。col参数指定了图表的分组,我们将为5个主成分生成图表。hue参数将为每个主成分更换颜色。col_wrap=2意味着我们在一行中放两个图表,每个都是5英寸高。
结果如下: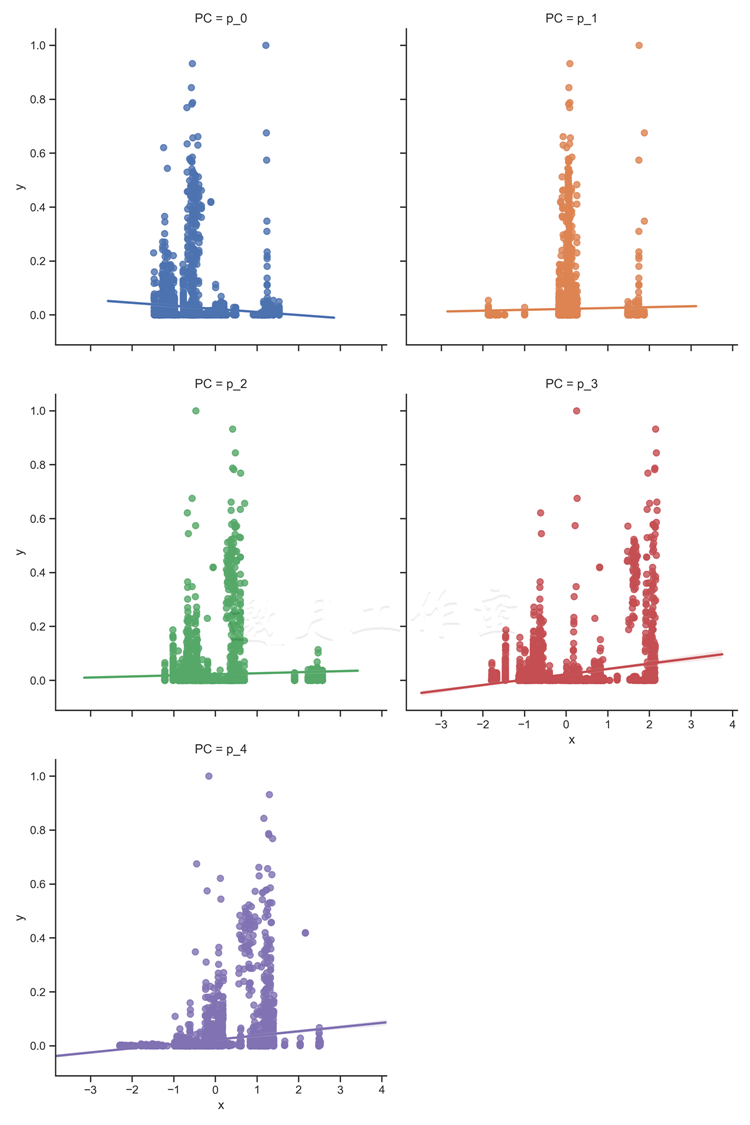
Tips:
/*
D:\tools\Python37\lib\site-packages\seaborn\regression.py:546: UserWarning: The `size` paramter has been renamed to `height`; please update your code.
  warnings.warn(msg, UserWarning)
*/
解决方案:size=5改为height=5
/*
sns.lmplot(x='x', y='y', col='fuel', hue='fuel',
    data=fuel_stack, col_wrap=2, height=5)
 */
我们也查看两个燃料变量,看是否存在线性关系:
# select only the fel consumption
fuel_cons = ['total_fuel_cons','total_fuel_cons_mmbtu']
x = csv_read[fuel_cons]
下面的图显示了,total_fuel_cons_mmbtu存在线性关系,total_fuel_cons也存在接近线性的关系: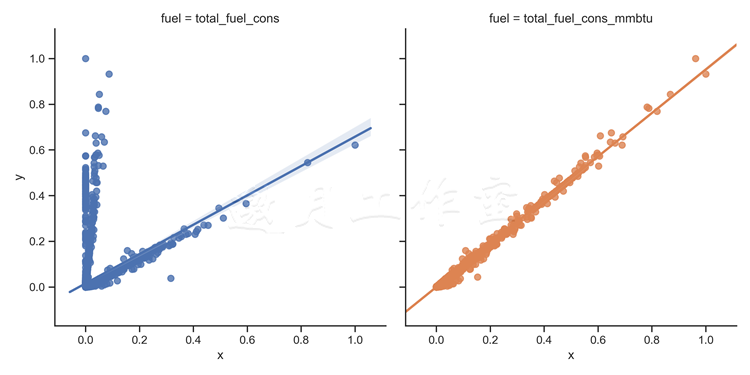
/*
MMBTU,million British Thermal Units代表百万英热单位,百万英制热单位。
1mmBtu=2.52X10^8cal(卡) =2.52X10^5 kcal(千卡)
1桶原油=5.8 MMBTU
 */
燃料消耗总量不考虑存储量;只考虑使用的资源总体积(或重量)。但是,一磅的铀或钚比起一磅的煤,产生的能量要多得多。所以total_fuel_cons在x的低值一端有很大的偏离。当我们考虑特定的能量(或对液体燃料来说的能量密度),total_fuel_cons_mmbtu,我们在能量的消耗和产出之间看到了线性关系。
你可以从图中看出来,这条线的趋势<1,代表着系统的损失。注意,有些燃料是可再生的,风力或太阳能发电时我们几乎不用承担输入相关(燃料)的成本。
6.4使用OLS预测生产的电量
OLS(Ordinary Least Squares,最小二乘法)也是一个线性模型。使用最小二乘法实际上也估算了一个线性回归。然而,即使自变量与因变量之间不是线性关系,只要参数之间是线性关系,OLS就可以估算出一个模型。
准备:需装好pandas和Statsmodels。
按照惯例,为模型估算包一层函数(regression_ols.py文件):
 1 import statsmodels.api as sm
 2
 3 @hlp.timeit
 4 def regression_ols(x,y):
 5     '''
 6         Estimate a linear regression
 7     '''
 8     # add a constant to the data
 9     x = sm.add_constant(x)
10
11     # create the model object
12     model = sm.OLS(y, x)
13
14     # and return the fit model
15     return model.fit()
16
17 # the file name of the dataset
18 r_filename = '../../Data/Chapter06/power_plant_dataset_pc.csv'
19
20 # read the data
21 csv_read = pd.read_csv(r_filename)
22
23 # select the names of columns
24 dependent = csv_read.columns[-1]
25 independent_reduced = [
26     col
27     for col
28     in csv_read.columns
29     if col.startswith('p')
30 ]
31
32 independent = [
33     col
34     for col
35     in csv_read.columns
36     if      col not in independent_reduced
37         and col not in dependent
38 ]
39
40 # split into independent and dependent features
41 x = csv_read[independent]
42 y = csv_read[dependent]
43
44 # estimate the model using all variables (without PC)
45 regressor = regression_ols(x,y)
46 print(regressor.summary())
原理:首先,我们按照惯例读入必需的数据并选取自变量和因变量。
然后我们估算模型。先往数据中加一个常量;这仅仅是加一列1。然后用.OLS(...)方法创建回归器模型;这个方法与Scikit中的对应方法不同,接受自变量和因变量。最后,我们应用并返回模型。接着,打印出模型总结(这个在Scikit的线性回归中没有实现)。我们简化了表以节省空间: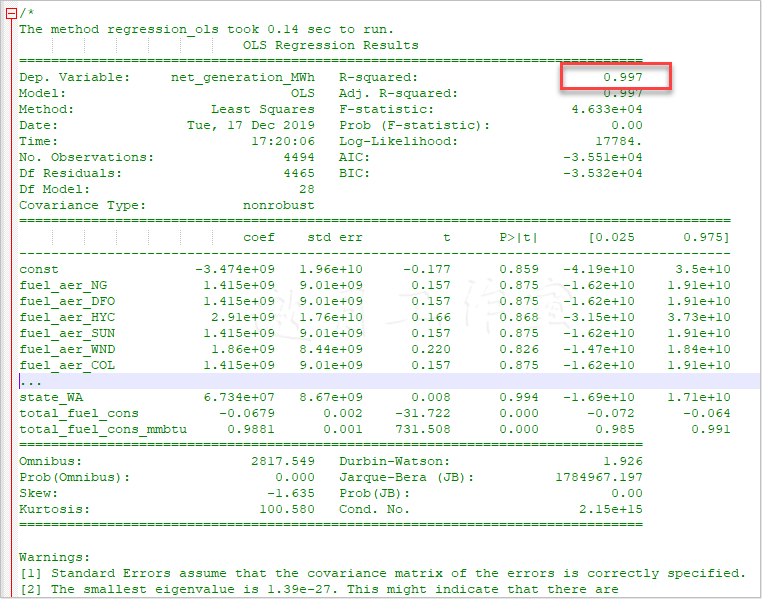
Tips:
/*
D:\tools\Python37\lib\site-packages\numpy\core\fromnumeric.py:2495: FutureWarning: Method .ptp is deprecated and will be removed in a future version.
Use numpy.ptp instead.
  return ptp(axis=axis, out=out, **kwargs)
*/
解决方案:无
可见,燃料类型、发动机和州名这几个变量在统计上是不显著的:p-value大于0.05。这些变量可以放心地从模型中移除,不会损失太多精度。注意,数字2告诉我们数据集中有很严重的多重共线性问题——这一点我们已经知道了。
R2以及total_fuel_cons与total_fuel_cons_mmbtu统计上的显著性证实了我们之前的发现:仅靠这两个变量就决定了发电厂的发电量。使用什么燃料并没有多大差别:同样的输入能量会得到同样的电量,不管是什么燃料。其实发电厂本质上就是个能量转换器:它将一种形式的能量转化为另一种。问题来了——为什么使用化石燃料,而不是可再生能源?
我们看下如果仅仅使用这两个变量,模型是不是同样有效:
1 # remove insignificant variables
2 #移除不显著的变量
3 significant = ['total_fuel_cons', 'total_fuel_cons_mmbtu']
4 x_red = x[significant]
5
6 # estimate the model with limited number of variables
7 # 用仅有的变量估算模型
8 regressor = regression_ols(x_red,y)
9 print(regressor.summary())
模型的表现并没有变差: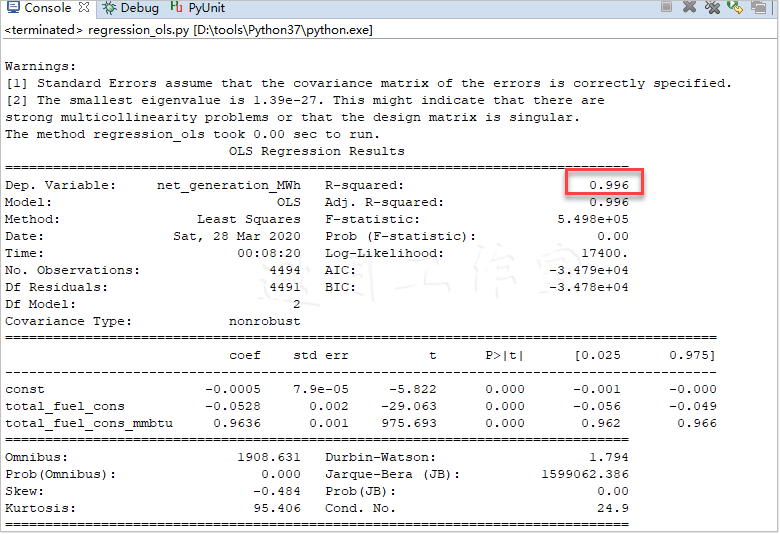
如你所见,R2从0.997降到了0.996,差异可忽略不计。注意这个常量,尽管统计上不显著,对最后的结果几乎没有影响。实际上,模型中值得保留的变量只有total_fuel_cons_mmbtu,因为它与发电量有最强的(线性)关系。
我们也可以使用MLPY估算OLS模型(regression_ols_alternative.py文件):
 1 import mlpy as ml
 2
 3 @hlp.timeit
 4 def regression_linear(x,y):
 5     '''
 6         Estimate a linear regression
 7     '''
 8     # create the model object
 9     ols = ml.OLS()
10
11     # estimate the model
12     ols.learn(x, y)
13
14     # and return the fit model
15     return ols
16
17 # the file name of the dataset
18 r_filename = '../../Data/Chapter06/power_plant_dataset_pc.csv'
19
20 # read the data
21 csv_read = pd.read_csv(r_filename)
22
23 # remove insignificant variables
24 significant = ['total_fuel_cons_mmbtu']
25 x = csv_read[significant]
26
27 # x = np.array(csv_read[independent_reduced[0]]).reshape(-1,1)
28 y = csv_read[csv_read.columns[-1]]
29
30 # estimate the model using all variables (without PC)
31 regressor = regression_linear(x,y)
32
33 # predict the output
34 predicted = regressor.pred(x)
35
36 # and calculate the R^2
37 score = hlp.get_score(y, predicted)
38 print('R2: ', score)
MLPY的.OLS()方法只能构建简单的线性模型。我们使用最显著的变量,total_fuel_cons_mmbtu。由于MLPY不提供关于模型表现的信息,我们决定手写一个评分函数(helper.py文件):
 1 def get_score(y, predicted):
 2     '''
 3         Method to calculate R^2
 4     '''
 5     # calculate the mean of actuals
 6     mean_y = y.mean()
 7
 8     # calculate the total sum of squares and residual
 9     # sum of squares
10     sum_of_square_total = np.sum((y - mean_y)**2)
11     sum_of_square_resid = np.sum((y - predicted)**2)
12
13     return 1 - sum_of_square_resid / sum_of_square_total
这个方法遵循了决定系数的标准定义:用1减去残差平方和与总平方和的比值。总平方和是因变量中每个观测值与平均值的差的平方和。残差平方和是因变量每个实际观测值与模型输出值的差的平方和。
get_score(...)方法要求两个输入参数:因变量的实际观测值和模型预测的值。
对于本模型,我们算出下述值:
/*
The method regression_linear took 0.00 sec to run.
R2:  0.9951670803634637
 */
参考:访问这个网址,看看OLS的另一种做法:http://www.datarobot.com/blog/ordinary-least-squares-in-python/。
6.5使用CART估算发电厂生产的电量
之前,我们用决策树给银行电话分类过(参考本书3.6节)。对于回归问题来说,分类树和回归树是一码事。
准备:需装好pandas和Scikit。
用Scikit估算CART很简单(regression_cart.py文件):
 1 import sklearn.tree as sk
 2
 3 @hlp.timeit
 4 def regression_cart(x,y):
 5     '''
 6         Estimate a CART regressor
 7     '''
 8     # create the regressor object
 9     cart = sk.DecisionTreeRegressor(min_samples_split=80,
10         max_features="auto", random_state=66666,
11         max_depth=5)
12
13     # estimate the model
14     cart.fit(x,y)
15
16     # return the object
17     return cart
原理:按照惯例,我们先载入数据,提取出因变量y和自变量x。同样以主成分的形式将自变量存到x_red。
估算模型时,和之前所有用Scikit估算的模型一样,我们创建模型对象。.DecisionTree Regressor(...)方法接受一系列参数。min_samples_split是节点中为了实现拆分至少要有的样本数。max_features是树可以使用的最多变量数;auto参数是说,如果需要的话,模型可以使用所有的自变量。random_state决定了模型的初始随机状态,max_depth决定了树最多能有多少层。
然后应用数据,返回估算的模型。我们看看模型表现如何:
# print out the results
print('R2: ', regressor.score(x,y))
结果看上去和之前差不多:
/*
The method regression_cart took 0.01 sec to run.
R2:  0.9595455136505057

The method regression_cart took 0.01 sec to run.
R:  0.7035525409649943
0. p_0: 0.17273577812298352
1. p_1: 0.08688236875805344
2. p_2: 0.0
3. p_3: 0.5429677683710962
4. p_4: 0.19741408474786684
*/
决策树的美在于,模型根本不会使用不显著的自变量。我们看看哪些是显著的:
1 for counter, (nm, label) \
2     in enumerate(
3         zip(x.columns, regressor.feature_importances_)
4     ):
5     print("{0}. {1}: {2}".format(counter, nm,label))
/*

0. fuel_aer_NG: 0.0
1. fuel_aer_DFO: 0.0
2. fuel_aer_HYC: 0.0
3. fuel_aer_SUN: 0.0
4. fuel_aer_WND: 0.0
5. fuel_aer_COL: 0.0
6. fuel_aer_MLG: 0.0
7. fuel_aer_NUC: 0.0
8. mover_CT: 0.0
9. mover_GT: 0.0
10. mover_HY: 0.0
11. mover_IC: 0.0
12. mover_PV: 0.0
13. mover_ST: 0.0
14. mover_WT: 0.0
15. state_CA: 0.0
16. state_TX: 0.0
17. state_NY: 0.0
18. state_FL: 0.0
19. state_MN: 0.0
20. state_MI: 0.0
21. state_NC: 0.0
22. state_PA: 0.0
23. state_MA: 0.0
24. state_WI: 0.0
25. state_NJ: 0.0
26. state_IA: 0.0
27. state_IL: 0.0
28. state_OH: 0.0
29. state_GA: 0.0
30. state_WA: 0.0
31. total_fuel_cons: 0.0
32. total_fuel_cons_mmbtu: 1.0

*/
我们遍历regressor(.DecisionTreeRegressor(...))的feature_importances_属性,查看使用zip(...)的相应名字。下面是简略的列表:
可以看到,模型只认为total_fuel_cons_mmbtu是显著的,具有100%的预测能力;其他变量都对模型的表现没有影响。
可以通过最后的决策树确认这一点:
# and export to a .dot file
sk.export_graphviz(regressor,
    out_file='../../Data/Chapter06/CART/tree.dot')
要将.dot文件转换为易读格式,可以在命令行使用dot命令。切到路径下(假设你在Codes/Chapter6文件夹):
要为我们的树生成一个PDF文件,只需执行下面这行命令:
/*
D:\PythonLearn\数据分析实战-托马兹·卓巴斯\tools\GraphViz\release\bin\dot -Tpdf D:\Java2018\practicalDataAnalysis\Data\Chapter06\CART\tree.dot -o D:\Java2018\practicalDataAnalysis\Data\Chapter06\CART\tree.pdf

D:\PythonLearn\数据分析实战-托马兹·卓巴斯\tools\GraphViz\release\bin\dot -Tpdf D:\Java2018\practicalDataAnalysis\Data\Chapter06\CART\tree_red.dot -o D:\Java2018\practicalDataAnalysis\Data\Chapter06\CART\tree_red.pdf

*/
得到的树应该只有一个决定变量: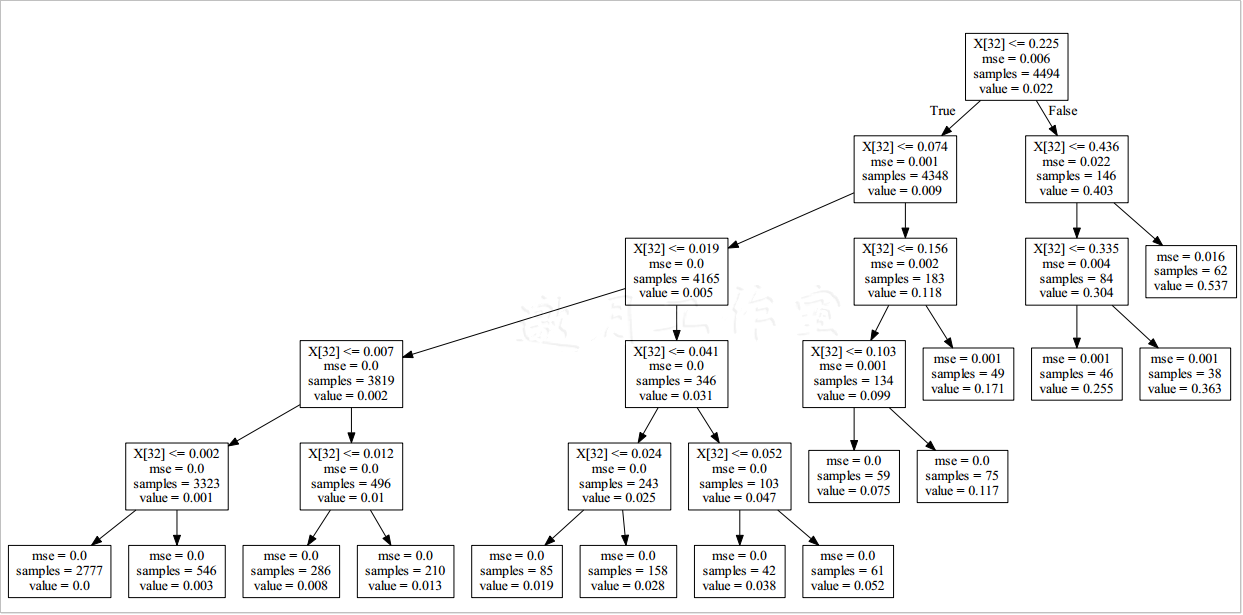
X[32],看一下列名列表,果然就是total_fuel_cons_mmbtu啊。
现在看看如果模型只有主成分,表现如何:
1 # estimate the model using Principal Components only
2 regressor_red = regression_cart(x_red,y)
3
4 # print out the results
5 print('R: ', regressor_red.score(x_red,y))
R2的值也可接受:
/*
R^2:  0.7035525409649943
*/
惊奇的是,(如果你还记得每个主成分对方差的贡献)第三个主成分是最重要的,而第二个是完全没用的:
/*
0. p_0: 0.17273577812298352
1. p_1: 0.08688236875805344
2. p_2: 0.0
3. p_3: 0.5429677683710962
4. p_4: 0.19741408474786684
 */
(通常)使用主成分的问题在于无法直接看懂结果,要得出真实意义就有点绕(https://onlinecourses.science.psu.edu/stat505/node/54)。
得到的树比前一棵更复杂:
参考:这里对这里对CART的介绍挺好:http://www.stat.wisc.edu/~loh/treeprogs/guide/wires11.pdf。
6.6将kNN模型用于回归问题
第3章中用到的k邻近模型,尽管多用于解决分类问题,但其实也可以用于解决回归问题。本技巧中来谈谈怎么用。
准备:需装好pandas和Scikit。
用Scikit估算模型很简单(regression_knn.py文件):
 1 import sklearn.neighbors as nb
 2 import sklearn.cross_validation as cv
 3
 4 @hlp.timeit
 5 def regression_kNN(x,y):
 6     '''
 7         Build the kNN classifier
 8     '''
 9     # create the classifier object
10     knn = nb.KNeighborsRegressor(n_neighbors=80,
11         algorithm='kd_tree', n_jobs=-1)
12
13     # fit the data
14     knn.fit(x,y)
15
16     #return the classifier
17     return knn
原理:首先,我们读入数据,并拆成因变量y和自变量x_sig;我们只选取之前发现是显著的变量total_fuel_cons和total_fuel_cons_mmbtu。我们也会测试只使用主成分构建的模型;这种情况下,我们使用x_principal。
我们使用Scikit的.KNeighborsRegressor(...)方法构建kNN回归模型。我们将n_neighbors设为80,指定kd_tree作为使用的算法。
查看kd-树是如何形成的:http://www.alglib.net/other/nearestneighbors.php。
指定并行任务数为-1,模型会使用与处理器核数相同的任务数。
估算的模型R2分值为0.94。
但是问题来了:模型的表现对数据来说有多敏感?我们用Scikit的cross_validation模块来测一下这个:
1 import sklearn.cross_validation as cv
2 # test the sensitivity of R2
3 scores = cv.cross_val_score(regressor, x_sig, y, cv=100)
4 print('Expected R2: {0:.2f} (+/- {1:.2f})'\
5     .format(scores.mean(), scores.std()**2))
首先,我们加载模块。然后,我们使用.cross_val_score(...)方法测试模型。第一个参数是要测试的模型,第二个参数是自变量的集合,第三个参数是因变量的集合。最后一个参数cv,指定了折叠的数量:原始数据集随机划分成的分块数。通常情况下,交叉验证只用到一个分块,剩下的用作训练数据集。
我们的结果:
/*
The method regression_kNN took 0.00 sec to run.
R^2:  0.9433911310360819
Expected R^2: 0.91 (+/- 0.03)
 */
Tips:
/*
ModuleNotFoundError: No module named 'sklearn.cross_validation'
*/
解决方案:改为从 sklearn.model_selection
/*
import sklearn.model_selection as cv
 */
我们运行得到的R^2分数是0.94。不过,交叉验证得到的期望值是0.91,标准差是0.03(所以我们运行得到的结果在这个范围之内)。
我们测试只使用主成分的模型:
1 # estimate the model using Principal Components only
2 #只使用主成分估算模型
3 regressor_principal = regression_kNN(x_principal,y)
4
5 print('R^2: ', regressor_principal.score(x_principal,y))
得到的结果你也许会意外(特别是如果你学到的说法是R^2的取值范围在0到1之间):
/*
The method regression_kNN took 0.01 sec to run.
R^2:  0.4602300520714968
Expected R^2: -18.55 (+/- 14427.43)
 */
所以,我们运行得到的R^2分数是0.46。然而,期望值是负的(标准差极高)。
我们怎么会得到负值?考虑这个例子:我们有一组数据,差不多遵循这个关系y=x^2。现在,我们假设有些模型(只能估算线性关系)给我们一个遵循y_pred=3*x函数的预测。
这样的预测,R^2的值就在-0.4左右。如果你分析下R^2的计算过程,你就会明白某些情况下R^2的值会变成负的。
参考StackOverflow上这个回答:http://stats.stackexchange.com/questions/12900/when-is-r-squared-negative。
6.7将随机森林模型用于回归分析
类似于决策树,随机森林也可以用于解决回归问题。我们之前用它归类电话(参考本书3.7节)。这里,我们使用随机森林预测电厂的发电量。
准备:需装好pandas、NumPy和Scikit。
随机森林是一组模型。这个例子的代码来自第3章(regression_randomForest.py文件):
 1 import sys
 2 sys.path.append('..')
 3
 4 # the rest of the imports
 5 import helper as hlp
 6 import pandas as pd
 7 import numpy as np
 8 import sklearn.ensemble as en
 9 import sklearn.model_selection as cv
10
11 @hlp.timeit
12 def regression_rf(x,y):
13     '''
14         Estimate a random forest regressor
15         估算随机森林回归器
16     '''
17     # create the regressor object
18     random_forest = en.RandomForestRegressor(
19         min_samples_split=80, random_state=666,
20         max_depth=5, n_estimators=10)
21
22     # estimate the model
23     random_forest.fit(x,y)
24
25     # return the object
26     return random_forest
原理:按照惯例,我们读入数据并拆成自变量和因变量。后面会用于估算模型。
.RandomForestRegressor(...)方法创建了模型对象。和决策树一样,min_samples_split决定拆分时节点最少的样本数。random_state决定了模型的初始随机状态,max_depth决定了树最多能有多少层。最后一个参数n_estimators,告诉模型森林中估算多少树。
估算后,我们打印出R^2评分,测试它对输入的敏感度,以列表形式打印出变量及其重要性:
 1 # print out the results
 2 print('R^2: ', regressor_red.score(x_red,y))
 3
 4 # test the sensitivity of R2 测试r^2敏感度
 5 scores = cv.cross_val_score(regressor_red, x_red, y, cv=100)
 6 print('Expected R^2: {0:.2f} (+/- {1:.2f})'\
 7     .format(scores.mean(), scores.std()**2))
 8
 9 # print features importance
10 for counter, (nm, label) \
11     in enumerate(
12         zip(x_red.columns, regressor_red.feature_importances_)
13     ):
14     print("{0}. {1}: {2}".format(counter, nm,label))
Tips:
/*
Traceback (most recent call last):
  File "D:\Java2018\practicalDataAnalysis\Codes\Chapter06\regression_randomForest.py", line 79, in <module>
    x_red = csv_read[features[0]]

    KeyError: "None of [Int64Index([32], dtype='int64')] are in the [columns]"
*/
解决方案:
改为:x_red = csv_read.iloc[:,features[0]]
代码的结果如下(已简化):
/*

The method regression_rf took 0.06 sec to run.
R^2:  0.9704592485243615
Expected R^2: 0.82 (+/- 0.21)
0. fuel_aer_NG: 0.0
1. fuel_aer_DFO: 0.0
2. fuel_aer_HYC: 0.0
......
8. mover_CT: 0.0
9. mover_GT: 0.0
10. mover_HY: 0.0
11. mover_IC: 0.0
12. mover_PV: 0.0
13. mover_ST: 1.9909417055476134e-05
14. mover_WT: 0.0
15. state_CA: 0.0
16. state_TX: 0.0
......
28. state_OH: 0.0
29. state_GA: 0.0
30. state_WA: 0.0
31. total_fuel_cons: 0.0
32. total_fuel_cons_mmbtu: 0.9999800905829446
 */
又一次,我们(果然)看到total_fuel_cons_mmbtu起决定作用。mover_ST也出现了,但它的重要性几乎等于没有,所以我们可以移除它。
只用total_fuel_cons_mmbtu构建模型的结果如下:
/*
The method regression_rf took 0.03 sec to run.
R^2:  0.9704326205779759
Expected R^2: 0.81 (+/- 0.22)
0. total_fuel_cons_mmbtu: 1.0
 */
如你所见,R2和敏感度的差别可以忽略不计。
6.8使用SVM预测发电厂生产的电量
SVM(Support Vector Machine,支持向量机)已流行多年。模型使用多种核技巧,自变量和因变量之间最复杂的关系也可以建模。
本技巧中,使用人工生成的数据,我们展示SVM的威力。
准备:需装好pandas、NumPy、Scikit和Matplotlib。
本技巧中,我们用4种核测试用于回归的SVM(regression_svm.py文件):
 1 import sys
 2 sys.path.append('..')
 3
 4 # the rest of the imports
 5 import helper as hlp
 6 import pandas as pd
 7 import numpy as np
 8 import sklearn.svm as sv
 9 import matplotlib.pyplot as plt
10
11 @hlp.timeit
12 def regression_svm(x, y, **kw_params):
13     '''
14         Estimate a SVM regressor
15     '''
16     # create the regressor object
17     svm = sv.SVR(**kw_params)
18
19     # estimate the model
20     svm.fit(x,y)
21
22     # return the object
23     return svm
24
25 # simulated dataset
26 x = np.arange(-2, 2, 0.004)
27 errors = np.random.normal(0, 0.5, size=len(x))
28 y = 0.8 * x**4 - 2 * x**2 +  errors
29
30 # reshape the x array so its in a column form
31 x_reg = x.reshape(-1, 1)
32
33 models_to_test = [
34     {'kernel': 'linear'},
35     {'kernel': 'poly','gamma': 0.5, 'C': 0.5, 'degree': 4},
36     {'kernel': 'poly','gamma': 0.5, 'C': 0.5, 'degree': 6},
37     {'kernel': 'rbf','gamma': 0.5, 'C': 0.5}
38 ]
原理:首先,我们导入所有必需模块。然后,我们模拟数据。我们先用NumPy的.arange(...)方法生成x向量;数据集从-2到2,步长为0.004。然后引入一些误差:.random.normal(...)方法返回和x长度相等的样本数,x是从一个均值为0标准差为0.5的正态分布中取出的。我们的因变量这样指定:y=0.8x4-2x2+errors。
为了估算模型,我们要将x转为列的形式;我们使用.reshape(...)方法重塑x。
models_to_test列表包括了4个关键词参数,用于regression_svm(...)方法;我们估算一个线性核SVM,两个多项式核SVM(一个度数为4,一个度数为6),以及一个RBF核SVM。
regression_svm(...)方法和所有模型估算方法的逻辑一致:先创建模型对象,然后估算模型,最后返回估算的模型。
本技巧中,我们生成一个图表,以具象化模型的预测。
创建图,调整框:
1 # create chart frame
2 plt.figure(figsize=(len(models_to_test) * 2 + 3, 9.5))
3 plt.subplots_adjust(left=.05, right=.95,
4     bottom=.05, top=.96, wspace=.1, hspace=.15)
创建指定大小的图,调整子图:为每个子图调整left和right,bottom和top边距,以及子图间的空间,wspace和hspace。
现在遍历要构建的模型,加到图中:
 1 for i, model in enumerate(models_to_test):
 2     # estimate the model
 3     regressor = regression_svm(x_reg, y, **model)
 4
 5     # score
 6     score = regressor.score(x_reg, y)
 7
 8     # plot the chart
 9     plt.subplot(2, 2, i + 1)
10     if model['kernel'] == 'poly':
11         plt.title('Kernel: {0}, deg: {1}'\
12             .format(model['kernel'], model['degree']))
13     else:
14         plt.title('Kernel: {0}'.format(model['kernel']))
15     plt.ylim([-4, 8])
16     plt.scatter(x, y)
17     plt.plot(x, regressor.predict(x_reg), color='r')
18     plt.text(.9, .9, ('R^2: {0:.2f}'.format(score)),
19                  transform=plt.gca().transAxes, size=15,
20                  horizontalalignment='right')
先用regression_svm(...)方法估算模型。估算好后,计算R^2分值。
然后用.subplot(...)方法指定(2乘2的网格上)子图的位置,将当前的循环次数i加1;图表中,子图从1开始计数,而列表索引从0开始。如果是多项式核,图表的标题中应体现度数;否则给出核的名称就足够了。
然后,我们用原始数据x和y创建散布图。之后,我们用回归器的预测值绘图;为了醒目,我们使用红色。在各个子图中,y轴的范围保持在-4到8。
然后,我们在右上角放上R^2的值;指定坐标为(.9,.9)并使用转换可以做到这一点。字体设为15,右对齐。
最后保存到文件:
plt.savefig('../../data/Chapter06/charts/regression_svm.png',
    dpi= 300)
从得到的图中可以看出,RBF核对于高度非线性数据表现有多好。我们又一次看到了线性核的负的R2值。可以注意到,多项式核的表现也并没有足够好: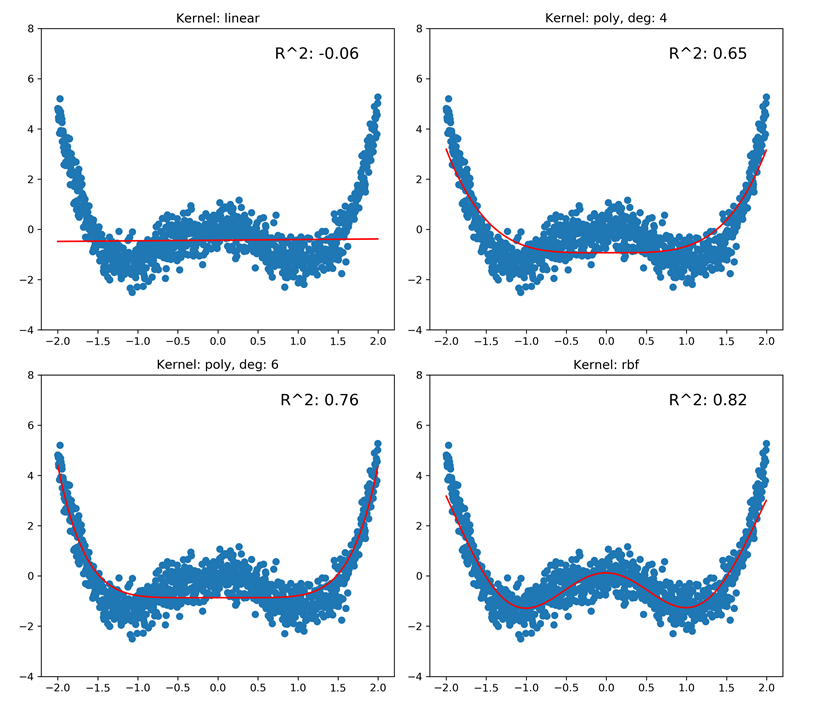
更多:使用RBF核估算SVM的主要难点在于决定为C(误差惩罚参数)和gamma(控制对特征向量差异的敏感度的RBF核参数)参数选择何值。
最后,我们可以使用格点搜索法,一个计算密集型的做法。不过,我们将使用Optunity,一个多种环境下各种优化器的库。
关于Optunity可以参考:http://optunity.readthedocs.org/en/latest/。
Anaconda不直接支持Optunity,我们需要自行安装。
独立安装 optunity
>pip install optunity
/*
Looking in indexes: https://pypi.tuna.tsinghua.edu.cn/simple
Collecting optunity
  Downloading https://pypi.tuna.tsinghua.edu.cn/packages/32/4d/d49876a49e105b56755eb5ba06a4848ee8010f7ff9e0f11a13aefed12063/Optunity-1.1.1.tar.gz (4.6MB)
.......
Successfully built optunity
Installing collected packages: optunity
Successfully installed optunity-1.1.1
FINISHED

 */
既然有了Optunity,我们来看看代码(regression_svm_alternative.py文件)。这里我跳过了各种引入;完整的引入列表可以查看文件:
 1 import optunity as opt
 2 import optunity.metrics as mt
 3
 4 # simulated dataset
 5 x = np.arange(-2, 2, 0.002)
 6 errors = np.random.normal(0, 0.5, size=len(x))
 7 y = 0.8 * x**4 - 2 * x**2 +  errors
 8
 9 # reshape the x array so its in a column form
10 x_reg = x.reshape(-1, 1)
11
12 @opt.cross_validated(x=x_reg, y=y, num_folds=10, num_iter=5)
13 def regression_svm(
14     x_train, y_train, x_test, y_test, logC, logGamma):
15     '''
16         Estimate a SVM regressor
17     '''
18     # create the regressor object
19     svm = sv.SVR(kernel='rbf',
20         C=0.1 * logC, gamma=0.1 * logGamma)
21
22     # estimate the model
23     svm.fit(x_train,y_train)
24
25     # decision function
26     decision_values = svm.decision_function(x_test)
27
28     # return the object
29     return mt.roc_auc(y_test, decision_values)
首先,类似前一个例子,我们创建模拟数据。
然后用一个Optunity中的方法装饰regression_svm(...)方法。.cross_validated(...)方法接受一系列参数:x是自变量,y是因变量。
num_folds是用于交叉验证的块数。我们将1/10的样本用于交叉验证,9/10用于训练。num_iter是交叉验证的循环次数。
注意regression_svm(...)方法的定义变了。cross_validated(...)方法先注入训练的x和y样本,然后是测试的x和y,以及指定的其他参数:我们的例子中,logC和logGamma。对于后两个参数我们要为其寻找最优值。
方法从估算模型开始:先用指定的参数创建模型,应用数据。decision_function(...)方法返回一个列表,放的是x中元素到超平面的距离。我们返回的是在ROC曲线之下的区域。(ROC参考本书3.2节)
使用Optunity提供的maximize(...)方法找到C和gamma的最佳值。第一个参数是我们要最大化的函数,即regression_svm(...)。num_evals指定了允许的函数评估的次数。最后两个指定了logC和logGamma搜索空间的边界。
优化之后,我们就可以用找到的值估算最终的模型并保存图片:
 1 # and the values are...
 2 print('The optimal values are: C - {0:.2f}, gamma - {1:.2f}'\
 3     .format(0.1 * hps['logC'], 0.1 * hps['logGamma']))
 4
 5 # estimate the model with optimal values
 6 regressor = sv.SVR(kernel='rbf',
 7             C=0.1 * hps['logC'],
 8             gamma=0.1 * hps['logGamma'])\
 9         .fit(x_reg, y)
10
11 # predict the output
12 predicted = regressor.predict(x_reg)
13
14 # and calculate the R^2
15 score = hlp.get_score(y, predicted)
16 print('R2: ', score)
17
18 # plot the chart
19 plt.scatter(x, y)
20 plt.plot(x, predicted, color='r')
21 plt.title('Kernel: RBF')
22 plt.ylim([-4, 8])
23 plt.text(.9, .9, ('R^2: {0:.2f}'.format(score)),
24              transform=plt.gca().transAxes, size=15,
25              horizontalalignment='right')
26
27 plt.savefig(
28     '../../data/Chapter06/charts/regression_svm_alt.png',
29     dpi=300
30 )
大部分代码之前已经解释过了,这里不再重复。
得到的值应该是这样:
/*
D:\tools\Python37\lib\site-packages\optunity\metrics.py:204: RuntimeWarning: invalid value encountered in true_divide
  return float(TP) / (TP + FN)
...
D:\tools\Python37\lib\site-packages\optunity\metrics.py:204: RuntimeWarning: invalid value encountered in true_divide
  return float(TP) / (TP + FN)
The optimal values are: C - 0.38, gamma - 1.44
R^2:  0.8662968996734814

 */
和前一个例子相比,R^2值上升了;现在回归更匹配数据了: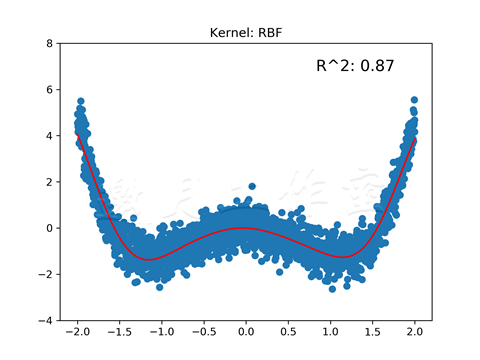
参考:强烈推荐熟悉一下Optunity:http://optunity.readthedocs.org/en/latest/。
6.9训练神经网络,预测发电厂生产的电量
神经网络是强有力的回归器,可以应用到任何数据上。然而,本例中,我们已经知道数据遵循线性关系了,所以就使用一个简单的模型来应用数据。
准备:需装好pandas和PyBrain。
类似第3章中的方式,我们指定fitANN(...)方法(regression_ann.py文件)。有些引入语句已略去:
 1 import sys
 2 sys.path.append('..')
 3
 4 # the rest of the imports
 5 import helper as hlp
 6 import pandas as pd
 7 import pybrain.structure as st
 8 import pybrain.supervised.trainers as tr
 9 import pybrain.tools.shortcuts as pb
10
11 @hlp.timeit
12 def fitANN(data):
13     '''
14         Build a neural network regressor
15     '''
16     # determine the number of inputs and outputs
17     inputs_cnt = data['input'].shape[1]
18     target_cnt = data['target'].shape[1]
19
20     # create the regressor object
21     ann = pb.buildNetwork(inputs_cnt,
22         inputs_cnt * 3,
23         target_cnt,
24         hiddenclass=st.TanhLayer,
25         outclass=st.LinearLayer,
26         bias=True
27     )
28
29     # create the trainer object
30     trainer = tr.BackpropTrainer(ann, data,
31         verbose=True, batchlearning=False)
32
33     # and train the network
34     trainer.trainUntilConvergence(maxEpochs=50, verbose=True,
35         continueEpochs=2, validationProportion=0.25)
36
37     # and return the regressor
38     return ann
原理:我们先读入数据,拆分数据,并创建ANN训练数据:
 1 # split the data into training and testing
 2 train_x, train_y, \
 3 test_x,  test_y, \
 4 labels = hlp.split_data(csv_read,
 5     y='net_generation_MWh', x=['total_fuel_cons_mmbtu'])
 6
 7 # create the ANN training and testing datasets
 8 training = hlp.prepareANNDataset((train_x, train_y),
 9     prob='regression')
10 testing  = hlp.prepareANNDataset((test_x, test_y),
11     prob='regression')
自变量只使用total_fuel_cons_mmbtu。注意.prepareANNDataset(...)方法使用了新参数。
prob(代表problem,问题)指定了要用数据集解决一个回归问题:对于分类问题,我们需要有类别指标及其到1的补充abs(item-1),参考本书3.8节。
现在可以应用模型了:
1 # train the model
2 regressor = fitANN(training)
3
4 # predict the output from the unseen data
5 predicted = regressor.activateOnDataset(testing)
6
7 # and calculate the R^2
8 score = hlp.get_score(test_y, predicted[:, 0])
9 print('R^2: ', score)
fitANN(...)方法先创建神经网络。我们的神经网络有一个输入神经元,三个(带tanh激活函数的)隐藏层神经元,一个(带线性激活函数的)输出神经元。
和第3章一样使用在线训练(batchlearning=False)。我们指定maxEpochs为50,即使到时候网络没有达到最小的误差,我们也终止训练。我们将四分之一的数据用于验证。
训练之后,我们通过预测发电量来测试网络,计算R^2:
/*
The method fitANN took 68.70 sec to run.
R^2:  0.9843443717345242
*/
可以看出,我们神经网络的表现不输其他模型。
参考
Tips:
/* Traceback (most recent call last):
  File "D:\Java2018\practicalDataAnalysis\Codes\Chapter06\regression_ann.py", line 8, in <module>
    import pybrain.structure as st
  File "D:\tools\Python37\lib\site-packages\pybrain\__init__.py", line 1, in <module>
    from structure.__init__ import *
ModuleNotFoundError: No module named 'structure'
 */
解决方案(均失败):
/*
pip install git+https://github.com/pybrain/pybrain.git
This seems to be an issue with the library when used from Python 3 and installed using pip. The latest version listed is 0.3.3, but I'm still getting v0.3.0 when installing.

Try installing numpy and scipy in Anaconda, then (after activating the conda environment) install directly from the git repo:

pip install git+https://github.com/pybrain/pybrain.git@0.3.3


尝试方法1:pip install git+https://github.com/pybrain/pybrain.git@0.3.3

  Running command git clone -q https://github.com/pybrain/pybrain.git 'd:\Temp\pip-req-build-0soc1yjx'
Looking in indexes: https://pypi.tuna.tsinghua.edu.cn/simple
Collecting git+https://github.com/pybrain/pybrain.git@0.3.3
  Cloning https://github.com/pybrain/pybrain.git (to revision 0.3.3) to d:\temp\pip-req-build-0soc1yjx
  Running command git checkout -q 882cf66a89b6b6bb8112f41d200c55461464aa06
Requirement already satisfied: scipy in d:\tools\python37\lib\site-packages (from PyBrain==0.3.1) (1.3.3)
Requirement already satisfied: numpy>=1.13.3 in d:\tools\python37\lib\site-packages (from scipy->PyBrain==0.3.1) (1.17.4)
Building wheels for collected packages: PyBrain
  Building wheel for PyBrain (setup.py): started
  Building wheel for PyBrain (setup.py): finished with status 'done'
  Created wheel for PyBrain: filename=PyBrain-0.3.1-cp37-none-any.whl size=472111 sha256=07f80767b5065f40565e595826df759d2dc66740d3fb6db709d7343cbdc2a8c0
  Stored in directory: d:\Temp\pip-ephem-wheel-cache-h4bvm49q\wheels\a3\1c\d1\9cfc0e65ef0ed5559fd4f2819e4423e9fa4cfe02ff3a5c3b3e
Successfully built PyBrain
Installing collected packages: PyBrain
  Found existing installation: PyBrain 0.3
    Uninstalling PyBrain-0.3:
      Successfully uninstalled PyBrain-0.3
Successfully installed PyBrain-0.3.1
FINISHED

尝试方法2:
D:\tools\Python37\Scripts>pip3  install https://github.com/pybrain/pybrain/archive/0.3.3.zip
Looking in indexes: https://pypi.tuna.tsinghua.edu.cn/simple
Collecting https://github.com/pybrain/pybrain/archive/0.3.3.zip
  Downloading https://github.com/pybrain/pybrain/archive/0.3.3.zip
     / 1.9MB 163kB/s
Requirement already satisfied: scipy in d:\tools\python37\lib\site-packages (from PyBrain==0.3.1) (1.3.3)
Requirement already satisfied: numpy>=1.13.3 in d:\tools\python37\lib\site-packages (from scipy->PyBrain==0.3.1) (1.17.4)
Building wheels for collected packages: PyBrain
  Building wheel for PyBrain (setup.py) ... done
  Created wheel for PyBrain: filename=PyBrain-0.3.1-cp37-none-any.whl size=468236 sha256=ce9591da503451919d71cd322324930d3d2259c7fdbe7c3041a8309bcf1ff9b2
  Stored in directory: d:\Temp\pip-ephem-wheel-cache-ouwcf150\wheels\0b\04\38\2f174aa3c578350870947ca6ab12e0eb89aef3478c9610eb0a
Successfully built PyBrain
Installing collected packages: PyBrain
Successfully installed PyBrain-0.3.1

D:\tools\Python37\Scripts>


*/
最终反复检查:
pip install https://github.com/pybrain/pybrain/archive/0.3.3.zip
安装0.3.3,其实还是0.3.1
/*
 File "D:\tools\Python37\lib\site-packages\pybrain\tools\functions.py", line 4, in <module>
    from scipy.linalg import inv, det, svd, logm, expm2
ImportError: cannot import name 'expm2' from 'scipy.linalg' (D:\tools\Python37\lib\site-packages\scipy\linalg\__init__.py)
 */
解决方案补充:
根据提示错误是“D:\tools\Python37\lib\site-packages\pybrain\tools\functions.py”文件中的import scipy.linalg import inv, det, svd, logm, expm2出错,查找到一些英文资料说明SciPy中expm2和expm3鲁棒性很差,官方建议不再使用这两个,而是使用expm,因此,在前的所提到的路径中找到functions.py文件,找到语句“from scipy.linalg import inv, det, svd, logm, expm2”,将expm2更改成expm,保存,退出,再次尝试,引用成功。
/* Total error:  0.0234644034879
Total error:  0.00448033176755
Total error:  0.00205475261566
Total error:  0.000943766244883
Total error:  0.000441922091808
Total error:  0.00023137206216
Total error:  0.00014716265305
Total error:  0.000113546124273
Total error:  0.000100591874178
Total error:  9.48731641822e-05
Total error:  9.17187548879e-05
Total error:  9.00545474786e-05
Total error:  8.8754314954e-05
Total error:  8.78622211966e-05
Total error:  8.64148298491e-05
Total error:  8.52580031627e-05
Total error:  8.45496751335e-05
Total error:  8.31773350186e-05
Total error:  8.22848381841e-05
Total error:  8.13736136075e-05
Total error:  8.01448506931e-05
Total error:  7.91777696701e-05
Total error:  7.82493713543e-05
Total error:  7.75330633562e-05
Total error:  7.63823501292e-05
Total error:  7.55286037883e-05
Total error:  7.44680561538e-05
Total error:  7.36680418929e-05
Total error:  7.27012120487e-05
Total error:  7.18980979088e-05
Total error:  7.09005144214e-05
Total error:  6.99157006989e-05
Total error:  6.9222957236e-05
Total error:  6.82360145737e-05
Total error:  6.71353795523e-05
Total error:  6.63631396761e-05
Total error:  6.56685823709e-05
Total error:  6.53158010387e-05
Total error:  6.4518956904e-05
Total error:  6.35146379129e-05
Total error:  6.28304190101e-05
Total error:  6.22125569291e-05
Total error:  6.13769678787e-05
Total error:  6.09232354752e-05
Total error:  6.0155987076e-05
Total error:  5.94907225251e-05
Total error:  5.88562745717e-05
Total error:  5.80850744217e-05
Total error:  5.75905974532e-05
Total error:  5.65098746457e-05
Total error:  5.60159718614e-05
('train-errors:', '[0.023464 , 0.00448  , 0.002055 , 0.000944 , 0.000442 , 0.000231 , 0.000147 , 0.000114 , 0.000101 , 9.5e-05  , 9.2e-05  , 9e-05    , 8.9e-05  , 8.8e-05  , 8.6e-05  , 8.5e-05  , 8.5e-05  , 8.3e-05  , 8.2e-05  , 8.1e-05  , 8e-05    , 7.9e-05  , 7.8e-05  , 7.8e-05  , 7.6e-05  , 7.6e-05  , 7.4e-05  , 7.4e-05  , 7.3e-05  , 7.2e-05  , 7.1e-05  , 7e-05    , 6.9e-05  , 6.8e-05  , 6.7e-05  , 6.6e-05  , 6.6e-05  , 6.5e-05  , 6.5e-05  , 6.4e-05  , 6.3e-05  , 6.2e-05  , 6.1e-05  , 6.1e-05  , 6e-05    , 5.9e-05  , 5.9e-05  , 5.8e-05  , 5.8e-05  , 5.7e-05  , 5.6e-05  ]')
('valid-errors:', '[2.98916  , 0.006323 , 0.003087 , 0.001464 , 0.000735 , 0.00041  , 0.000263 , 0.000197 , 0.000168 , 0.000154 , 0.000147 , 0.000144 , 0.00014  , 0.000143 , 0.000136 , 0.000132 , 0.000131 , 0.000131 , 0.000136 , 0.000127 , 0.000126 , 0.000124 , 0.000124 , 0.000122 , 0.000123 , 0.000121 , 0.00012  , 0.000117 , 0.000116 , 0.000118 , 0.000114 , 0.000113 , 0.000112 , 0.000117 , 0.00011  , 0.000108 , 0.000107 , 0.000107 , 0.000105 , 0.000105 , 0.000105 , 0.000103 , 0.000101 , 0.000102 , 0.000103 , 9.8e-05  , 9.7e-05  , 9.6e-05  , 9.5e-05  , 9.6e-05  , 9.7e-05  , 9.4e-05  ]')
The method fitANN took 68.70 sec to run.
R^2:  0.9843443717345242
 */
查看使用PyBrain训练神经网络的例子:http://fastml.com/pybrain-a-simple-neural-networks-library-in-python/。
第6章完。
杭州这个季节的窗外细雨打在窗上,感觉有点阴冷。东方既白,还要早起找警察叔叔。

 托马兹·卓巴斯的《数据分析实战》,2018年6月出版,本系列为读书笔记。主要是为了系统整理,加深记忆。 第6章涵盖了许多回归模型,有线性的,也有非线性的。我们还会复习随机森林和支持向量机,它们可用来解决分类或回归问题。

 浙公网安备 33010602011771号