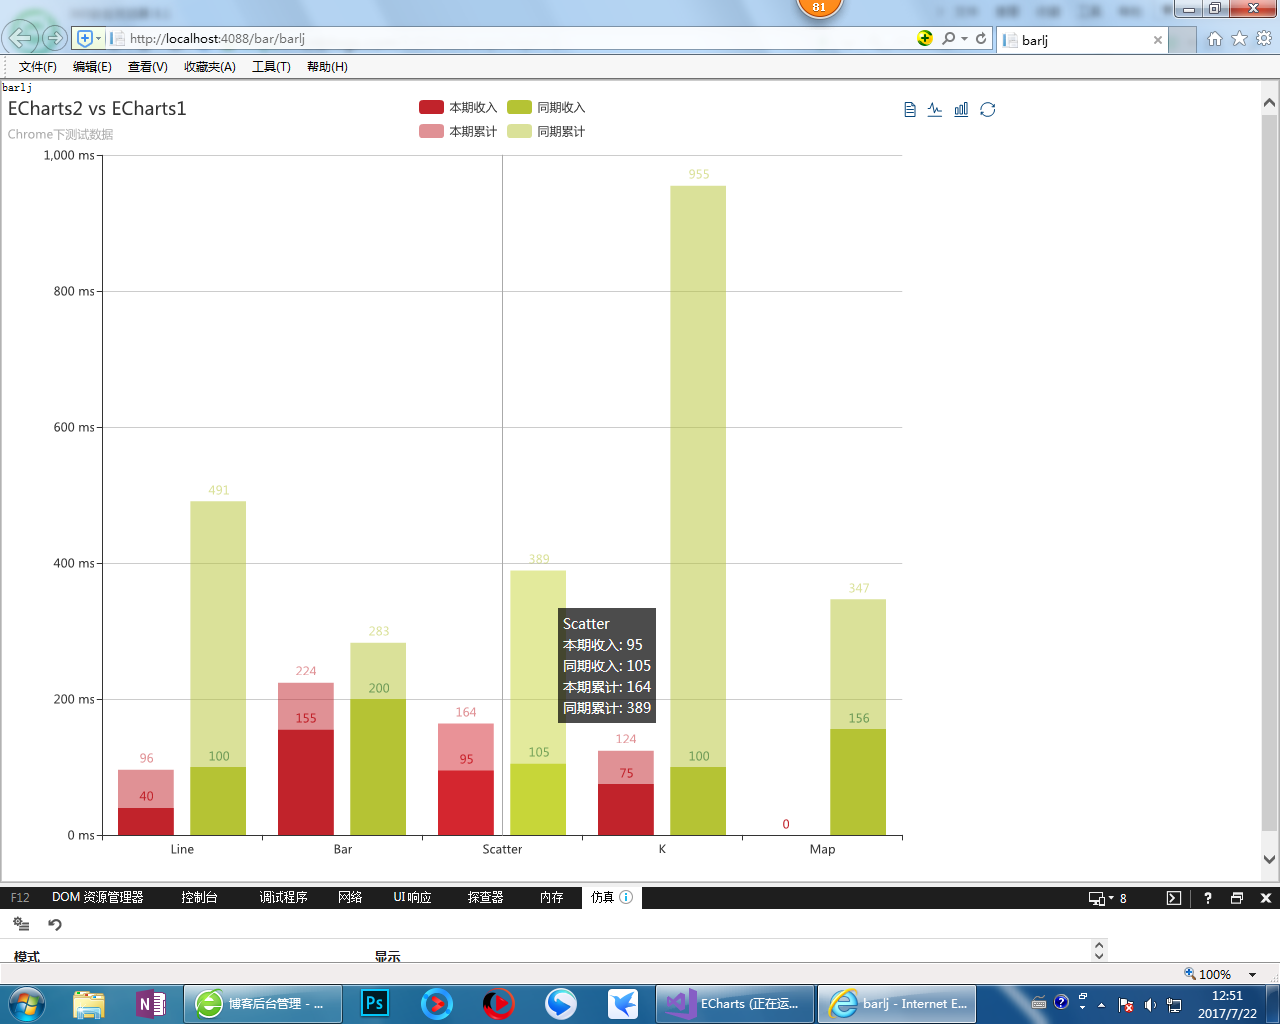
echarts3.0 本期累计堆叠
@{
    ViewBag.Title = "barlj";
}

<h2>barlj</h2>

<div id="main" style="width: 1000px;height:800px;"></div>
<script type="text/javascript">
    // 基于准备好的dom,初始化echarts实例
    var myChart = echarts.init(document.getElementById('main'), 'shine', { width: 800 });

    option = {
        title: {
            text: 'ECharts2 vs ECharts1',
            subtext: 'Chrome下测试数据'
        },
        tooltip: {
            trigger: 'axis',
            formatter: function (params) {
                var s = '';
                s += params[0].name + '<br />';
                var l = params.length;
                for (var i = 0; i < l; i++) {
                    s += params[i].seriesName + ': ' + params[i].value + '<br />';
                }
                return s;
            }
        },
        legend: {
            //中间空字符为换行???
            data: ['本期收入', '同期收入', '', '本期累计', '同期累计'],
            selected: {
                '本期收入': true,
                '同期收入': true,
                '本期累计': true,
                '同期累计': true

            }
        },
        toolbox: {
            show: true,
            feature: {
                mark: { show: true },
                dataView: { show: true, readOnly: false },
                magicType: { show: true, type: ['line', 'bar'] },
                restore: { show: true },
                saveAsImage: { show: true }
            }
        },
        //拖动项,3.0不支持
        calculable: true,
        //grid: { y: 70, y2: 30, x2: 20 },
        xAxis: [
            {
                type: 'category',
                data: ['Line', 'Bar', 'Scatter', 'K', 'Map']
            },
            {
                type: 'category',
                axisLine: { show: false },
                axisTick: { show: false },
                axisLabel: { show: false },
                splitArea: { show: false },
                splitLine: { show: false },
                data: ['Line', 'Bar', 'Scatter', 'K', 'Map']
            }
        ],
        yAxis: [
            {
                type: 'value',
                axisLabel: { formatter: '{value} ms' }
            }
        ],
        series: [
            {
                name: '本期收入',
                type: 'bar',
                itemStyle: { normal: { color: 'rgba(193,35,43,1)', label: { show: true, position: 'top' } } },
                data: [40, 155, 95, 75, 0]
            },
            {
                name: '同期收入',
                type: 'bar',
                itemStyle: { normal: { color: 'rgba(181,195,52,1)', label: { show: true, position: 'top', textStyle: { color: '#27727B' } } } },
                data: [100, 200, 105, 100, 156]
            },
            {
                name: '本期累计',
                type: 'bar',
                xAxisIndex: 1,
                itemStyle: { normal: { color: 'rgba(193,35,43,0.5)', label: { show: true, position: 'top', formatter: function (p) { return p.value > 0 ? (p.value /*+ '\n'*/) : ''; } } } },
                data: [96, 224, 164, 124, 0]
            },
            {
                name: '同期累计',
                type: 'bar',
                xAxisIndex: 1,
                itemStyle: { normal: { color: 'rgba(181,195,52,0.5)', label: { show: true, position: 'top' } } },
                data: [491, 283, 389, 955, 347]
            }
        ]
    };

    myChart.on('legendselectchanged', function (params) {
        if (params.name == '本期收入') {
            if (params.selected['本期收入']) {
                option.legend.selected['本期收入'] = true;
                option.legend.selected['同期收入'] = true;
            }
            else {
                option.legend.selected['本期收入'] = false;
                option.legend.selected['同期收入'] = false;
            }
        }
        if (params.name == '同期收入') {
            if (params.selected['同期收入']) {
                option.legend.selected['本期收入'] = true;
                option.legend.selected['同期收入'] = true;
            }
            else {
                option.legend.selected['本期收入'] = false;
                option.legend.selected['同期收入'] = false;
            }
        }
        if (params.name == '本期累计') {
            if (params.selected['本期累计']) {
                option.legend.selected['本期累计'] = true;
                option.legend.selected['同期累计'] = true;
            }
            else {
                option.legend.selected['本期累计'] = false;
                option.legend.selected['同期累计'] = false;
            }
        }
        if (params.name == '同期累计') {
            if (params.selected['同期累计']) {
                option.legend.selected['本期累计'] = true;
                option.legend.selected['同期累计'] = true;
            }
            else {
                option.legend.selected['本期累计'] = false;
                option.legend.selected['同期累计'] = false;
            }
        }

        myChart.setOption(option);
    });
    myChart.setOption(option);


</script>
路过的感觉对你有用的帮忙配下色 :)

 浙公网安备 33010602011771号