案例1
<!--
此示例下载自 https://echarts.apache.org/examples/zh/editor.html?c=radar
-->
<!DOCTYPE html>
<html lang="en" style="height: 100%">
<head>
<meta charset="utf-8">
</head>
<body style="height: 100%; margin: 0">
<div id="container" style="width: 600px;height: 400px"></div>
<script type="text/javascript" src="https://registry.npmmirror.com/echarts/5.5.0/files/dist/echarts.min.js"></script>
<!-- Uncomment this line if you want to dataTool extension
<script type="text/javascript" src="https://registry.npmmirror.com/echarts/5.5.0/files/dist/extension/dataTool.min.js"></script>
-->
<!-- Uncomment this line if you want to use gl extension
<script type="text/javascript" src="https://registry.npmmirror.com/echarts-gl/2/files/dist/echarts-gl.min.js"></script>
-->
<!-- Uncomment this line if you want to echarts-stat extension
<script type="text/javascript" src="https://registry.npmmirror.com/echarts-stat/latest/files/dist/ecStat.min.js"></script>
-->
<!-- Uncomment this line if you want to use map
<script type="text/javascript" src="https://registry.npmmirror.com/echarts/4.9.0/files/map/js/china.js"></script>
<script type="text/javascript" src="https://registry.npmmirror.com/echarts/4.9.0/files/map/js/world.js"></script>
-->
<!-- Uncomment these two lines if you want to use bmap extension
<script type="text/javascript" src="https://api.map.baidu.com/api?v=3.0&ak=YOUR_API_KEY"></script>
<script type="text/javascript" src="https://registry.npmmirror.com/echarts/5.5.0/files/dist/extension/bmap.min.js"></script>
-->
<script type="text/javascript">
var dom = document.getElementById('container');
var myChart = echarts.init(dom, null, {
renderer: 'canvas',
useDirtyRect: false
});
var app = {};
var option;
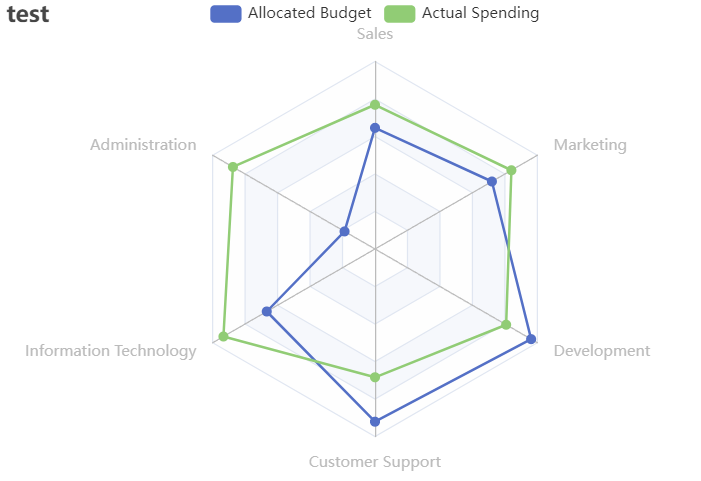
option = {
title: {
text: 'test'
},
legend: {
data: ['Allocated Budget', 'Actual Spending']
},
radar: {
// shape: 'circle',
indicator: [
{ name: 'Sales', max: 6500 },
{ name: 'Administration', max: 16000 },
{ name: 'Information Technology', max: 30000 },
{ name: 'Customer Support', max: 38000 },
{ name: 'Development', max: 52000 },
{ name: 'Marketing', max: 25000 }
]
},
series: [
{
name: 'Budget vs spending',
type: 'radar',
data: [
{
value: [4200, 3000, 20000, 35000, 50000, 18000],
name: 'Allocated Budget'
},
{
value: [5000, 14000, 28000, 26000, 42000, 21000],
name: 'Actual Spending'
}
]
}
]
};
if (option && typeof option === 'object') {
myChart.setOption(option);
}
window.addEventListener('resize', myChart.resize);
</script>
</body>
</html>
- 效果图
案例2
<!--
此示例下载自 https://echarts.apache.org/examples/zh/editor.html?c=radar-custom
-->
<!DOCTYPE html>
<html lang="en" style="height: 100%">
<head>
<meta charset="utf-8">
</head>
<body style="height: 100%; margin: 0">
<div id="container" style="width: 900px;height: 350px"></div>
<script type="text/javascript" src="https://registry.npmmirror.com/echarts/5.5.0/files/dist/echarts.min.js"></script>
<!-- Uncomment this line if you want to dataTool extension
<script type="text/javascript" src="https://registry.npmmirror.com/echarts/5.5.0/files/dist/extension/dataTool.min.js"></script>
-->
<!-- Uncomment this line if you want to use gl extension
<script type="text/javascript" src="https://registry.npmmirror.com/echarts-gl/2/files/dist/echarts-gl.min.js"></script>
-->
<!-- Uncomment this line if you want to echarts-stat extension
<script type="text/javascript" src="https://registry.npmmirror.com/echarts-stat/latest/files/dist/ecStat.min.js"></script>
-->
<!-- Uncomment this line if you want to use map
<script type="text/javascript" src="https://registry.npmmirror.com/echarts/4.9.0/files/map/js/china.js"></script>
<script type="text/javascript" src="https://registry.npmmirror.com/echarts/4.9.0/files/map/js/world.js"></script>
-->
<!-- Uncomment these two lines if you want to use bmap extension
<script type="text/javascript" src="https://api.map.baidu.com/api?v=3.0&ak=YOUR_API_KEY"></script>
<script type="text/javascript" src="https://registry.npmmirror.com/echarts/5.5.0/files/dist/extension/bmap.min.js"></script>
-->
<script type="text/javascript">
var dom = document.getElementById('container');
var myChart = echarts.init(dom, null, {
renderer: 'canvas',
useDirtyRect: false
});
var app = {};
var option;
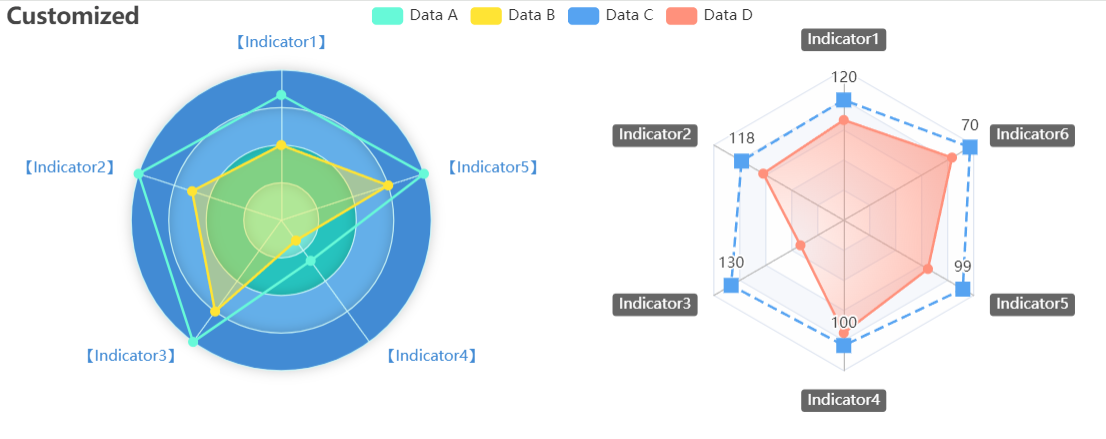
option = {
color: ['#67F9D8', '#FFE434', '#56A3F1', '#FF917C'],
title: {
text: 'Customized'
},
legend: {},
radar: [
{
indicator: [
{ text: 'Indicator1' },
{ text: 'Indicator2' },
{ text: 'Indicator3' },
{ text: 'Indicator4' },
{ text: 'Indicator5' }
],
center: ['25%', '50%'],
radius: 120,
startAngle: 90,
splitNumber: 4,
shape: 'circle',
axisName: {
formatter: '【{value}】',
color: '#428BD4'
},
splitArea: {
areaStyle: {
color: ['#77EADF', '#26C3BE', '#64AFE9', '#428BD4'],
shadowColor: 'rgba(0, 0, 0, 0.2)',
shadowBlur: 10
}
},
axisLine: {
lineStyle: {
color: 'rgba(211, 253, 250, 0.8)'
}
},
splitLine: {
lineStyle: {
color: 'rgba(211, 253, 250, 0.8)'
}
}
},
{
indicator: [
{ text: 'Indicator1', max: 150 },
{ text: 'Indicator2', max: 150 },
{ text: 'Indicator3', max: 150 },
{ text: 'Indicator4', max: 120 },
{ text: 'Indicator5', max: 108 },
{ text: 'Indicator6', max: 72 }
],
center: ['75%', '50%'],
radius: 120,
axisName: {
color: '#fff',
backgroundColor: '#666',
borderRadius: 3,
padding: [3, 5]
}
}
],
series: [
{
type: 'radar',
emphasis: {
lineStyle: {
width: 4
}
},
data: [
{
value: [100, 8, 0.4, -80, 2000],
name: 'Data A'
},
{
value: [60, 5, 0.3, -100, 1500],
name: 'Data B',
areaStyle: {
color: 'rgba(255, 228, 52, 0.6)'
}
}
]
},
{
type: 'radar',
radarIndex: 1,
data: [
{
value: [120, 118, 130, 100, 99, 70],
name: 'Data C',
symbol: 'rect',
symbolSize: 12,
lineStyle: {
type: 'dashed'
},
label: {
show: true,
formatter: function (params) {
return params.value;
}
}
},
{
value: [100, 93, 50, 90, 70, 60],
name: 'Data D',
areaStyle: {
color: new echarts.graphic.RadialGradient(0.1, 0.6, 1, [
{
color: 'rgba(255, 145, 124, 0.1)',
offset: 0
},
{
color: 'rgba(255, 145, 124, 0.9)',
offset: 1
}
])
}
}
]
}
]
};
if (option && typeof option === 'object') {
myChart.setOption(option);
}
window.addEventListener('resize', myChart.resize);
</script>
</body>
</html>
- 效果图

 浙公网安备 33010602011771号