phpstorm + Xdebug 调试
有问题,看官方文档:
xdebug各系统安装(windows,linux,mac)说明:
https://xdebug.org/docs/install
xdebug安装向导:
phpstorm安装xdebug官方说明:
https://www.jetbrains.com/help/phpstorm/2019.3/configuring-xdebug.html?
我的配置过程如下:
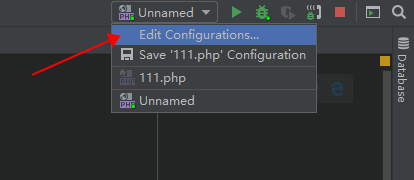
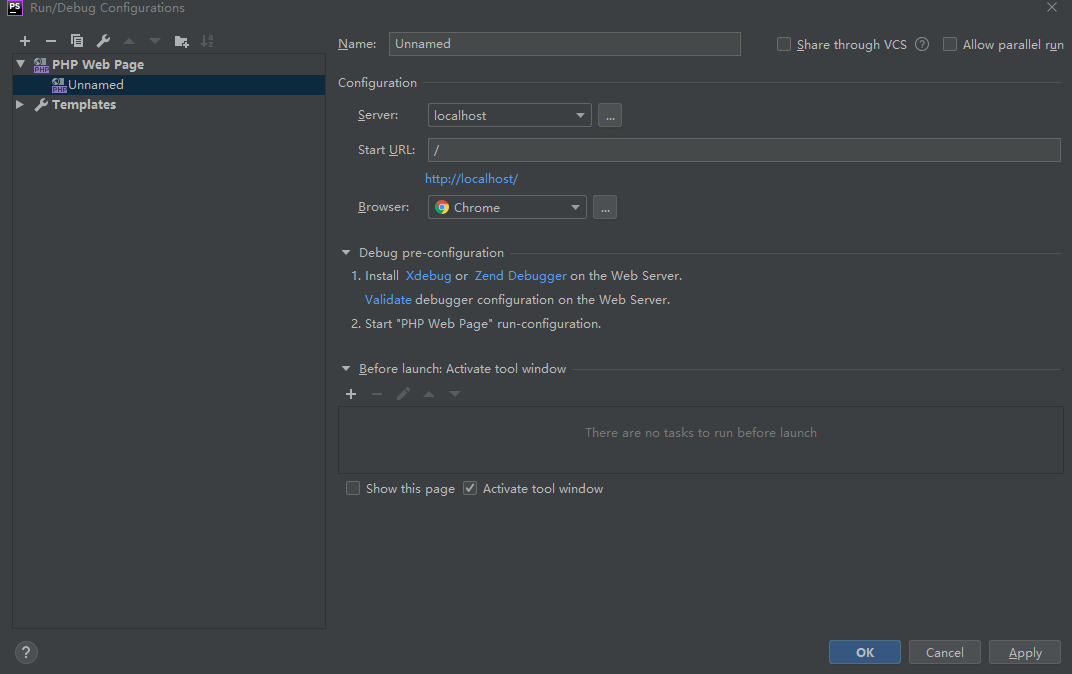
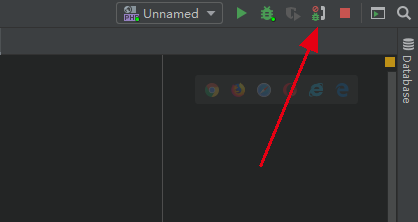
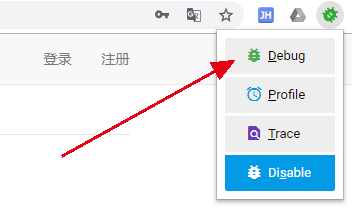
点击启用调试:

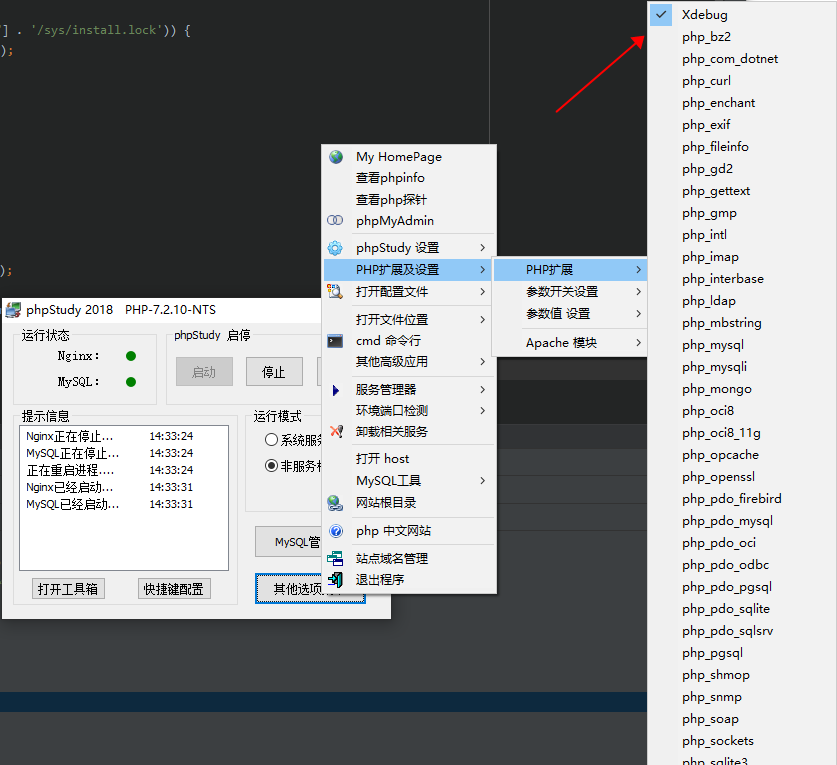
钩上,打开php.ini
下载php对应版本xdebug.dll,配置php.ini:
访问本地:http://localhost/phpinfo.php 复制页面粘贴到:https://xdebug.org/wizard
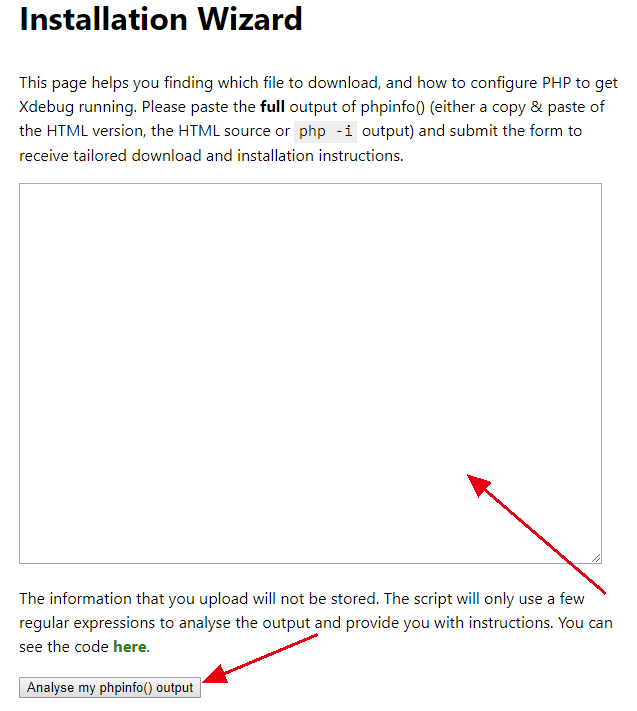
得到:
Summary
Xdebug installed: no
Server API: CGI/FastCGI
Windows: yes - Compiler: MS VC 15 - Architecture: x86
Zend Server: no
PHP Version: 7.2.1
Zend API nr: 320170718
PHP API nr: 20170718
Debug Build: no
Thread Safe Build: no
OPcache Loaded: no
Configuration File Path: C:\WINDOWS
Configuration File: D:\phpStudy\PHPTutorial\php\php-7.2.1-nts\php.ini
Extensions directory: D:\phpStudy\PHPTutorial\php\php-7.2.1-nts\ext
Instructions
Download php_xdebug-2.9.0-7.2-vc15-nts.dll
Move the downloaded file to D:\phpStudy\PHPTutorial\php\php-7.2.1-nts\ext
Edit D:\phpStudy\PHPTutorial\php\php-7.2.1-nts\php.ini C:\WINDOWS\php.ini and add the line
zend_extension = D:\phpStudy\PHPTutorial\php\php-7.2.1-nts\ext\php_xdebug-2.9.0-7.2-vc15-nts.dll
Restart the webserver
安装说明修改php.ini配置文件,修改后如下:
[XDebug]
xdebug.profiler_output_dir="D:\phpStudy\PHPTutorial\tmp\xdebug"
xdebug.trace_output_dir="D:\phpStudy\PHPTutorial\tmp\xdebug"
; zend_extension="D:\phpStudy\PHPTutorial\php\php-7.2.1-nts\ext\php_xdebug-2.9.0-7.2-vc15-nts.dll"
[xdebug]
zend_extension="D:\phpStudy\PHPTutorial\php\php-7.2.1-nts\ext\php_xdebug-2.9.0-7.2-vc15-nts.dll"
xdebug.remote_enable=1
xdebug.idekey='PHPSTORM'
xdebug.remote_port="9001"
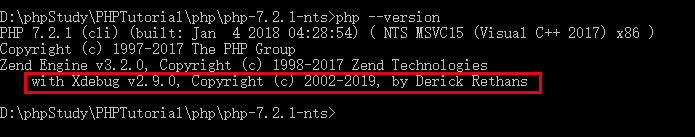
查看是否已安装
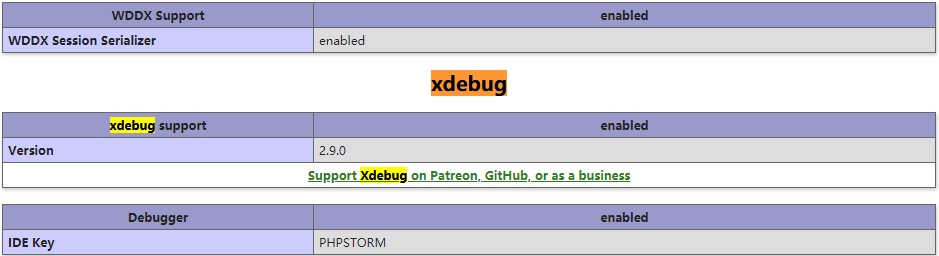
重启服务,查看phpinfo.php文件
安装xdebug help插件:
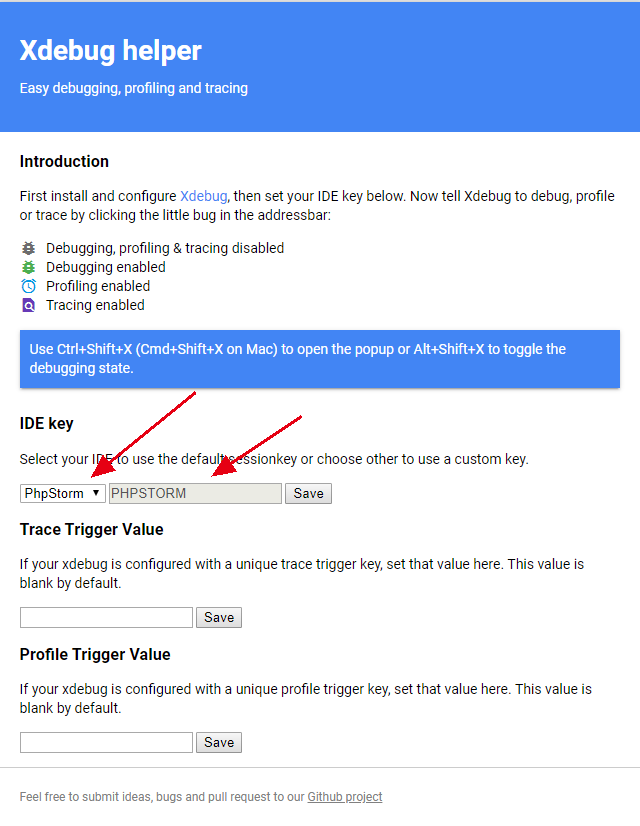
在调试页面启动插件Xdebug-help,Use Ctrl+Shift+X (Cmd+Shift+X on Mac) to open the popup or Alt+Shift+X to toggle the debugging state.
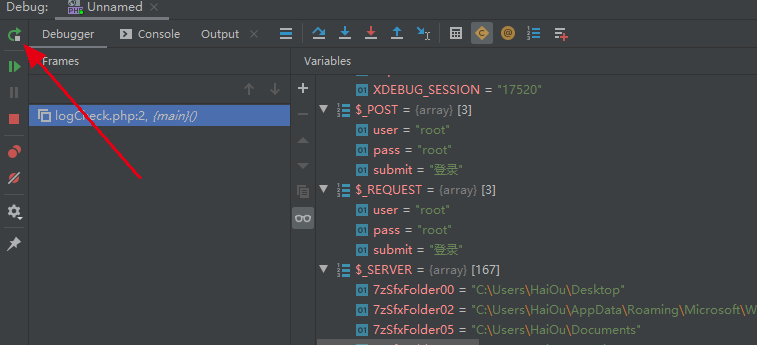
重新访问需要调试的页面,打断点成功:
xdebug各系统安装(linux,mac)说明:
https://xdebug.org/docs/install
xdebug安装向导:
phpstorm安装xdebug官方说明:
-
Open the active php.ini file in the editor:
-
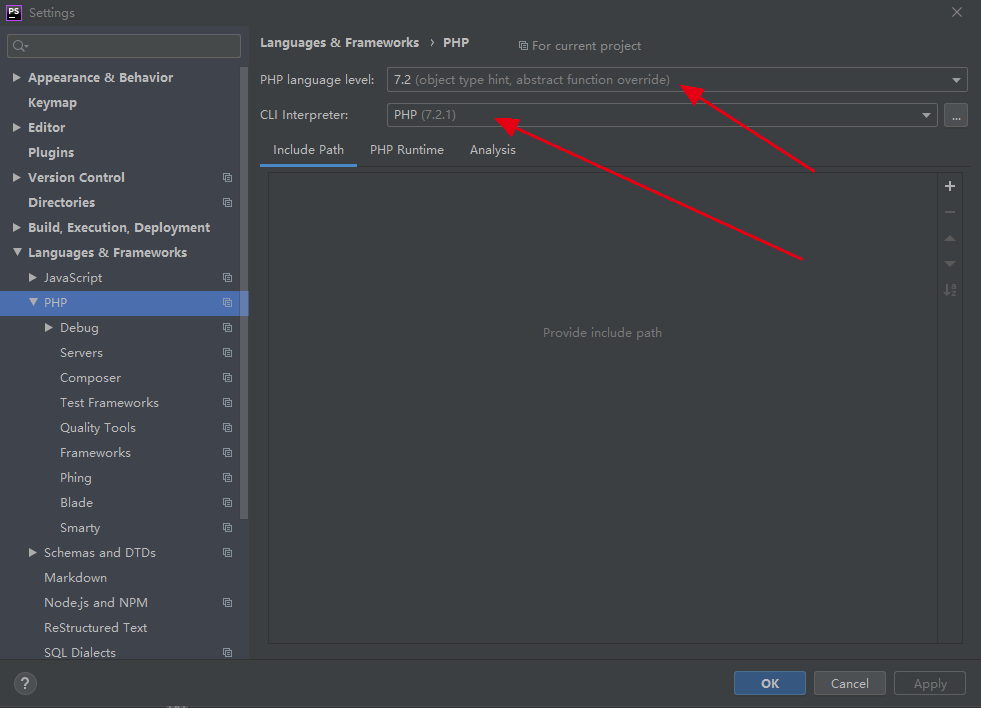
In the Settings/Preferences dialog Ctrl+Alt+S, click PHP under Languages & Frameworks.
-
On the PHP page that opens, click
 next to the CLI Interpreter field.
 -
In the CLI Interpreters dialog that opens, the Configuration File read-only field shows the path to the active php.ini file. Click Open in Editor.
-
-
To disable the Zend Debugger and Zend Optimizer tools, which block Xdebug, remove or comment out the following lines in the php.ini file:
zend_extension=<path_to_zend_debugger> zend_extension=<path_to_zend_optimizer> -
To enable Xdebug, locate or create the
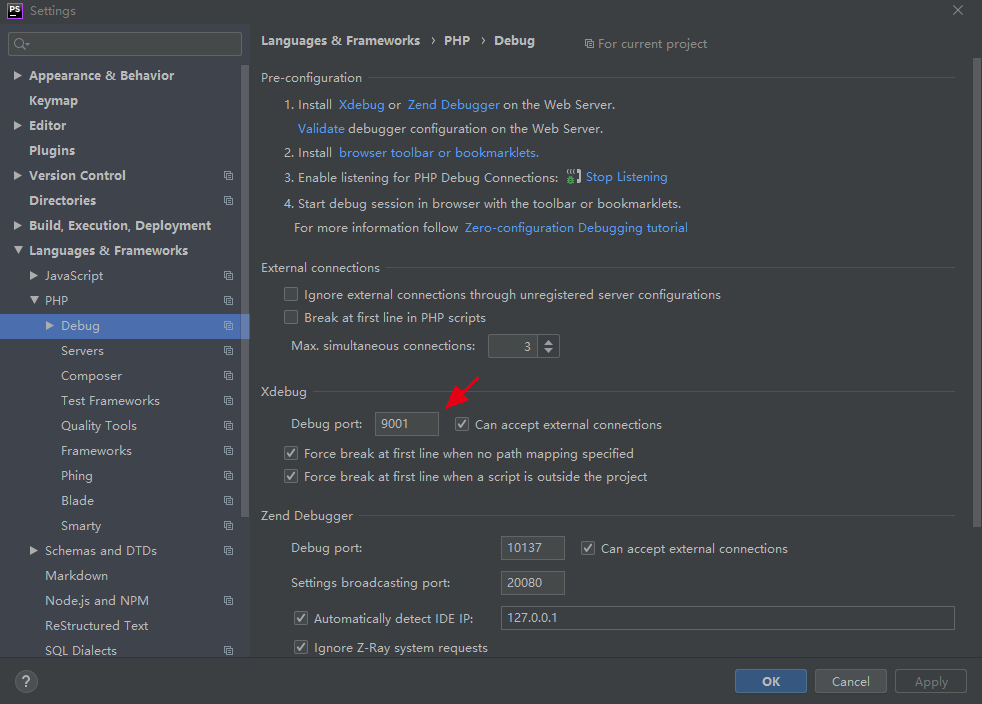
[xdebug]section in the php.ini file and update it as follows:[xdebug] zend_extension="<path to xdebug extension>" xdebug.remote_enable=1 xdebug.remote_port="<the port for Xdebug to listen to>" (the default port is 9000)In PHP 5.3 and later, you need to use only
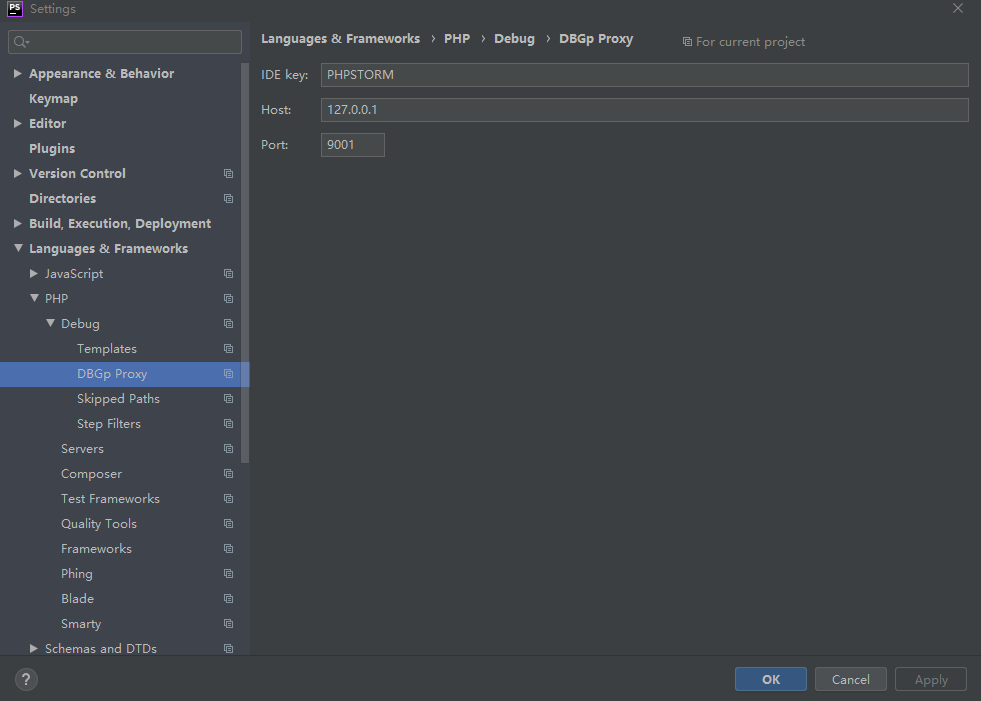
zend_extension, notzend_extension_ts,zend_extension_debug, orextension.To enable multiuser debugging via Xdebug proxies, locate the
xdebug.idekeysetting and assign it a value of your choice. This value will be used to register your IDE on Xdebug proxy servers. -
Save and close the php.ini file.
-
Verify Xdebug installation by doing any of the following:
-
In the command line, run the following command:
php --versionThe output should list Xdebug among the installed extensions:

-
Create a php file containing the following code:
<?php
phpinfo();
Open the file in the browser. The
phpinfooutput should contain the Xdebug section:
-
posted on 2019-12-17 16:34 Ra7ing安全实验室 阅读(374) 评论(0) 收藏 举报


 浙公网安备 33010602011771号