<template>
<div>
<div
id="typeData2"
class="bxs"
:style="{ width: '400px', height: '500px', marginTop: '50px' }"
></div>
</div>
</template>
<script>
import echarts from "echarts";
export default {
data() {
return {
backList: ["#f87b43", "#828df7"],
};
},
created() {},
mounted() {
this.typeInit2();
},
methods: {
async typeInit2() {
let myChartMapData = this.$echarts.init(
document.getElementById("typeData2")
);
const seriesLabel = {
show: true,
};
let series2 = [
{
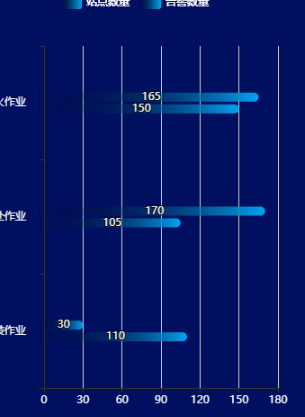
name: "站点数量",
type: "bar",
data: [165, 170, 30],
label: seriesLabel,
markPoint: {
symbolSize: 1,
symbolOffset: [0, "50%"],
data: [
// 最大和最小
// { type: "max", name: "max days: " },
// { type: "min", name: "min days: " },
],
},
},
{
name: "告警数量",
type: "bar",
label: seriesLabel,
data: [150, 105, 110],
},
];
for (var i in series2) {
// series[i].name = series[i].category;
series2[i].type = "bar";
// series[i].stack = "total";
series2[i].barWidth = 10;
series[i].emphasis = {
focus: "series",
blurScope: "coordinateSystem",
};
// 渐变 横向
series2[i].itemStyle = {
normal: {
barBorderRadius: [5, 5, 5, 5], // [左上角, 右上角, 右下角, 左下角]
color: new echarts.graphic.LinearGradient(1, 0, 0, 0, [
{
offset: 0,
color: "#00A3F1", // 起始颜色
},
{
offset: 1,
color: "transparent", // 结束颜色
},
]),
},
};
}
let option = {
// title: {
// text: "",//标题
// },
tooltip: {
trigger: "axis",
axisPointer: {
type: "shadow",
},
},
// legend: {
// data: ["新疆1", "辽宁2"],
// },
legend: [
{
textStyle: { color: "#fff" },
},
{
textStyle: { color: "#fff" },
},
],
grid: {
left: 100,
},
// 保存图片
// toolbox: {
// show: true,
// feature: {
// saveAsImage: {},
// },
// },
xAxis: {
type: "value",
// name: "Days",
axisLabel: {
// formatter: "{value}",
textStyle: {
//改变xy轴上文字的颜色
color: "#FFF",
},
},
},
yAxis: {
type: "category",
inverse: true,
data: xAxis,
axisLabel: {
formatter: function (value) {
// return "{" + value + "| }\n{value|" + value + "}";
return value;
},
margin: 20,
textStyle: {
//改变xy轴上文字的颜色
color: "#FFF",
},
rich: {
value: {
lineHeight: 30,
align: "center",
},
Sunny: {
height: 40,
align: "center",
},
Cloudy: {
height: 40,
align: "center",
},
Showers: {
height: 40,
align: "center",
},
},
},
},
series: series2,
};
myChartMapData.setOption(option);
},
},
};
</script>
<style lang="scss" scoped >
</style>


 浙公网安备 33010602011771号