Prometheus监控MySQL
一、mysql监控项
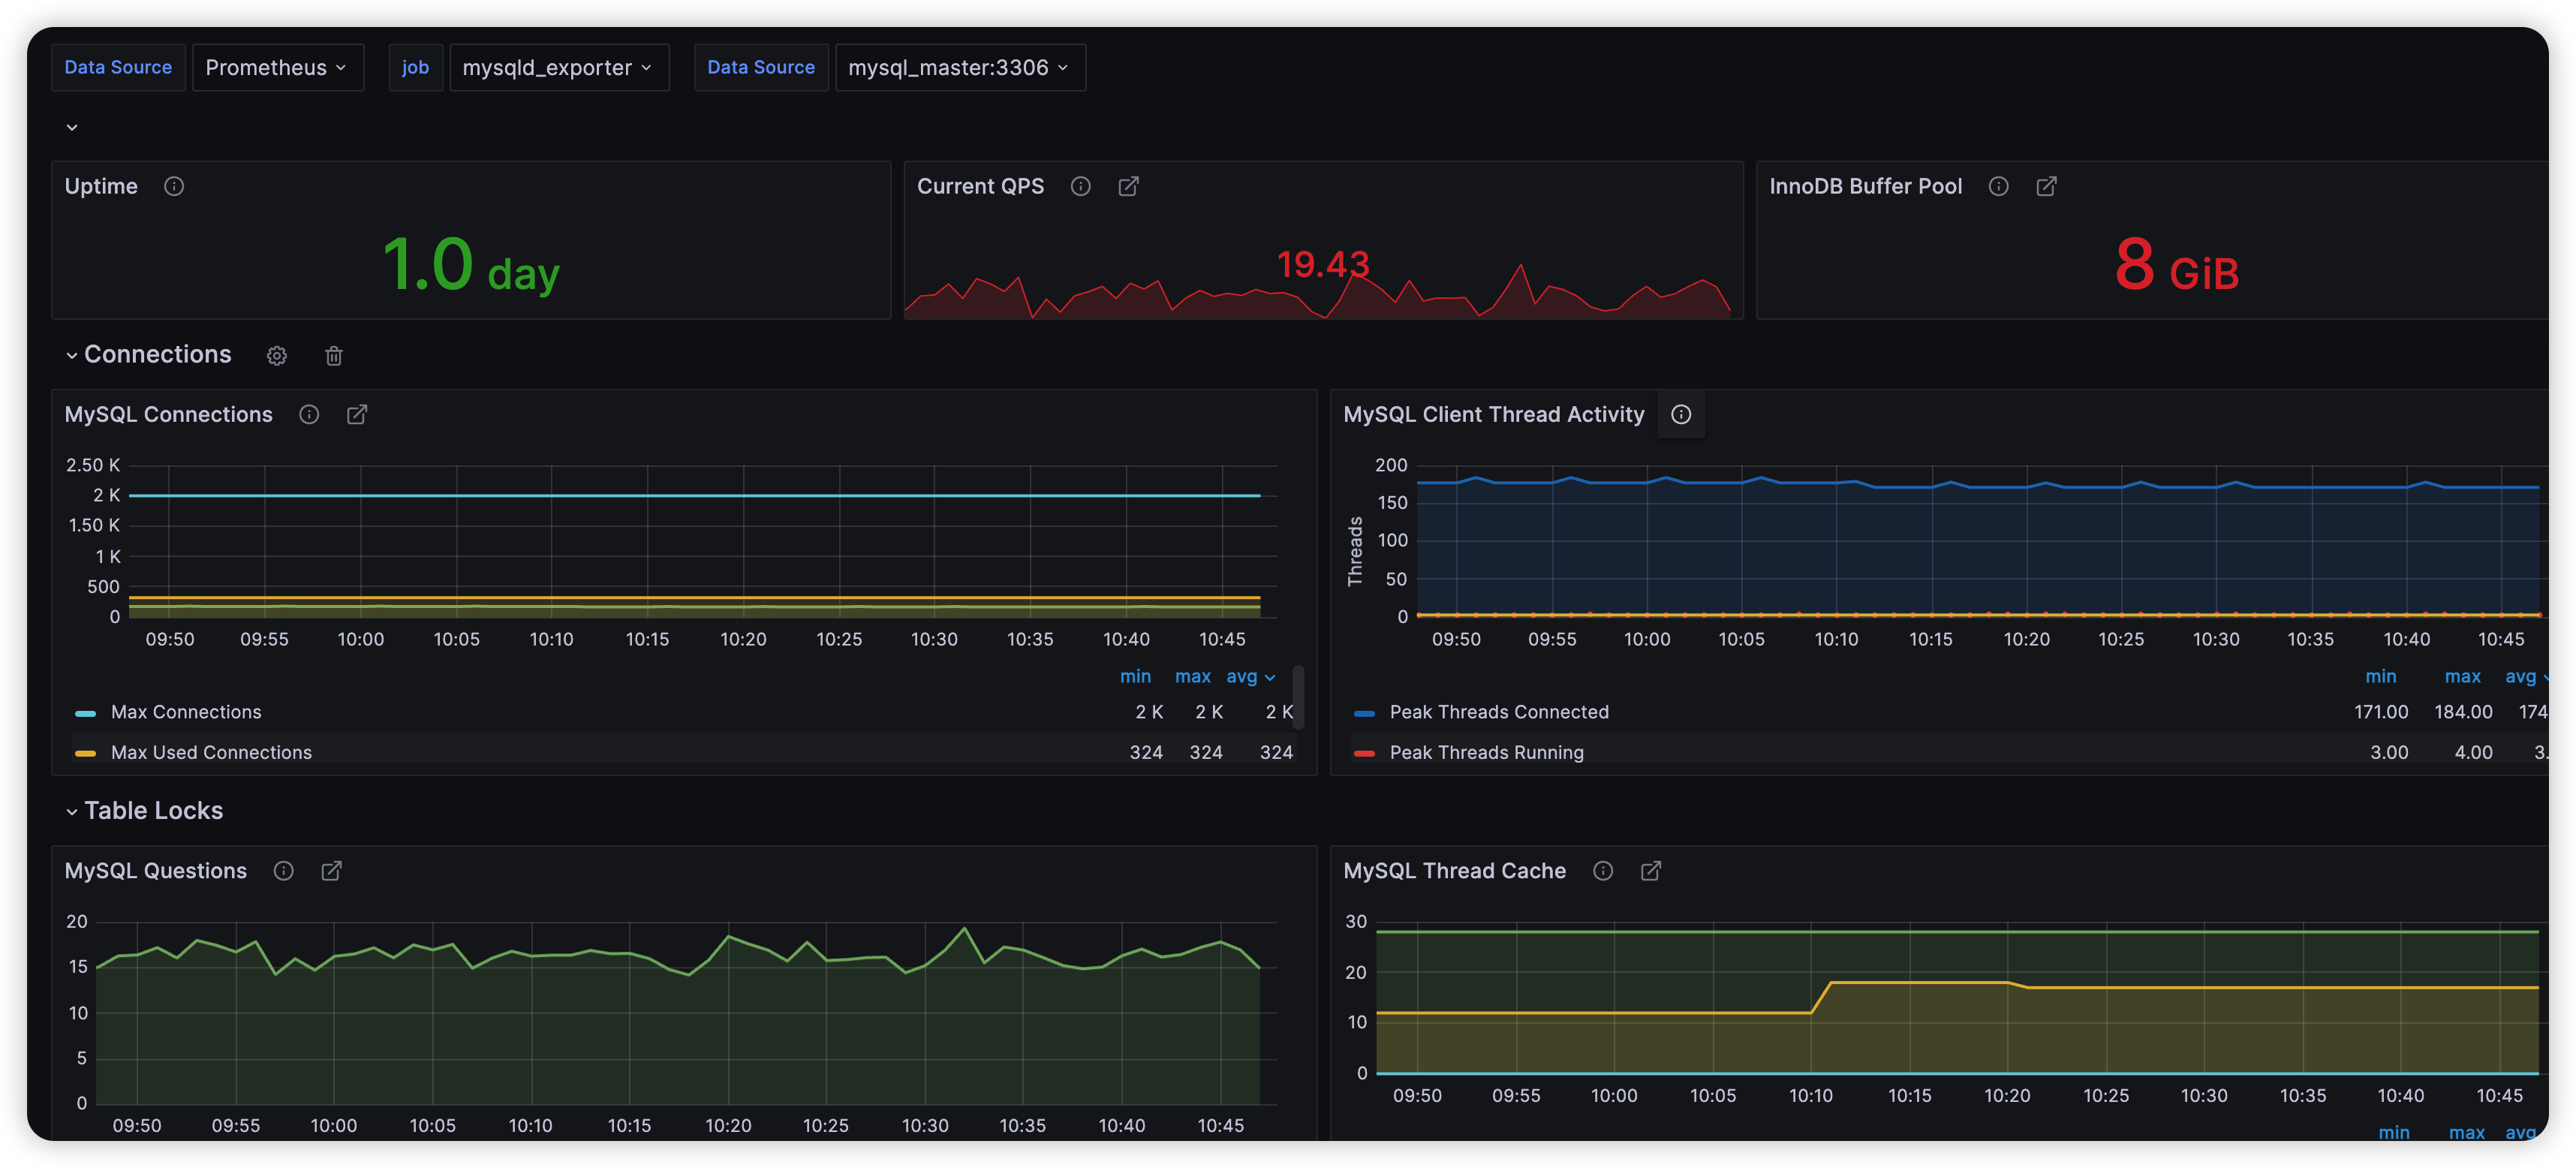
1、QPS(每秒查询率)、TPS(每秒事务的处理数量);
2、mysql请求流量带宽、响应流量带宽、网络、内存、cup等资源的占用
3、监控主从(show slave status\G);
4、锁表情况
5、监控缓冲池使用情况;
6、慢查询数量、当前连接数、吞吐量;
7、端口和服务状态、正常运行的时间
8、Handler 统计信息
提供了关于数据库引擎如何执行行的选择、更新、插入和修改方面的内部统计数据。它们是 MySQL 查询执行引擎和存储引擎之间的接口之一。
1. Handler_read_rnd_next
- 含义:
- 这个计数器在服务器执行全表扫描时增加。它表示 MySQL 从存储引擎获取下一行,通常是按照存储顺序。
- 解读:
- 如果这个值很高,说明执行了很多全表扫描。这通常意味着缺乏适当的索引,或者查询未能有效利用索引。
- 优化建议:
- 检查查询结构,确保相关字段上有适当的索引,以便减少全表扫描。
2. Handler_read_key
- 含义:
- 每当通过索引查找到某一行时,这个计数器都会增加。这意味着使用了索引来获取数据。
- 解读:
- 如果这个值较高,通常是好事,说明查询正在有效地利用索引。高效的 reads 通常依赖于良好设计的索引。
- 优化建议:
- 确保常用查询基于优化过的索引来读取数据。可以通过分析查询计划来确认索引的使用情况。
3. Handler_read_next
- 含义:
- 这个计数器在请求存储引擎读取“下一个”索引条目时增加。通常用于索引扫描。
- 解读:
- 如果这个值很高,意味着执行了大量的索引扫描。虽然索引扫描通常比全表扫描效率更高,但它仍可能指向未能高效使用索引的查询,特别是在索引列选择性较差的情况下。
- 优化建议:
- 检查索引的选择性和查询是否能通过更优化的结构减少扫描的行数。
二、mysqld_export
1、prometheus抓取任务
- job_name: 'mysqld_exporter'
    params:
      auth_module: [heaxxx-myxx]
    static_configs:
      - targets:
        - mysql_master:3306
        - mysql_slave:3306
    relabel_configs:
      - source_labels: [__address__]
        target_label: __param_target
      - source_labels: [__param_target]
        target_label: instance
      - target_label: __address__ # 给__address__标签设置一个新的固定值,由replacement的值进行替换
        replacement: mysqld_exporter:9104
2、docker swarm 部署mysqld_exporter yml文件,开启大部分的采集项
mysqld_exporter:
    image: "xx/mysqld-exporter:v0.15.0"
    extra_hosts:
      - "mysql_master:ip"
      - "mysql_slave:ip"
    command:
      - --config.my-cnf=/etc/my.cnf  # 指定 MySQL 配置文件
      - --collect.global_status       # 收集全局状态变量
      - --collect.global_variables    # 收集全局变量
      - --collect.info_schema.innodb_metrics  # 收集 InnoDB 相关的指标
      - --collect.info_schema.tablestats      # 收集表统计信息
      - --collect.info_schema.query_response_time  # 收集查询响应时间
      - --collect.heartbeat           # 收集心跳信息
      - --collect.heartbeat.database=monitor  # 指定心跳数据库
      - --collect.heartbeat.table=heartbeat    # 指定心跳表
      - --collect.binlog_size         # 收集二进制日志大小
      - --collect.slave_hosts         # 收集从属主机信息
      - --collect.slave_status  # 新加入
      - --collect.mysql.user          # 收集 MySQL 用户信息
      - --collect.info_schema.userstats  # 收集用户统计信息
      - --collect.engine_innodb_status  # 收集 InnoDB 引擎状态信息
      - --collect.info_schema.processlist  # 收集当前进程列表
      - --collect.info_schema.tables   # 收集表信息
      - --collect.perf_schema.tablelocks  # 收集表锁信息
      - --collect.perf_schema.file_events  # 收集文件事件信息
      - --collect.perf_schema.eventswaits  # 收集事件等待信息
      - --collect.perf_schema.indexiowaits  # 收集索引 I/O 等待信息
      - --collect.perf_schema.tableiowaits  # 收集表 I/O 等待信息

#  mysqld_exporter 参数,--[no-]collect表示可以开启或者禁用
#  剩余可选:
    --collect.info_schema.processlist.min_time=0  # 设置最小时间过滤,以收集信息模式中的进程列表
    --collect.info_schema.tables.databases="*"  # 要收集表统计的数据库列表,使用 "*" 表示所有数据库
    --collect.perf_schema.eventsstatements.limit=250  # 设置性能模式下事件语句收集的最大数量
    --collect.perf_schema.eventsstatements.timelimit=86400  # 设置性能模式下事件语句收集的时间限制(秒)
    --collect.perf_schema.eventsstatements.digest_text_limit=120  # 设置性能模式下语句摘要的文本长度限制
    --collect.perf_schema.file_instances.filter=".*"  # 设置文件实例收集的过滤表达式
    --collect.perf_schema.file_instances.remove_prefix="/var/lib/mysql/"  # 从收集的文件实例中移除指定前缀
    --collect.perf_schema.memory_events.remove_prefix="memory/"  # 从收集的内存事件中移除指定前缀
    --[no-]collect.mysql.user.privileges  # 启用或禁用从 mysql.user 收集用户权限信息
    --[no-]collect.info_schema.processlist.processes_by_user  # 启用或禁用按用户分组的进程统计收集
    --[no-]collect.info_schema.processlist.processes_by_host  # 启用或禁用按主机分组的进程统计收集
    --[no-]collect.heartbeat.utc  # 启用或禁用 UTC 时间戳的心跳数据收集
    --[no-]collect.info_schema.innodb_tablespaces  # 启用或禁用收集 InnoDB 表空间相关信息
    --[no-]collect.info_schema.innodb_metrics  # 启用或禁用收集 InnoDB 相关的指标
    --[no-]collect.slave_status  # 启用或禁用收集从节点状态信息,包括复制相关数据
    --[no-]collect.perf_schema.eventsstatements  # 启用或禁用收集性能模式下的事件语句信息
    --[no-]collect.perf_schema.eventsstatementssum  # 启用或禁用收集性能模式下事件语句的汇总信息
    --[no-]collect.auto_increment.columns  # 启用或禁用收集自增列的统计信息
    --[no-]collect.perf_schema.replication_group_member_stats  # 启用或禁用收集复制组成员的统计信息
    --[no-]collect.perf_schema.replication_applier_status_by_worker  # 启用或禁用收集按工作线程划分的复制应用程序状态信息
    --[no-]collect.sys.user_summary  # 启用或禁用收集用户摘要信息
    --[no-]collect.perf_schema.file_instances  # 启用或禁用收集文件实例的信息
    --[no-]collect.perf_schema.memory_events  # 启用或禁用收集内存事件的信息
    --[no-]collect.perf_schema.replication_group_members  # 启用或禁用收集复制组成员信息
    --[no-]collect.info_schema.innodb_cmpmem  # 启用或禁用收集 InnoDB 压缩内存相关信息
    --[no-]collect.info_schema.clientstats  # 启用或禁用收集客户端统计信息,需在 userstat=1 下使用
    --[no-]collect.info_schema.schemastats  # 启用或禁用收集模式统计信息,需在 userstat=1 下使用
    --[no-]collect.info_schema.innodb_cmp  # 启用或禁用收集 InnoDB 压缩相关信息
    --[no-]collect.info_schema.replica_host  # 启用或禁用收集复制主机相关信息
三、grafana 模版文件
1、模版一
{
"__inputs": [],
"__elements": {},
"__requires": [
{
"type": "grafana",
"id": "grafana",
"name": "Grafana",
"version": "10.0.10"
},
{
"type": "panel",
"id": "graph",
"name": "Graph (old)",
"version": ""
},
{
"type": "datasource",
"id": "prometheus",
"name": "Prometheus",
"version": "1.0.0"
},
{
"type": "panel",
"id": "stat",
"name": "Stat",
"version": ""
}
],
"annotations": {
"list": [
{
"builtIn": 1,
"datasource": {
"type": "datasource",
"uid": "grafana"
},
"enable": true,
"hide": true,
"iconColor": "rgba(0, 211, 255, 1)",
"name": "Annotations & Alerts",
"target": {
"limit": 100,
"matchAny": false,
"tags": [],
"type": "dashboard"
},
"type": "dashboard"
}
]
},
"description": "",
"editable": true,
"fiscalYearStartMonth": 0,
"gnetId": 11323,
"graphTooltip": 1,
"id": null,
"links": [],
"liveNow": false,
"panels": [
{
"collapsed": false,
"datasource": {
"uid": "$datasource"
},
"gridPos": {
"h": 1,
"w": 24,
"x": 0,
"y": 0
},
"id": 382,
"panels": [],
"targets": [
{
"datasource": {
"uid": "$datasource"
},
"refId": "A"
}
],
"type": "row"
},
{
"datasource": {
"uid": "$datasource"
},
"description": "**Uptime**\n\nThe amount of time since the last restart of the MySQL server process.",
"fieldConfig": {
"defaults": {
"decimals": 1,
"mappings": [],
"thresholds": {
"mode": "absolute",
"steps": [
{
"color": "rgba(245, 54, 54, 0.9)",
"value": null
},
{
"color": "rgba(237, 129, 40, 0.89)",
"value": 300
},
{
"color": "rgba(50, 172, 45, 0.97)",
"value": 3600
}
]
},
"unit": "s"
},
"overrides": []
},
"gridPos": {
"h": 3,
"w": 8,
"x": 0,
"y": 1
},
"id": 12,
"interval": "1m",
"links": [],
"maxDataPoints": 100,
"options": {
"colorMode": "value",
"fieldOptions": {
"calcs": [
"lastNotNull"
]
},
"graphMode": "none",
"justifyMode": "auto",
"orientation": "horizontal",
"reduceOptions": {
"calcs": [
"mean"
],
"fields": "",
"values": false
},
"textMode": "auto"
},
"pluginVersion": "10.0.10",
"targets": [
{
"calculatedInterval": "10m",
"datasource": {
"uid": "$datasource"
},
"datasourceErrors": {},
"errors": {},
"expr": "mysql_global_status_uptime{job=~\"$job\", instance=~\"$instance\"}",
"format": "time_series",
"interval": "1m",
"intervalFactor": 1,
"legendFormat": "{{instance}}",
"metric": "",
"refId": "A",
"step": 300
}
],
"title": "Uptime",
"type": "stat"
},
{
"datasource": {
"type": "prometheus",
"uid": "$datasource"
},
"description": "**Current QPS**\n\nBased on the queries reported by MySQL's ``SHOW STATUS`` command, it is the number of statements executed by the server within the last second. This variable includes statements executed within stored programs, unlike the Questions variable. It does not count \n``COM_PING`` or ``COM_STATISTICS`` commands.",
"fieldConfig": {
"defaults": {
"decimals": 2,
"mappings": [],
"thresholds": {
"mode": "absolute",
"steps": [
{
"color": "rgba(245, 54, 54, 0.9)",
"value": null
},
{
"color": "rgba(237, 129, 40, 0.89)",
"value": 35
},
{
"color": "rgba(50, 172, 45, 0.97)",
"value": 75
}
]
},
"unit": "short"
},
"overrides": []
},
"gridPos": {
"h": 3,
"w": 8,
"x": 8,
"y": 1
},
"id": 13,
"interval": "1m",
"links": [
{
"targetBlank": true,
"title": "MySQL Server Status Variables",
"url": "https://dev.mysql.com/doc/refman/5.7/en/server-status-variables.html#statvar_Queries"
}
],
"maxDataPoints": 100,
"options": {
"colorMode": "value",
"fieldOptions": {
"calcs": [
"lastNotNull"
]
},
"graphMode": "area",
"justifyMode": "auto",
"orientation": "horizontal",
"reduceOptions": {
"calcs": [
"mean"
],
"fields": "",
"values": false
},
"textMode": "auto"
},
"pluginVersion": "10.0.10",
"targets": [
{
"calculatedInterval": "10m",
"datasource": {
"uid": "$datasource"
},
"datasourceErrors": {},
"editorMode": "code",
"errors": {},
"expr": "rate(mysql_global_status_queries{job=~\"$job\", instance=~\"$instance\"}[$__rate_interval])",
"format": "time_series",
"interval": "1m",
"intervalFactor": 1,
"legendFormat": "{{instance}}",
"metric": "",
"range": true,
"refId": "A",
"step": 20
}
],
"title": "Current QPS",
"type": "stat"
},
{
"datasource": {
"uid": "$datasource"
},
"description": "**InnoDB Buffer Pool Size**\n\nInnoDB maintains a storage area called the buffer pool for caching data and indexes in memory. Knowing how the InnoDB buffer pool works, and taking advantage of it to keep frequently accessed data in memory, is one of the most important aspects of MySQL tuning. The goal is to keep the working set in memory. In most cases, this should be between 60%-90% of available memory on a dedicated database host, but depends on many factors.",
"fieldConfig": {
"defaults": {
"decimals": 0,
"mappings": [],
"thresholds": {
"mode": "absolute",
"steps": [
{
"color": "rgba(50, 172, 45, 0.97)",
"value": null
},
{
"color": "rgba(237, 129, 40, 0.89)",
"value": 90
},
{
"color": "rgba(245, 54, 54, 0.9)",
"value": 95
}
]
},
"unit": "bytes"
},
"overrides": []
},
"gridPos": {
"h": 3,
"w": 8,
"x": 16,
"y": 1
},
"id": 51,
"interval": "1m",
"links": [
{
"targetBlank": true,
"title": "Tuning the InnoDB Buffer Pool Size",
"url": "https://www.percona.com/blog/2015/06/02/80-ram-tune-innodb_buffer_pool_size/"
}
],
"maxDataPoints": 100,
"options": {
"colorMode": "value",
"fieldOptions": {
"calcs": [
"lastNotNull"
]
},
"graphMode": "none",
"justifyMode": "auto",
"orientation": "horizontal",
"reduceOptions": {
"calcs": [
"mean"
],
"fields": "",
"values": false
},
"textMode": "auto"
},
"pluginVersion": "10.0.10",
"targets": [
{
"calculatedInterval": "10m",
"datasource": {
"uid": "$datasource"
},
"datasourceErrors": {},
"errors": {},
"expr": "mysql_global_variables_innodb_buffer_pool_size{job=~\"$job\", instance=~\"$instance\"}",
"format": "time_series",
"interval": "1m",
"intervalFactor": 1,
"legendFormat": "{{instance}}",
"metric": "",
"refId": "A",
"step": 300
}
],
"title": "InnoDB Buffer Pool",
"type": "stat"
},
{
"collapsed": false,
"datasource": {
"uid": "$datasource"
},
"gridPos": {
"h": 1,
"w": 24,
"x": 0,
"y": 4
},
"id": 383,
"panels": [],
"targets": [
{
"datasource": {
"uid": "$datasource"
},
"refId": "A"
}
],
"title": "Connections",
"type": "row"
},
{
"aliasColors": {},
"bars": false,
"dashLength": 10,
"dashes": false,
"datasource": {
"uid": "$datasource"
},
"decimals": 0,
"description": "**Max Connections** \n\nMax Connections is the maximum permitted number of simultaneous client connections. By default, this is 151. Increasing this value increases the number of file descriptors that mysqld requires. If the required number of descriptors are not available, the server reduces the value of Max Connections.\n\nmysqld actually permits Max Connections + 1 clients to connect. The extra connection is reserved for use by accounts that have the SUPER privilege, such as root.\n\nMax Used Connections is the maximum number of connections that have been in use simultaneously since the server started.\n\nConnections is the number of connection attempts (successful or not) to the MySQL server.",
"editable": true,
"error": false,
"fieldConfig": {
"defaults": {
"links": []
},
"overrides": []
},
"fill": 2,
"fillGradient": 0,
"grid": {},
"gridPos": {
"h": 7,
"w": 12,
"x": 0,
"y": 5
},
"height": "250px",
"hiddenSeries": false,
"id": 92,
"legend": {
"alignAsTable": true,
"avg": true,
"current": false,
"max": true,
"min": true,
"show": true,
"sort": "avg",
"sortDesc": true,
"total": false,
"values": true
},
"lines": true,
"linewidth": 2,
"links": [
{
"targetBlank": true,
"title": "MySQL Server System Variables",
"url": "https://dev.mysql.com/doc/refman/5.7/en/server-system-variables.html#sysvar_max_connections"
}
],
"nullPointMode": "null",
"options": {
"alertThreshold": true
},
"percentage": false,
"pluginVersion": "10.0.10",
"pointradius": 5,
"points": false,
"renderer": "flot",
"seriesOverrides": [
{
"alias": "Max Connections",
"fill": 0
}
],
"spaceLength": 10,
"stack": false,
"steppedLine": false,
"targets": [
{
"calculatedInterval": "2m",
"datasource": {
"uid": "$datasource"
},
"datasourceErrors": {},
"errors": {},
"expr": "sum(max_over_time(mysql_global_status_threads_connected{job=~\"$job\", instance=~\"$instance\"}[$__rate_interval]))",
"format": "time_series",
"interval": "1m",
"intervalFactor": 1,
"legendFormat": "Connections",
"metric": "",
"refId": "A",
"step": 20
},
{
"calculatedInterval": "2m",
"datasource": {
"uid": "$datasource"
},
"datasourceErrors": {},
"errors": {},
"expr": "sum(mysql_global_status_max_used_connections{job=~\"$job\", instance=~\"$instance\"})",
"format": "time_series",
"interval": "1m",
"intervalFactor": 1,
"legendFormat": "Max Used Connections",
"metric": "",
"refId": "C",
"step": 20,
"target": ""
},
{
"calculatedInterval": "2m",
"datasource": {
"uid": "$datasource"
},
"datasourceErrors": {},
"errors": {},
"expr": "sum(mysql_global_variables_max_connections{job=~\"$job\", instance=~\"$instance\"})",
"format": "time_series",
"interval": "1m",
"intervalFactor": 1,
"legendFormat": "Max Connections",
"metric": "",
"refId": "B",
"step": 20,
"target": ""
}
],
"thresholds": [],
"timeRegions": [],
"title": "MySQL Connections",
"tooltip": {
"msResolution": false,
"shared": true,
"sort": 0,
"value_type": "cumulative"
},
"type": "graph",
"xaxis": {
"mode": "time",
"show": true,
"values": []
},
"yaxes": [
{
"format": "short",
"label": "",
"logBase": 1,
"min": 0,
"show": true
},
{
"format": "short",
"label": "",
"logBase": 1,
"min": 0,
"show": true
}
],
"yaxis": {
"align": false
}
},
{
"aliasColors": {},
"bars": false,
"dashLength": 10,
"dashes": false,
"datasource": {
"uid": "$datasource"
},
"decimals": 2,
"description": "**MySQL Active Threads**\n\nThreads Connected is the number of open connections, while Threads Running is the number of threads not sleeping.",
"editable": true,
"error": false,
"fieldConfig": {
"defaults": {
"links": []
},
"overrides": []
},
"fill": 2,
"fillGradient": 0,
"grid": {},
"gridPos": {
"h": 7,
"w": 12,
"x": 12,
"y": 5
},
"hiddenSeries": false,
"id": 10,
"legend": {
"alignAsTable": true,
"avg": true,
"current": false,
"max": true,
"min": true,
"rightSide": false,
"show": true,
"sort": "avg",
"sortDesc": true,
"total": false,
"values": true
},
"lines": true,
"linewidth": 2,
"links": [],
"nullPointMode": "null",
"options": {
"alertThreshold": true
},
"percentage": false,
"pluginVersion": "10.0.10",
"pointradius": 5,
"points": false,
"renderer": "flot",
"seriesOverrides": [
{
"alias": "Peak Threads Running",
"color": "#E24D42",
"lines": false,
"pointradius": 1,
"points": true
},
{
"alias": "Peak Threads Connected",
"color": "#1F78C1"
},
{
"alias": "Avg Threads Running",
"color": "#EAB839"
}
],
"spaceLength": 10,
"stack": false,
"steppedLine": false,
"targets": [
{
"calculatedInterval": "2m",
"datasource": {
"uid": "$datasource"
},
"datasourceErrors": {},
"errors": {},
"expr": "sum(max_over_time(mysql_global_status_threads_connected{job=~\"$job\", instance=~\"$instance\"}[$__rate_interval]))",
"format": "time_series",
"hide": false,
"interval": "1m",
"intervalFactor": 1,
"legendFormat": "Peak Threads Connected",
"metric": "",
"refId": "A",
"step": 20
},
{
"calculatedInterval": "2m",
"datasource": {
"uid": "$datasource"
},
"datasourceErrors": {},
"errors": {},
"expr": "sum(max_over_time(mysql_global_status_threads_running{job=~\"$job\", instance=~\"$instance\"}[$__rate_interval]))",
"format": "time_series",
"interval": "1m",
"intervalFactor": 1,
"legendFormat": "Peak Threads Running",
"metric": "",
"refId": "B",
"step": 20
},
{
"datasource": {
"uid": "$datasource"
},
"expr": "sum(avg_over_time(mysql_global_status_threads_running{job=~\"$job\", instance=~\"$instance\"}[$__rate_interval]))",
"format": "time_series",
"interval": "1m",
"intervalFactor": 1,
"legendFormat": "Avg Threads Running",
"refId": "C",
"step": 20
}
],
"thresholds": [],
"timeRegions": [],
"title": "MySQL Client Thread Activity",
"tooltip": {
"msResolution": false,
"shared": true,
"sort": 0,
"value_type": "individual"
},
"type": "graph",
"xaxis": {
"mode": "time",
"show": true,
"values": [
"total"
]
},
"yaxes": [
{
"format": "short",
"label": "Threads",
"logBase": 1,
"min": 0,
"show": true
},
{
"format": "short",
"label": "",
"logBase": 1,
"min": 0,
"show": false
}
],
"yaxis": {
"align": false
}
},
{
"collapsed": false,
"datasource": {
"uid": "$datasource"
},
"gridPos": {
"h": 1,
"w": 24,
"x": 0,
"y": 12
},
"id": 384,
"panels": [],
"targets": [
{
"datasource": {
"uid": "$datasource"
},
"refId": "A"
}
],
"title": "Table Locks",
"type": "row"
},
{
"aliasColors": {},
"bars": false,
"dashLength": 10,
"dashes": false,
"datasource": {
"uid": "$datasource"
},
"decimals": 2,
"description": "**MySQL Questions**\n\nThe number of statements executed by the server. This includes only statements sent to the server by clients and not statements executed within stored programs, unlike the Queries used in the QPS calculation. \n\nThis variable does not count the following commands:\n* ``COM_PING``\n* ``COM_STATISTICS``\n* ``COM_STMT_PREPARE``\n* ``COM_STMT_CLOSE``\n* ``COM_STMT_RESET``",
"editable": true,
"error": false,
"fieldConfig": {
"defaults": {
"links": []
},
"overrides": []
},
"fill": 2,
"fillGradient": 0,
"grid": {},
"gridPos": {
"h": 7,
"w": 12,
"x": 0,
"y": 13
},
"hiddenSeries": false,
"id": 53,
"legend": {
"alignAsTable": true,
"avg": true,
"current": false,
"max": true,
"min": true,
"rightSide": false,
"show": true,
"sort": "avg",
"sortDesc": true,
"total": false,
"values": true
},
"lines": true,
"linewidth": 2,
"links": [
{
"targetBlank": true,
"title": "MySQL Queries and Questions",
"url": "https://www.percona.com/blog/2014/05/29/how-mysql-queries-and-questions-are-measured/"
}
],
"nullPointMode": "null",
"options": {
"alertThreshold": true
},
"percentage": false,
"pluginVersion": "10.0.10",
"pointradius": 5,
"points": false,
"renderer": "flot",
"seriesOverrides": [],
"spaceLength": 10,
"stack": false,
"steppedLine": false,
"targets": [
{
"calculatedInterval": "2m",
"datasource": {
"uid": "$datasource"
},
"datasourceErrors": {},
"errors": {},
"expr": "rate(mysql_global_status_questions{job=~\"$job\", instance=~\"$instance\"}[$__rate_interval])",
"format": "time_series",
"interval": "1m",
"intervalFactor": 1,
"legendFormat": "{{instance}}",
"metric": "",
"refId": "A",
"step": 20
}
],
"thresholds": [],
"timeRegions": [],
"title": "MySQL Questions",
"tooltip": {
"msResolution": false,
"shared": true,
"sort": 0,
"value_type": "individual"
},
"type": "graph",
"xaxis": {
"mode": "time",
"show": true,
"values": []
},
"yaxes": [
{
"format": "short",
"logBase": 1,
"min": 0,
"show": true
},
{
"format": "short",
"logBase": 1,
"min": 0,
"show": true
}
],
"yaxis": {
"align": false
}
},
{
"aliasColors": {},
"bars": false,
"dashLength": 10,
"dashes": false,
"datasource": {
"uid": "$datasource"
},
"decimals": 2,
"description": "**MySQL Thread Cache**\n\nThe thread_cache_size variable sets how many threads the server should cache to reuse. When a client disconnects, the client's threads are put in the cache if the cache is not full. It is autosized in MySQL 5.6.8 and above (capped to 100). Requests for threads are satisfied by reusing threads taken from the cache if possible, and only when the cache is empty is a new thread created.\n\n* *Threads_created*: The number of threads created to handle connections.\n* *Threads_cached*: The number of threads in the thread cache.",
"editable": true,
"error": false,
"fieldConfig": {
"defaults": {
"links": []
},
"overrides": []
},
"fill": 2,
"fillGradient": 0,
"grid": {},
"gridPos": {
"h": 7,
"w": 12,
"x": 12,
"y": 13
},
"hiddenSeries": false,
"id": 11,
"legend": {
"alignAsTable": true,
"avg": true,
"current": false,
"max": true,
"min": true,
"rightSide": false,
"show": true,
"sort": "avg",
"sortDesc": true,
"total": false,
"values": true
},
"lines": true,
"linewidth": 2,
"links": [
{
"title": "Tuning information",
"url": "https://dev.mysql.com/doc/refman/5.6/en/server-system-variables.html#sysvar_thread_cache_size"
}
],
"nullPointMode": "null",
"options": {
"alertThreshold": true
},
"percentage": false,
"pluginVersion": "10.0.10",
"pointradius": 5,
"points": false,
"renderer": "flot",
"seriesOverrides": [
{
"alias": "Threads Created",
"fill": 0
}
],
"spaceLength": 10,
"stack": false,
"steppedLine": false,
"targets": [
{
"calculatedInterval": "2m",
"datasource": {
"uid": "$datasource"
},
"datasourceErrors": {},
"errors": {},
"expr": "sum(mysql_global_variables_thread_cache_size{job=~\"$job\", instance=~\"$instance\"})",
"format": "time_series",
"interval": "1m",
"intervalFactor": 1,
"legendFormat": "Thread Cache Size",
"metric": "",
"refId": "B",
"step": 20
},
{
"calculatedInterval": "2m",
"datasource": {
"uid": "$datasource"
},
"datasourceErrors": {},
"errors": {},
"expr": "sum(mysql_global_status_threads_cached{job=~\"$job\", instance=~\"$instance\"})",
"format": "time_series",
"interval": "1m",
"intervalFactor": 1,
"legendFormat": "Threads Cached",
"metric": "",
"refId": "C",
"step": 20
},
{
"calculatedInterval": "2m",
"datasource": {
"uid": "$datasource"
},
"datasourceErrors": {},
"errors": {},
"expr": "sum(rate(mysql_global_status_threads_created{job=~\"$job\", instance=~\"$instance\"}[$__rate_interval]))",
"format": "time_series",
"interval": "1m",
"intervalFactor": 1,
"legendFormat": "Threads Created",
"metric": "",
"refId": "A",
"step": 20
}
],
"thresholds": [],
"timeRegions": [],
"title": "MySQL Thread Cache",
"tooltip": {
"msResolution": false,
"shared": true,
"sort": 0,
"value_type": "individual"
},
"type": "graph",
"xaxis": {
"mode": "time",
"show": true,
"values": []
},
"yaxes": [
{
"format": "short",
"logBase": 1,
"min": 0,
"show": true
},
{
"format": "short",
"logBase": 1,
"min": 0,
"show": true
}
],
"yaxis": {
"align": false
}
},
{
"collapsed": false,
"datasource": {
"uid": "$datasource"
},
"gridPos": {
"h": 1,
"w": 24,
"x": 0,
"y": 20
},
"id": 385,
"panels": [],
"targets": [
{
"datasource": {
"uid": "$datasource"
},
"refId": "A"
}
],
"title": "Temporary Objects",
"type": "row"
},
{
"aliasColors": {},
"bars": false,
"dashLength": 10,
"dashes": false,
"datasource": {
"uid": "$datasource"
},
"decimals": 2,
"editable": true,
"error": false,
"fieldConfig": {
"defaults": {
"links": []
},
"overrides": []
},
"fill": 2,
"fillGradient": 0,
"grid": {},
"gridPos": {
"h": 7,
"w": 12,
"x": 0,
"y": 21
},
"hiddenSeries": false,
"id": 22,
"legend": {
"alignAsTable": true,
"avg": true,
"current": false,
"max": true,
"min": true,
"rightSide": false,
"show": true,
"sort": "avg",
"sortDesc": true,
"total": false,
"values": true
},
"lines": true,
"linewidth": 2,
"links": [],
"nullPointMode": "null",
"options": {
"alertThreshold": true
},
"percentage": false,
"pluginVersion": "10.0.10",
"pointradius": 5,
"points": false,
"renderer": "flot",
"seriesOverrides": [],
"spaceLength": 10,
"stack": false,
"steppedLine": false,
"targets": [
{
"calculatedInterval": "2m",
"datasource": {
"uid": "$datasource"
},
"datasourceErrors": {},
"errors": {},
"expr": "sum(rate(mysql_global_status_created_tmp_tables{job=~\"$job\", instance=~\"$instance\"}[$__rate_interval]))",
"interval": "1m",
"intervalFactor": 1,
"legendFormat": "Created Tmp Tables",
"metric": "",
"refId": "A",
"step": 20
},
{
"calculatedInterval": "2m",
"datasource": {
"uid": "$datasource"
},
"datasourceErrors": {},
"errors": {},
"expr": "sum(rate(mysql_global_status_created_tmp_disk_tables{job=~\"$job\", instance=~\"$instance\"}[$__rate_interval]))",
"interval": "1m",
"intervalFactor": 1,
"legendFormat": "Created Tmp Disk Tables",
"metric": "",
"refId": "B",
"step": 20
},
{
"calculatedInterval": "2m",
"datasource": {
"uid": "$datasource"
},
"datasourceErrors": {},
"errors": {},
"expr": "sum(rate(mysql_global_status_created_tmp_files{job=~\"$job\", instance=~\"$instance\"}[$__rate_interval]))",
"interval": "1m",
"intervalFactor": 1,
"legendFormat": "Created Tmp Files",
"metric": "",
"refId": "C",
"step": 20
}
],
"thresholds": [],
"timeRegions": [],
"title": "MySQL Temporary Objects",
"tooltip": {
"msResolution": false,
"shared": true,
"sort": 0,
"value_type": "individual"
},
"type": "graph",
"xaxis": {
"mode": "time",
"show": true,
"values": []
},
"yaxes": [
{
"format": "short",
"logBase": 1,
"min": 0,
"show": true
},
{
"format": "short",
"logBase": 1,
"min": 0,
"show": true
}
],
"yaxis": {
"align": false
}
},
{
"aliasColors": {},
"bars": false,
"dashLength": 10,
"dashes": false,
"datasource": {
"uid": "$datasource"
},
"decimals": 2,
"description": "**MySQL Select Types**\n\nAs with most relational databases, selecting based on indexes is more efficient than scanning an entire table's data. Here we see the counters for selects not done with indexes.\n\n* ***Select Scan*** is how many queries caused full table scans, in which all the data in the table had to be read and either discarded or returned.\n* ***Select Range*** is how many queries used a range scan, which means MySQL scanned all rows in a given range.\n* ***Select Full Join*** is the number of joins that are not joined on an index, this is usually a huge performance hit.",
"editable": true,
"error": false,
"fieldConfig": {
"defaults": {
"links": []
},
"overrides": []
},
"fill": 2,
"fillGradient": 0,
"grid": {},
"gridPos": {
"h": 7,
"w": 12,
"x": 12,
"y": 21
},
"height": "250px",
"hiddenSeries": false,
"id": 311,
"legend": {
"alignAsTable": true,
"avg": true,
"current": false,
"hideZero": true,
"max": true,
"min": true,
"rightSide": false,
"show": true,
"sort": "avg",
"sortDesc": true,
"total": false,
"values": true
},
"lines": true,
"linewidth": 2,
"links": [],
"nullPointMode": "null",
"options": {
"alertThreshold": true
},
"percentage": false,
"pluginVersion": "10.0.10",
"pointradius": 5,
"points": false,
"renderer": "flot",
"seriesOverrides": [],
"spaceLength": 10,
"stack": false,
"steppedLine": false,
"targets": [
{
"calculatedInterval": "2m",
"datasource": {
"uid": "$datasource"
},
"datasourceErrors": {},
"errors": {},
"expr": "sum(rate(mysql_global_status_select_full_join{job=~\"$job\", instance=~\"$instance\"}[$__rate_interval]))",
"format": "time_series",
"interval": "1m",
"intervalFactor": 1,
"legendFormat": "Select Full Join",
"metric": "",
"refId": "A",
"step": 20
},
{
"calculatedInterval": "2m",
"datasource": {
"uid": "$datasource"
},
"datasourceErrors": {},
"errors": {},
"expr": "sum(rate(mysql_global_status_select_full_range_join{job=~\"$job\", instance=~\"$instance\"}[$__rate_interval]))",
"format": "time_series",
"interval": "1m",
"intervalFactor": 1,
"legendFormat": "Select Full Range Join",
"metric": "",
"refId": "B",
"step": 20
},
{
"calculatedInterval": "2m",
"datasource": {
"uid": "$datasource"
},
"datasourceErrors": {},
"errors": {},
"expr": "sum(rate(mysql_global_status_select_range{job=~\"$job\", instance=~\"$instance\"}[$__rate_interval]))",
"format": "time_series",
"interval": "1m",
"intervalFactor": 1,
"legendFormat": "Select Range",
"metric": "",
"refId": "C",
"step": 20
},
{
"calculatedInterval": "2m",
"datasource": {
"uid": "$datasource"
},
"datasourceErrors": {},
"errors": {},
"expr": "sum(rate(mysql_global_status_select_range_check{job=~\"$job\", instance=~\"$instance\"}[$__rate_interval]))",
"format": "time_series",
"interval": "1m",
"intervalFactor": 1,
"legendFormat": "Select Range Check",
"metric": "",
"refId": "D",
"step": 20
},
{
"calculatedInterval": "2m",
"datasource": {
"uid": "$datasource"
},
"datasourceErrors": {},
"errors": {},
"expr": "sum(rate(mysql_global_status_select_scan{job=~\"$job\", instance=~\"$instance\"}[$__rate_interval]))",
"format": "time_series",
"interval": "1m",
"intervalFactor": 1,
"legendFormat": "Select Scan",
"metric": "",
"refId": "E",
"step": 20
}
],
"thresholds": [],
"timeRegions": [],
"title": "MySQL Select Types",
"tooltip": {
"msResolution": false,
"shared": true,
"sort": 0,
"value_type": "individual"
},
"type": "graph",
"xaxis": {
"mode": "time",
"show": true,
"values": []
},
"yaxes": [
{
"format": "short",
"logBase": 1,
"min": 0,
"show": true
},
{
"format": "short",
"logBase": 1,
"min": 0,
"show": true
}
],
"yaxis": {
"align": false
}
},
{
"collapsed": false,
"datasource": {
"uid": "$datasource"
},
"gridPos": {
"h": 1,
"w": 24,
"x": 0,
"y": 28
},
"id": 386,
"panels": [],
"targets": [
{
"datasource": {
"uid": "$datasource"
},
"refId": "A"
}
],
"title": "Sorts",
"type": "row"
},
{
"aliasColors": {},
"bars": false,
"dashLength": 10,
"dashes": false,
"datasource": {
"uid": "$datasource"
},
"decimals": 2,
"description": "**MySQL Sorts**\n\nDue to a query's structure, order, or other requirements, MySQL sorts the rows before returning them. For example, if a table is ordered 1 to 10 but you want the results reversed, MySQL then has to sort the rows to return 10 to 1.\n\nThis graph also shows when sorts had to scan a whole table or a given range of a table in order to return the results and which could not have been sorted via an index.",
"editable": true,
"error": false,
"fieldConfig": {
"defaults": {
"links": []
},
"overrides": []
},
"fill": 2,
"fillGradient": 0,
"grid": {},
"gridPos": {
"h": 7,
"w": 12,
"x": 0,
"y": 29
},
"hiddenSeries": false,
"id": 30,
"legend": {
"alignAsTable": true,
"avg": true,
"current": false,
"hideZero": true,
"max": true,
"min": true,
"rightSide": false,
"show": true,
"sort": "avg",
"sortDesc": true,
"total": false,
"values": true
},
"lines": true,
"linewidth": 2,
"links": [],
"nullPointMode": "null",
"options": {
"alertThreshold": true
},
"percentage": false,
"pluginVersion": "10.0.10",
"pointradius": 5,
"points": false,
"renderer": "flot",
"seriesOverrides": [],
"spaceLength": 10,
"stack": false,
"steppedLine": false,
"targets": [
{
"calculatedInterval": "2m",
"datasource": {
"uid": "$datasource"
},
"datasourceErrors": {},
"errors": {},
"expr": "sum(rate(mysql_global_status_sort_rows{job=~\"$job\", instance=~\"$instance\"}[$__rate_interval]))",
"format": "time_series",
"interval": "1m",
"intervalFactor": 1,
"legendFormat": "Sort Rows",
"metric": "",
"refId": "A",
"step": 20
},
{
"calculatedInterval": "2m",
"datasource": {
"uid": "$datasource"
},
"datasourceErrors": {},
"errors": {},
"expr": "sum(rate(mysql_global_status_sort_range{job=~\"$job\", instance=~\"$instance\"}[$__rate_interval]))",
"format": "time_series",
"interval": "1m",
"intervalFactor": 1,
"legendFormat": "Sort Range",
"metric": "",
"refId": "B",
"step": 20
},
{
"calculatedInterval": "2m",
"datasource": {
"uid": "$datasource"
},
"datasourceErrors": {},
"errors": {},
"expr": "sum(rate(mysql_global_status_sort_merge_passes{job=~\"$job\", instance=~\"$instance\"}[$__rate_interval]))",
"format": "time_series",
"interval": "1m",
"intervalFactor": 1,
"legendFormat": "Sort Merge Passes",
"metric": "",
"refId": "C",
"step": 20
},
{
"calculatedInterval": "2m",
"datasource": {
"uid": "$datasource"
},
"datasourceErrors": {},
"errors": {},
"expr": "sum(rate(mysql_global_status_sort_scan{job=~\"$job\", instance=~\"$instance\"}[$__rate_interval]))",
"format": "time_series",
"interval": "1m",
"intervalFactor": 1,
"legendFormat": "Sort Scan",
"metric": "",
"refId": "D",
"step": 20
}
],
"thresholds": [],
"timeRegions": [],
"title": "MySQL Sorts",
"tooltip": {
"msResolution": false,
"shared": true,
"sort": 0,
"value_type": "individual"
},
"type": "graph",
"xaxis": {
"mode": "time",
"show": true,
"values": []
},
"yaxes": [
{
"format": "short",
"logBase": 1,
"min": 0,
"show": true
},
{
"format": "short",
"logBase": 1,
"min": 0,
"show": true
}
],
"yaxis": {
"align": false
}
},
{
"aliasColors": {},
"bars": false,
"dashLength": 10,
"dashes": false,
"datasource": {
"uid": "$datasource"
},
"decimals": 2,
"description": "**MySQL Slow Queries**\n\nSlow queries are defined as queries being slower than the long_query_time setting. For example, if you have long_query_time set to 3, all queries that take longer than 3 seconds to complete will show on this graph.",
"editable": true,
"error": false,
"fieldConfig": {
"defaults": {
"links": []
},
"overrides": []
},
"fill": 2,
"fillGradient": 0,
"grid": {},
"gridPos": {
"h": 7,
"w": 12,
"x": 12,
"y": 29
},
"hiddenSeries": false,
"id": 48,
"legend": {
"alignAsTable": true,
"avg": true,
"current": false,
"max": true,
"min": true,
"show": true,
"sort": "avg",
"sortDesc": true,
"total": false,
"values": true
},
"lines": true,
"linewidth": 2,
"links": [],
"nullPointMode": "null",
"options": {
"alertThreshold": true
},
"percentage": false,
"pluginVersion": "10.0.10",
"pointradius": 5,
"points": false,
"renderer": "flot",
"seriesOverrides": [],
"spaceLength": 10,
"stack": false,
"steppedLine": false,
"targets": [
{
"calculatedInterval": "2m",
"datasource": {
"uid": "$datasource"
},
"datasourceErrors": {},
"errors": {},
"expr": "sum(rate(mysql_global_status_slow_queries{job=~\"$job\", instance=~\"$instance\"}[$__rate_interval]))",
"format": "time_series",
"interval": "1m",
"intervalFactor": 1,
"legendFormat": "Slow Queries",
"metric": "",
"refId": "A",
"step": 20
}
],
"thresholds": [],
"timeRegions": [],
"title": "MySQL Slow Queries",
"tooltip": {
"msResolution": false,
"shared": true,
"sort": 0,
"value_type": "cumulative"
},
"type": "graph",
"xaxis": {
"mode": "time",
"show": true,
"values": []
},
"yaxes": [
{
"format": "short",
"label": "",
"logBase": 1,
"min": 0,
"show": true
},
{
"format": "short",
"label": "",
"logBase": 1,
"min": 0,
"show": true
}
],
"yaxis": {
"align": false
}
},
{
"collapsed": false,
"datasource": {
"uid": "$datasource"
},
"gridPos": {
"h": 1,
"w": 24,
"x": 0,
"y": 36
},
"id": 387,
"panels": [],
"targets": [
{
"datasource": {
"uid": "$datasource"
},
"refId": "A"
}
],
"title": "Aborted",
"type": "row"
},
{
"aliasColors": {},
"bars": false,
"dashLength": 10,
"dashes": false,
"datasource": {
"uid": "$datasource"
},
"decimals": 2,
"description": "**Aborted Connections**\n\nWhen a given host connects to MySQL and the connection is interrupted in the middle (for example due to bad credentials), MySQL keeps that info in a system table (since 5.6 this table is exposed in performance_schema).\n\nIf the amount of failed requests without a successful connection reaches the value of max_connect_errors, mysqld assumes that something is wrong and blocks the host from further connection.\n\nTo allow connections from that host again, you need to issue the ``FLUSH HOSTS`` statement.",
"editable": true,
"error": false,
"fieldConfig": {
"defaults": {
"links": []
},
"overrides": []
},
"fill": 2,
"fillGradient": 0,
"grid": {},
"gridPos": {
"h": 7,
"w": 12,
"x": 0,
"y": 37
},
"hiddenSeries": false,
"id": 47,
"legend": {
"alignAsTable": true,
"avg": true,
"current": false,
"max": true,
"min": true,
"show": true,
"sort": "avg",
"sortDesc": true,
"total": false,
"values": true
},
"lines": true,
"linewidth": 2,
"links": [],
"nullPointMode": "null",
"options": {
"alertThreshold": true
},
"percentage": false,
"pluginVersion": "10.0.10",
"pointradius": 5,
"points": false,
"renderer": "flot",
"seriesOverrides": [],
"spaceLength": 10,
"stack": false,
"steppedLine": false,
"targets": [
{
"calculatedInterval": "2m",
"datasource": {
"uid": "$datasource"
},
"datasourceErrors": {},
"errors": {},
"expr": "sum(rate(mysql_global_status_aborted_connects{job=~\"$job\", instance=~\"$instance\"}[$__rate_interval]))",
"format": "time_series",
"interval": "1m",
"intervalFactor": 1,
"legendFormat": "Aborted Connects (attempts)",
"metric": "",
"refId": "A",
"step": 20
},
{
"calculatedInterval": "2m",
"datasource": {
"uid": "$datasource"
},
"datasourceErrors": {},
"errors": {},
"expr": "sum(rate(mysql_global_status_aborted_clients{job=~\"$job\", instance=~\"$instance\"}[$__rate_interval]))",
"format": "time_series",
"interval": "1m",
"intervalFactor": 1,
"legendFormat": "Aborted Clients (timeout)",
"metric": "",
"refId": "B",
"step": 20,
"target": ""
}
],
"thresholds": [],
"timeRegions": [],
"title": "MySQL Aborted Connections",
"tooltip": {
"msResolution": false,
"shared": true,
"sort": 0,
"value_type": "cumulative"
},
"type": "graph",
"xaxis": {
"mode": "time",
"show": true,
"values": []
},
"yaxes": [
{
"format": "short",
"label": "",
"logBase": 1,
"min": 0,
"show": true
},
{
"format": "short",
"label": "",
"logBase": 1,
"min": 0,
"show": true
}
],
"yaxis": {
"align": false
}
},
{
"aliasColors": {},
"bars": false,
"dashLength": 10,
"dashes": false,
"datasource": {
"uid": "$datasource"
},
"decimals": 2,
"description": "**Table Locks**\n\nMySQL takes a number of different locks for varying reasons. In this graph we see how many Table level locks MySQL has requested from the storage engine. In the case of InnoDB, many times the locks could actually be row locks as it only takes table level locks in a few specific cases.\n\nIt is most useful to compare Locks Immediate and Locks Waited. If Locks waited is rising, it means you have lock contention. Otherwise, Locks Immediate rising and falling is normal activity.",
"editable": true,
"error": false,
"fieldConfig": {
"defaults": {
"links": []
},
"overrides": []
},
"fill": 2,
"fillGradient": 0,
"grid": {},
"gridPos": {
"h": 7,
"w": 12,
"x": 12,
"y": 37
},
"hiddenSeries": false,
"id": 32,
"legend": {
"alignAsTable": true,
"avg": true,
"current": false,
"max": true,
"min": true,
"rightSide": false,
"show": true,
"sort": "avg",
"sortDesc": true,
"total": false,
"values": true
},
"lines": true,
"linewidth": 2,
"links": [],
"nullPointMode": "null",
"options": {
"alertThreshold": true
},
"percentage": false,
"pluginVersion": "10.0.10",
"pointradius": 5,
"points": false,
"renderer": "flot",
"seriesOverrides": [],
"spaceLength": 10,
"stack": false,
"steppedLine": false,
"targets": [
{
"calculatedInterval": "2m",
"datasource": {
"uid": "$datasource"
},
"datasourceErrors": {},
"errors": {},
"expr": "sum(rate(mysql_global_status_table_locks_immediate{job=~\"$job\", instance=~\"$instance\"}[$__rate_interval]))",
"format": "time_series",
"interval": "1m",
"intervalFactor": 1,
"legendFormat": "Table Locks Immediate",
"metric": "",
"refId": "A",
"step": 20
},
{
"calculatedInterval": "2m",
"datasource": {
"uid": "$datasource"
},
"datasourceErrors": {},
"errors": {},
"expr": "sum(rate(mysql_global_status_table_locks_waited{job=~\"$job\", instance=~\"$instance\"}[$__rate_interval]))",
"format": "time_series",
"interval": "1m",
"intervalFactor": 1,
"legendFormat": "Table Locks Waited",
"metric": "",
"refId": "B",
"step": 20
}
],
"thresholds": [],
"timeRegions": [],
"title": "MySQL Table Locks",
"tooltip": {
"msResolution": false,
"shared": true,
"sort": 0,
"value_type": "individual"
},
"type": "graph",
"xaxis": {
"mode": "time",
"show": true,
"values": []
},
"yaxes": [
{
"format": "short",
"logBase": 1,
"min": 0,
"show": true
},
{
"format": "short",
"logBase": 1,
"min": 0,
"show": true
}
],
"yaxis": {
"align": false
}
},
{
"collapsed": false,
"datasource": {
"uid": "$datasource"
},
"gridPos": {
"h": 1,
"w": 24,
"x": 0,
"y": 44
},
"id": 388,
"panels": [],
"targets": [
{
"datasource": {
"uid": "$datasource"
},
"refId": "A"
}
],
"title": "Network",
"type": "row"
},
{
"aliasColors": {},
"bars": false,
"dashLength": 10,
"dashes": false,
"datasource": {
"uid": "$datasource"
},
"decimals": 2,
"description": "**MySQL Network Traffic**\n\nHere we can see how much network traffic is generated by MySQL. Outbound is network traffic sent from MySQL and Inbound is network traffic MySQL has received.",
"editable": true,
"error": false,
"fieldConfig": {
"defaults": {
"links": []
},
"overrides": []
},
"fill": 6,
"fillGradient": 0,
"grid": {},
"gridPos": {
"h": 7,
"w": 24,
"x": 0,
"y": 45
},
"hiddenSeries": false,
"id": 9,
"legend": {
"alignAsTable": true,
"avg": true,
"current": false,
"max": true,
"min": true,
"rightSide": false,
"show": true,
"sort": "avg",
"sortDesc": true,
"total": false,
"values": true
},
"lines": true,
"linewidth": 2,
"links": [],
"nullPointMode": "null",
"options": {
"alertThreshold": true
},
"percentage": false,
"pluginVersion": "10.0.10",
"pointradius": 5,
"points": false,
"renderer": "flot",
"seriesOverrides": [],
"spaceLength": 10,
"stack": true,
"steppedLine": false,
"targets": [
{
"calculatedInterval": "2m",
"datasource": {
"uid": "$datasource"
},
"datasourceErrors": {},
"errors": {},
"expr": "sum(rate(mysql_global_status_bytes_received{job=~\"$job\", instance=~\"$instance\"}[$__rate_interval]))",
"format": "time_series",
"interval": "1m",
"intervalFactor": 1,
"legendFormat": "Inbound",
"metric": "",
"refId": "A",
"step": 20
},
{
"calculatedInterval": "2m",
"datasource": {
"uid": "$datasource"
},
"datasourceErrors": {},
"errors": {},
"expr": "sum(rate(mysql_global_status_bytes_sent{job=~\"$job\", instance=~\"$instance\"}[$__rate_interval]))",
"format": "time_series",
"interval": "1m",
"intervalFactor": 1,
"legendFormat": "Outbound",
"metric": "",
"refId": "B",
"step": 20
}
],
"thresholds": [],
"timeRegions": [],
"title": "MySQL Network Traffic",
"tooltip": {
"msResolution": false,
"shared": true,
"sort": 0,
"value_type": "individual"
},
"type": "graph",
"xaxis": {
"mode": "time",
"show": true,
"values": []
},
"yaxes": [
{
"format": "Bps",
"logBase": 1,
"min": 0,
"show": true
},
{
"format": "none",
"logBase": 1,
"min": 0,
"show": true
}
],
"yaxis": {
"align": false
}
},
{
"collapsed": false,
"datasource": {
"uid": "$datasource"
},
"gridPos": {
"h": 1,
"w": 24,
"x": 0,
"y": 52
},
"id": 389,
"panels": [],
"targets": [
{
"datasource": {
"uid": "$datasource"
},
"refId": "A"
}
],
"title": "Memory",
"type": "row"
},
{
"aliasColors": {},
"bars": false,
"dashLength": 10,
"dashes": false,
"datasource": {
"uid": "$datasource"
},
"decimals": 0,
"description": "***System Memory***: Total Memory for the system.\\\n***InnoDB Buffer Pool Data***: InnoDB maintains a storage area called the buffer pool for caching data and indexes in memory.\\\n***TokuDB Cache Size***: Similar in function to the InnoDB Buffer Pool, TokuDB will allocate 50% of the installed RAM for its own cache.\\\n***Key Buffer Size***: Index blocks for MYISAM tables are buffered and are shared by all threads. key_buffer_size is the size of the buffer used for index blocks.\\\n***Adaptive Hash Index Size***: When InnoDB notices that some index values are being accessed very frequently, it builds a hash index for them in memory on top of B-Tree indexes.\\\n ***Query Cache Size***: The query cache stores the text of a SELECT statement together with the corresponding result that was sent to the client. The query cache has huge scalability problems in that only one thread can do an operation in the query cache at the same time.\\\n***InnoDB Dictionary Size***: The data dictionary is InnoDB ‘s internal catalog of tables. InnoDB stores the data dictionary on disk, and loads entries into memory while the server is running.\\\n***InnoDB Log Buffer Size***: The MySQL InnoDB log buffer allows transactions to run without having to write the log to disk before the transactions commit.",
"editable": true,
"error": false,
"fieldConfig": {
"defaults": {
"links": []
},
"overrides": []
},
"fill": 6,
"fillGradient": 0,
"grid": {},
"gridPos": {
"h": 7,
"w": 24,
"x": 0,
"y": 53
},
"hiddenSeries": false,
"id": 50,
"legend": {
"alignAsTable": true,
"avg": true,
"current": false,
"hideEmpty": true,
"hideZero": true,
"max": true,
"min": true,
"rightSide": true,
"show": true,
"sort": "avg",
"sortDesc": true,
"total": false,
"values": true
},
"lines": true,
"linewidth": 2,
"links": [
{
"title": "Detailed descriptions about metrics",
"url": "https://www.percona.com/doc/percona-monitoring-and-management/dashboard.mysql-overview.html#mysql-internal-memory-overview"
}
],
"nullPointMode": "null",
"options": {
"alertThreshold": true
},
"percentage": false,
"pluginVersion": "10.0.10",
"pointradius": 5,
"points": false,
"renderer": "flot",
"seriesOverrides": [
{
"alias": "System Memory",
"fill": 0,
"stack": false
}
],
"spaceLength": 10,
"stack": true,
"steppedLine": false,
"targets": [
{
"datasource": {
"uid": "$datasource"
},
"expr": "sum(mysql_global_status_innodb_page_size{job=~\"$job\", instance=~\"$instance\"} * on (instance) mysql_global_status_buffer_pool_pages{job=~\"$job\", instance=~\"$instance\", state=\"data\"})",
"format": "time_series",
"hide": false,
"interval": "1m",
"intervalFactor": 1,
"legendFormat": "InnoDB Buffer Pool Data",
"refId": "A",
"step": 20
},
{
"datasource": {
"uid": "$datasource"
},
"expr": "sum(mysql_global_variables_innodb_log_buffer_size{job=~\"$job\", instance=~\"$instance\"})",
"format": "time_series",
"interval": "1m",
"intervalFactor": 1,
"legendFormat": "InnoDB Log Buffer Size",
"refId": "D",
"step": 20
},
{
"datasource": {
"uid": "$datasource"
},
"expr": "sum(mysql_global_variables_innodb_additional_mem_pool_size{job=~\"$job\", instance=~\"$instance\"})",
"format": "time_series",
"interval": "1m",
"intervalFactor": 2,
"legendFormat": "InnoDB Additional Memory Pool Size",
"refId": "H",
"step": 40
},
{
"datasource": {
"uid": "$datasource"
},
"expr": "sum(mysql_global_status_innodb_mem_dictionary{job=~\"$job\", instance=~\"$instance\"})",
"format": "time_series",
"interval": "1m",
"intervalFactor": 1,
"legendFormat": "InnoDB Dictionary Size",
"refId": "F",
"step": 20
},
{
"datasource": {
"uid": "$datasource"
},
"expr": "sum(mysql_global_variables_key_buffer_size{job=~\"$job\", instance=~\"$instance\"})",
"format": "time_series",
"interval": "1m",
"intervalFactor": 1,
"legendFormat": "Key Buffer Size",
"refId": "B",
"step": 20
},
{
"datasource": {
"uid": "$datasource"
},
"expr": "sum(mysql_global_variables_query_cache_size{job=~\"$job\", instance=~\"$instance\"})",
"format": "time_series",
"interval": "1m",
"intervalFactor": 1,
"legendFormat": "Query Cache Size",
"refId": "C",
"step": 20
},
{
"datasource": {
"uid": "$datasource"
},
"expr": "sum(mysql_global_status_innodb_mem_adaptive_hash{job=~\"$job\", instance=~\"$instance\"})",
"format": "time_series",
"interval": "1m",
"intervalFactor": 1,
"legendFormat": "Adaptive Hash Index Size",
"refId": "E",
"step": 20
},
{
"datasource": {
"uid": "$datasource"
},
"expr": "sum(mysql_global_variables_tokudb_cache_size{job=~\"$job\", instance=~\"$instance\"})",
"format": "time_series",
"interval": "1m",
"intervalFactor": 1,
"legendFormat": "TokuDB Cache Size",
"refId": "I",
"step": 20
}
],
"thresholds": [],
"timeRegions": [],
"title": "MySQL Internal Memory Overview",
"tooltip": {
"msResolution": false,
"shared": true,
"sort": 0,
"value_type": "individual"
},
"type": "graph",
"xaxis": {
"mode": "time",
"show": true,
"values": []
},
"yaxes": [
{
"format": "bytes",
"label": "",
"logBase": 1,
"min": 0,
"show": true
},
{
"format": "short",
"logBase": 1,
"show": true
}
],
"yaxis": {
"align": false
}
},
{
"collapsed": false,
"datasource": {
"uid": "$datasource"
},
"gridPos": {
"h": 1,
"w": 24,
"x": 0,
"y": 60
},
"id": 390,
"panels": [],
"targets": [
{
"datasource": {
"uid": "$datasource"
},
"refId": "A"
}
],
"title": "Command, Handlers, Processes",
"type": "row"
},
{
"aliasColors": {},
"bars": false,
"dashLength": 10,
"dashes": false,
"datasource": {
"uid": "$datasource"
},
"decimals": 2,
"description": "**Top Command Counters**\n\nThe Com_{{xxx}} statement counter variables indicate the number of times each xxx statement has been executed. There is one status variable for each type of statement. For example, Com_delete and Com_update count [``DELETE``](https://dev.mysql.com/doc/refman/5.7/en/delete.html) and [``UPDATE``](https://dev.mysql.com/doc/refman/5.7/en/update.html) statements, respectively. Com_delete_multi and Com_update_multi are similar but apply to [``DELETE``](https://dev.mysql.com/doc/refman/5.7/en/delete.html) and [``UPDATE``](https://dev.mysql.com/doc/refman/5.7/en/update.html) statements that use multiple-table syntax.",
"editable": true,
"error": false,
"fieldConfig": {
"defaults": {
"links": []
},
"overrides": []
},
"fill": 2,
"fillGradient": 0,
"grid": {},
"gridPos": {
"h": 7,
"w": 24,
"x": 0,
"y": 61
},
"hiddenSeries": false,
"id": 14,
"legend": {
"alignAsTable": true,
"avg": true,
"current": false,
"hideEmpty": false,
"hideZero": false,
"max": true,
"min": true,
"rightSide": true,
"show": true,
"sort": "avg",
"sortDesc": true,
"total": false,
"values": true
},
"lines": true,
"linewidth": 2,
"links": [
{
"title": "Server Status Variables (Com_xxx)",
"url": "https://dev.mysql.com/doc/refman/5.7/en/server-status-variables.html#statvar_Com_xxx"
}
],
"nullPointMode": "null as zero",
"options": {
"alertThreshold": true
},
"percentage": false,
"pluginVersion": "10.0.10",
"pointradius": 5,
"points": false,
"renderer": "flot",
"seriesOverrides": [],
"spaceLength": 10,
"stack": false,
"steppedLine": false,
"targets": [
{
"calculatedInterval": "2m",
"datasource": {
"uid": "$datasource"
},
"datasourceErrors": {},
"errors": {},
"expr": "topk(5, rate(mysql_global_status_commands_total{job=~\"$job\", instance=~\"$instance\"}[$__rate_interval])>0)",
"format": "time_series",
"hide": false,
"interval": "1m",
"intervalFactor": 1,
"legendFormat": "Com_{{ command }}",
"metric": "",
"refId": "B",
"step": 20
}
],
"thresholds": [],
"timeRegions": [],
"title": "Top Command Counters",
"tooltip": {
"msResolution": false,
"shared": true,
"sort": 0,
"value_type": "individual"
},
"type": "graph",
"xaxis": {
"mode": "time",
"show": true,
"values": []
},
"yaxes": [
{
"format": "short",
"logBase": 1,
"min": 0,
"show": true
},
{
"format": "short",
"logBase": 1,
"min": 0,
"show": true
}
],
"yaxis": {
"align": false
}
},
{
"aliasColors": {},
"bars": false,
"dashLength": 10,
"dashes": false,
"datasource": {
"type": "prometheus",
"uid": "$datasource"
},
"decimals": 2,
"description": "**MySQL Handlers**\n\nHandler statistics are internal statistics on how MySQL is selecting, updating, inserting, and modifying rows, tables, and indexes.\n\nThis is in fact the layer between the Storage Engine and MySQL.\n\n* `read_rnd_next` is incremented when the server performs a full table scan and this is a counter you don't really want to see with a high value.\n* `read_key` is incremented when a read is done with an index.\n* `read_next` is incremented when the storage engine is asked to 'read the next index entry'. A high value means a lot of index scans are being done.",
"editable": true,
"error": false,
"fieldConfig": {
"defaults": {
"links": []
},
"overrides": []
},
"fill": 2,
"fillGradient": 0,
"grid": {},
"gridPos": {
"h": 7,
"w": 24,
"x": 0,
"y": 68
},
"hiddenSeries": false,
"id": 8,
"legend": {
"alignAsTable": true,
"avg": true,
"current": false,
"hideZero": true,
"max": true,
"min": true,
"rightSide": true,
"show": true,
"sort": "avg",
"sortDesc": true,
"total": false,
"values": true
},
"lines": true,
"linewidth": 2,
"links": [],
"nullPointMode": "null",
"options": {
"alertThreshold": true
},
"percentage": false,
"pluginVersion": "10.0.10",
"pointradius": 5,
"points": false,
"renderer": "flot",
"seriesOverrides": [],
"spaceLength": 10,
"stack": false,
"steppedLine": false,
"targets": [
{
"calculatedInterval": "2m",
"datasource": {
"uid": "$datasource"
},
"datasourceErrors": {},
"editorMode": "builder",
"errors": {},
"expr": "rate(mysql_global_status_handlers_total{instance=~\"mysql_master:3306|mysql_slave:3306\", handler!~\"commit|rollback|savepoint.*|prepare\"}[$__rate_interval])",
"format": "time_series",
"interval": "1m",
"intervalFactor": 1,
"legendFormat": "{{ handler }}",
"metric": "",
"range": true,
"refId": "J",
"step": 20
}
],
"thresholds": [],
"timeRegions": [],
"title": "MySQL Handlers",
"tooltip": {
"msResolution": false,
"shared": true,
"sort": 0,
"value_type": "individual"
},
"type": "graph",
"xaxis": {
"mode": "time",
"show": true,
"values": []
},
"yaxes": [
{
"format": "short",
"logBase": 1,
"min": 0,
"show": true
},
{
"format": "short",
"logBase": 1,
"min": 0,
"show": true
}
],
"yaxis": {
"align": false
}
},
{
"aliasColors": {},
"bars": false,
"dashLength": 10,
"dashes": false,
"datasource": {
"type": "prometheus",
"uid": "$datasource"
},
"decimals": 2,
"editable": true,
"error": false,
"fieldConfig": {
"defaults": {
"links": []
},
"overrides": []
},
"fill": 2,
"fillGradient": 0,
"grid": {},
"gridPos": {
"h": 7,
"w": 24,
"x": 0,
"y": 75
},
"hiddenSeries": false,
"id": 28,
"legend": {
"alignAsTable": true,
"avg": true,
"current": false,
"hideZero": true,
"max": true,
"min": true,
"rightSide": true,
"show": true,
"sort": "avg",
"sortDesc": true,
"total": false,
"values": true
},
"lines": true,
"linewidth": 2,
"links": [],
"nullPointMode": "null",
"options": {
"alertThreshold": true
},
"percentage": false,
"pluginVersion": "10.0.10",
"pointradius": 5,
"points": false,
"renderer": "flot",
"seriesOverrides": [],
"spaceLength": 10,
"stack": false,
"steppedLine": false,
"targets": [
{
"calculatedInterval": "2m",
"datasource": {
"uid": "$datasource"
},
"datasourceErrors": {},
"editorMode": "builder",
"errors": {},
"expr": "rate(mysql_global_status_handlers_total{instance=~\"mysql_master:3306|mysql_slave:3306\", handler=~\"commit|rollback|savepoint.*|prepare\"}[$__rate_interval])",
"interval": "1m",
"intervalFactor": 1,
"legendFormat": "{{ handler }}",
"metric": "",
"range": true,
"refId": "A",
"step": 20
}
],
"thresholds": [],
"timeRegions": [],
"title": "MySQL Transaction Handlers",
"tooltip": {
"msResolution": false,
"shared": true,
"sort": 0,
"value_type": "individual"
},
"type": "graph",
"xaxis": {
"mode": "time",
"show": true,
"values": []
},
"yaxes": [
{
"format": "short",
"logBase": 1,
"min": 0,
"show": true
},
{
"format": "short",
"logBase": 1,
"min": 0,
"show": true
}
],
"yaxis": {
"align": false
}
},
{
"aliasColors": {},
"bars": false,
"dashLength": 10,
"dashes": false,
"datasource": {
"type": "prometheus",
"uid": "$datasource"
},
"decimals": 2,
"editable": true,
"error": false,
"fieldConfig": {
"defaults": {
"links": []
},
"overrides": []
},
"fill": 0,
"fillGradient": 0,
"grid": {},
"gridPos": {
"h": 7,
"w": 24,
"x": 0,
"y": 82
},
"hiddenSeries": false,
"id": 40,
"legend": {
"alignAsTable": true,
"avg": true,
"current": false,
"hideZero": true,
"max": true,
"min": false,
"rightSide": true,
"show": true,
"sort": "avg",
"sortDesc": true,
"total": false,
"values": true
},
"lines": true,
"linewidth": 2,
"links": [],
"nullPointMode": "null as zero",
"options": {
"alertThreshold": true
},
"percentage": false,
"pluginVersion": "10.0.10",
"pointradius": 5,
"points": false,
"renderer": "flot",
"seriesOverrides": [],
"spaceLength": 10,
"stack": false,
"steppedLine": false,
"targets": [
{
"calculatedInterval": "2m",
"datasource": {
"uid": "$datasource"
},
"datasourceErrors": {},
"editorMode": "builder",
"errors": {},
"expr": "mysql_info_schema_processlist_threads{job=~\"$job\", instance=~\"mysql_master:3306|mysql_slave:3306\"}",
"format": "time_series",
"interval": "1m",
"intervalFactor": 1,
"legendFormat": "{{ state }}",
"metric": "",
"range": true,
"refId": "A",
"step": 20
}
],
"thresholds": [],
"timeRegions": [],
"title": "Process States",
"tooltip": {
"msResolution": false,
"shared": true,
"sort": 0,
"value_type": "individual"
},
"type": "graph",
"xaxis": {
"mode": "time",
"show": true,
"values": []
},
"yaxes": [
{
"format": "short",
"logBase": 1,
"min": 0,
"show": true
},
{
"format": "short",
"logBase": 1,
"min": 0,
"show": true
}
],
"yaxis": {
"align": false
}
},
{
"aliasColors": {},
"bars": true,
"dashLength": 10,
"dashes": false,
"datasource": {
"type": "prometheus",
"uid": "$datasource"
},
"decimals": 2,
"editable": true,
"error": false,
"fieldConfig": {
"defaults": {
"links": []
},
"overrides": []
},
"fill": 6,
"fillGradient": 0,
"grid": {},
"gridPos": {
"h": 7,
"w": 24,
"x": 0,
"y": 89
},
"hiddenSeries": false,
"id": 49,
"legend": {
"alignAsTable": true,
"avg": true,
"current": false,
"hideZero": true,
"max": true,
"min": false,
"rightSide": true,
"show": true,
"sort": "avg",
"sortDesc": true,
"total": false,
"values": true
},
"lines": false,
"linewidth": 2,
"links": [],
"nullPointMode": "null",
"options": {
"alertThreshold": true
},
"percentage": false,
"pluginVersion": "10.0.10",
"pointradius": 5,
"points": false,
"renderer": "flot",
"seriesOverrides": [],
"spaceLength": 10,
"stack": true,
"steppedLine": false,
"targets": [
{
"calculatedInterval": "2m",
"datasource": {
"uid": "$datasource"
},
"datasourceErrors": {},
"editorMode": "code",
"errors": {},
"expr": "topk(5, avg_over_time(mysql_info_schema_processlist_threads{job=~\"$job\", instance=~\"$instance\"}[1h]))",
"interval": "1m",
"intervalFactor": 1,
"legendFormat": "{{ state }}",
"metric": "",
"range": true,
"refId": "A",
"step": 3600
}
],
"thresholds": [],
"timeFrom": "24h",
"timeRegions": [],
"title": "Top Process States Hourly",
"tooltip": {
"msResolution": false,
"shared": true,
"sort": 0,
"value_type": "individual"
},
"type": "graph",
"xaxis": {
"mode": "time",
"show": true,
"values": []
},
"yaxes": [
{
"format": "short",
"logBase": 1,
"min": 0,
"show": true
},
{
"format": "short",
"logBase": 1,
"min": 0,
"show": true
}
],
"yaxis": {
"align": false
}
},
{
"collapsed": false,
"datasource": {
"uid": "$datasource"
},
"gridPos": {
"h": 1,
"w": 24,
"x": 0,
"y": 96
},
"id": 391,
"panels": [],
"targets": [
{
"datasource": {
"uid": "$datasource"
},
"refId": "A"
}
],
"title": "Query Cache",
"type": "row"
},
{
"aliasColors": {},
"bars": false,
"dashLength": 10,
"dashes": false,
"datasource": {
"uid": "$datasource"
},
"decimals": 2,
"description": "**MySQL Query Cache Memory**\n\nThe query cache has huge scalability problems in that only one thread can do an operation in the query cache at the same time. This serialization is true not only for SELECTs, but also for INSERT/UPDATE/DELETE.\n\nThis also means that the larger the `query_cache_size` is set to, the slower those operations become. In concurrent environments, the MySQL Query Cache quickly becomes a contention point, decreasing performance. MariaDB and AWS Aurora have done work to try and eliminate the query cache contention in their flavors of MySQL, while MySQL 8.0 has eliminated the query cache feature.\n\nThe recommended settings for most environments is to set:\n ``query_cache_type=0``\n ``query_cache_size=0``\n\nNote that while you can dynamically change these values, to completely remove the contention point you have to restart the database.",
"editable": true,
"error": false,
"fieldConfig": {
"defaults": {
"links": []
},
"overrides": []
},
"fill": 2,
"fillGradient": 0,
"grid": {},
"gridPos": {
"h": 7,
"w": 12,
"x": 0,
"y": 97
},
"hiddenSeries": false,
"id": 46,
"legend": {
"alignAsTable": true,
"avg": true,
"current": false,
"max": true,
"min": true,
"rightSide": false,
"show": true,
"sort": "avg",
"sortDesc": true,
"total": false,
"values": true
},
"lines": true,
"linewidth": 2,
"links": [],
"nullPointMode": "null",
"options": {
"alertThreshold": true
},
"percentage": false,
"pluginVersion": "10.0.10",
"pointradius": 5,
"points": false,
"renderer": "flot",
"seriesOverrides": [],
"spaceLength": 10,
"stack": false,
"steppedLine": false,
"targets": [
{
"calculatedInterval": "2m",
"datasource": {
"uid": "$datasource"
},
"datasourceErrors": {},
"errors": {},
"expr": "mysql_global_status_qcache_free_memory{job=~\"$job\", instance=~\"$instance\"}",
"format": "time_series",
"interval": "1m",
"intervalFactor": 1,
"legendFormat": "Free Memory",
"metric": "",
"refId": "F",
"step": 20
},
{
"calculatedInterval": "2m",
"datasource": {
"uid": "$datasource"
},
"datasourceErrors": {},
"errors": {},
"expr": "mysql_global_variables_query_cache_size{job=~\"$job\", instance=~\"$instance\"}",
"format": "time_series",
"interval": "1m",
"intervalFactor": 1,
"legendFormat": "Query Cache Size",
"metric": "",
"refId": "E",
"step": 20
}
],
"thresholds": [],
"timeRegions": [],
"title": "MySQL Query Cache Memory",
"tooltip": {
"msResolution": false,
"shared": true,
"sort": 0,
"value_type": "individual"
},
"type": "graph",
"xaxis": {
"mode": "time",
"show": true,
"values": []
},
"yaxes": [
{
"format": "bytes",
"logBase": 1,
"min": 0,
"show": true
},
{
"format": "short",
"logBase": 1,
"min": 0,
"show": true
}
],
"yaxis": {
"align": false
}
},
{
"aliasColors": {},
"bars": false,
"dashLength": 10,
"dashes": false,
"datasource": {
"uid": "$datasource"
},
"decimals": 2,
"description": "**MySQL Query Cache Activity**\n\nThe query cache has huge scalability problems in that only one thread can do an operation in the query cache at the same time. This serialization is true not only for SELECTs, but also for INSERT/UPDATE/DELETE.\n\nThis also means that the larger the `query_cache_size` is set to, the slower those operations become. In concurrent environments, the MySQL Query Cache quickly becomes a contention point, decreasing performance. MariaDB and AWS Aurora have done work to try and eliminate the query cache contention in their flavors of MySQL, while MySQL 8.0 has eliminated the query cache feature.\n\nThe recommended settings for most environments is to set:\n``query_cache_type=0``\n``query_cache_size=0``\n\nNote that while you can dynamically change these values, to completely remove the contention point you have to restart the database.",
"editable": true,
"error": false,
"fieldConfig": {
"defaults": {
"links": []
},
"overrides": []
},
"fill": 2,
"fillGradient": 0,
"grid": {},
"gridPos": {
"h": 7,
"w": 12,
"x": 12,
"y": 97
},
"height": "",
"hiddenSeries": false,
"id": 45,
"legend": {
"alignAsTable": true,
"avg": true,
"current": false,
"max": true,
"min": true,
"rightSide": false,
"show": true,
"sort": "avg",
"sortDesc": true,
"total": false,
"values": true
},
"lines": true,
"linewidth": 2,
"links": [],
"nullPointMode": "null",
"options": {
"alertThreshold": true
},
"percentage": false,
"pluginVersion": "10.0.10",
"pointradius": 5,
"points": false,
"renderer": "flot",
"seriesOverrides": [],
"spaceLength": 10,
"stack": false,
"steppedLine": false,
"targets": [
{
"calculatedInterval": "2m",
"datasource": {
"uid": "$datasource"
},
"datasourceErrors": {},
"errors": {},
"expr": "rate(mysql_global_status_qcache_hits{job=~\"$job\", instance=~\"$instance\"}[$__rate_interval])",
"format": "time_series",
"interval": "1m",
"intervalFactor": 1,
"legendFormat": "Hits",
"metric": "",
"refId": "B",
"step": 20
},
{
"calculatedInterval": "2m",
"datasource": {
"uid": "$datasource"
},
"datasourceErrors": {},
"errors": {},
"expr": "rate(mysql_global_status_qcache_inserts{job=~\"$job\", instance=~\"$instance\"}[$__rate_interval])",
"format": "time_series",
"interval": "1m",
"intervalFactor": 1,
"legendFormat": "Inserts",
"metric": "",
"refId": "C",
"step": 20
},
{
"calculatedInterval": "2m",
"datasource": {
"uid": "$datasource"
},
"datasourceErrors": {},
"errors": {},
"expr": "rate(mysql_global_status_qcache_not_cached{job=~\"$job\", instance=~\"$instance\"}[$__rate_interval])",
"format": "time_series",
"interval": "1m",
"intervalFactor": 1,
"legendFormat": "Not Cached",
"metric": "",
"refId": "D",
"step": 20
},
{
"calculatedInterval": "2m",
"datasource": {
"uid": "$datasource"
},
"datasourceErrors": {},
"errors": {},
"expr": "rate(mysql_global_status_qcache_lowmem_prunes{job=~\"$job\", instance=~\"$instance\"}[$__rate_interval])",
"format": "time_series",
"interval": "1m",
"intervalFactor": 1,
"legendFormat": "Prunes",
"metric": "",
"refId": "F",
"step": 20
},
{
"calculatedInterval": "2m",
"datasource": {
"uid": "$datasource"
},
"datasourceErrors": {},
"errors": {},
"expr": "mysql_global_status_qcache_queries_in_cache{job=~\"$job\", instance=~\"$instance\"}",
"format": "time_series",
"interval": "1m",
"intervalFactor": 1,
"legendFormat": "Queries in Cache",
"metric": "",
"refId": "E",
"step": 20
}
],
"thresholds": [],
"timeRegions": [],
"title": "MySQL Query Cache Activity",
"tooltip": {
"msResolution": false,
"shared": true,
"sort": 0,
"value_type": "individual"
},
"type": "graph",
"xaxis": {
"mode": "time",
"show": true,
"values": []
},
"yaxes": [
{
"format": "short",
"logBase": 1,
"min": 0,
"show": true
},
{
"format": "short",
"logBase": 1,
"min": 0,
"show": true
}
],
"yaxis": {
"align": false
}
},
{
"collapsed": false,
"datasource": {
"uid": "$datasource"
},
"gridPos": {
"h": 1,
"w": 24,
"x": 0,
"y": 104
},
"id": 392,
"panels": [],
"targets": [
{
"datasource": {
"uid": "$datasource"
},
"refId": "A"
}
],
"title": "Files and Tables",
"type": "row"
},
{
"aliasColors": {},
"bars": false,
"dashLength": 10,
"dashes": false,
"datasource": {
"uid": "$datasource"
},
"decimals": 2,
"editable": true,
"error": false,
"fieldConfig": {
"defaults": {
"links": []
},
"overrides": []
},
"fill": 2,
"fillGradient": 0,
"grid": {},
"gridPos": {
"h": 7,
"w": 12,
"x": 0,
"y": 105
},
"hiddenSeries": false,
"id": 43,
"legend": {
"alignAsTable": true,
"avg": true,
"current": false,
"max": true,
"min": true,
"rightSide": false,
"show": true,
"sort": "avg",
"sortDesc": true,
"total": false,
"values": true
},
"lines": true,
"linewidth": 2,
"links": [],
"nullPointMode": "null",
"options": {
"alertThreshold": true
},
"percentage": false,
"pluginVersion": "10.0.10",
"pointradius": 5,
"points": false,
"renderer": "flot",
"seriesOverrides": [],
"spaceLength": 10,
"stack": false,
"steppedLine": false,
"targets": [
{
"calculatedInterval": "2m",
"datasource": {
"uid": "$datasource"
},
"datasourceErrors": {},
"errors": {},
"expr": "rate(mysql_global_status_opened_files{job=~\"$job\", instance=~\"$instance\"}[$__rate_interval])",
"interval": "1m",
"intervalFactor": 1,
"legendFormat": "Openings",
"metric": "",
"refId": "A",
"step": 20
}
],
"thresholds": [],
"timeRegions": [],
"title": "MySQL File Openings",
"tooltip": {
"msResolution": false,
"shared": true,
"sort": 0,
"value_type": "individual"
},
"type": "graph",
"xaxis": {
"mode": "time",
"show": true,
"values": []
},
"yaxes": [
{
"format": "short",
"logBase": 1,
"min": 0,
"show": true
},
{
"format": "short",
"logBase": 1,
"min": 0,
"show": true
}
],
"yaxis": {
"align": false
}
},
{
"aliasColors": {},
"bars": false,
"dashLength": 10,
"dashes": false,
"datasource": {
"uid": "$datasource"
},
"decimals": 2,
"editable": true,
"error": false,
"fieldConfig": {
"defaults": {
"links": []
},
"overrides": []
},
"fill": 2,
"fillGradient": 0,
"grid": {},
"gridPos": {
"h": 7,
"w": 12,
"x": 12,
"y": 105
},
"hiddenSeries": false,
"id": 41,
"legend": {
"alignAsTable": true,
"avg": true,
"current": false,
"max": true,
"min": true,
"rightSide": false,
"show": true,
"sort": "avg",
"sortDesc": true,
"total": false,
"values": true
},
"lines": true,
"linewidth": 2,
"links": [],
"nullPointMode": "null",
"options": {
"alertThreshold": true
},
"percentage": false,
"pluginVersion": "10.0.10",
"pointradius": 5,
"points": false,
"renderer": "flot",
"seriesOverrides": [],
"spaceLength": 10,
"stack": false,
"steppedLine": false,
"targets": [
{
"calculatedInterval": "2m",
"datasource": {
"uid": "$datasource"
},
"datasourceErrors": {},
"errors": {},
"expr": "mysql_global_status_open_files{job=~\"$job\", instance=~\"$instance\"}",
"interval": "1m",
"intervalFactor": 1,
"legendFormat": "Open Files",
"metric": "",
"refId": "A",
"step": 20
},
{
"calculatedInterval": "2m",
"datasource": {
"uid": "$datasource"
},
"datasourceErrors": {},
"errors": {},
"expr": "mysql_global_variables_open_files_limit{job=~\"$job\", instance=~\"$instance\"}",
"interval": "1m",
"intervalFactor": 1,
"legendFormat": "Open Files Limit",
"metric": "",
"refId": "D",
"step": 20
},
{
"datasource": {
"uid": "$datasource"
},
"expr": "mysql_global_status_innodb_num_open_files{job=~\"$job\", instance=~\"$instance\"}",
"interval": "1m",
"intervalFactor": 1,
"legendFormat": "InnoDB Open Files",
"refId": "B",
"step": 20
}
],
"thresholds": [],
"timeRegions": [],
"title": "MySQL Open Files",
"tooltip": {
"msResolution": false,
"shared": true,
"sort": 0,
"value_type": "individual"
},
"type": "graph",
"xaxis": {
"mode": "time",
"show": true,
"values": []
},
"yaxes": [
{
"format": "short",
"logBase": 1,
"min": 0,
"show": true
},
{
"format": "short",
"logBase": 1,
"min": 0,
"show": true
}
],
"yaxis": {
"align": false
}
},
{
"collapsed": false,
"datasource": {
"uid": "$datasource"
},
"gridPos": {
"h": 1,
"w": 24,
"x": 0,
"y": 112
},
"id": 393,
"panels": [],
"targets": [
{
"datasource": {
"uid": "$datasource"
},
"refId": "A"
}
],
"title": "Table Openings",
"type": "row"
},
{
"aliasColors": {},
"bars": false,
"dashLength": 10,
"dashes": false,
"datasource": {
"uid": "$datasource"
},
"decimals": 2,
"description": "**MySQL Table Open Cache Status**\n\nThe recommendation is to set the `table_open_cache_instances` to a loose correlation to virtual CPUs, keeping in mind that more instances means the cache is split more times. If you have a cache set to 500 but it has 10 instances, each cache will only have 50 cached.\n\nThe `table_definition_cache` and `table_open_cache` can be left as default as they are auto-sized MySQL 5.6 and above (ie: do not set them to any value).",
"editable": true,
"error": false,
"fieldConfig": {
"defaults": {
"links": []
},
"overrides": []
},
"fill": 2,
"fillGradient": 0,
"grid": {},
"gridPos": {
"h": 7,
"w": 12,
"x": 0,
"y": 113
},
"hiddenSeries": false,
"id": 44,
"legend": {
"alignAsTable": true,
"avg": true,
"current": false,
"max": true,
"min": true,
"rightSide": false,
"show": true,
"sort": "avg",
"sortDesc": true,
"total": false,
"values": true
},
"lines": true,
"linewidth": 2,
"links": [
{
"title": "Server Status Variables (table_open_cache)",
"url": "http://dev.mysql.com/doc/refman/5.6/en/server-system-variables.html#sysvar_table_open_cache"
}
],
"nullPointMode": "null",
"options": {
"alertThreshold": true
},
"percentage": false,
"pluginVersion": "10.0.10",
"pointradius": 5,
"points": false,
"renderer": "flot",
"seriesOverrides": [
{
"alias": "Table Open Cache Hit Ratio",
"yaxis": 2
}
],
"spaceLength": 10,
"stack": false,
"steppedLine": false,
"targets": [
{
"calculatedInterval": "2m",
"datasource": {
"uid": "$datasource"
},
"datasourceErrors": {},
"errors": {},
"expr": "rate(mysql_global_status_opened_tables{job=~\"$job\", instance=~\"$instance\"}[$__rate_interval])",
"format": "time_series",
"interval": "1m",
"intervalFactor": 1,
"legendFormat": "Openings",
"metric": "",
"refId": "A",
"step": 20
},
{
"datasource": {
"uid": "$datasource"
},
"expr": "rate(mysql_global_status_table_open_cache_hits{job=~\"$job\", instance=~\"$instance\"}[$__rate_interval])",
"format": "time_series",
"interval": "1m",
"intervalFactor": 1,
"legendFormat": "Hits",
"refId": "B",
"step": 20
},
{
"datasource": {
"uid": "$datasource"
},
"expr": "rate(mysql_global_status_table_open_cache_misses{job=~\"$job\", instance=~\"$instance\"}[$__rate_interval])",
"format": "time_series",
"interval": "1m",
"intervalFactor": 1,
"legendFormat": "Misses",
"refId": "C",
"step": 20
},
{
"datasource": {
"uid": "$datasource"
},
"expr": "rate(mysql_global_status_table_open_cache_overflows{job=~\"$job\", instance=~\"$instance\"}[$__rate_interval])",
"format": "time_series",
"interval": "1m",
"intervalFactor": 1,
"legendFormat": "Misses due to Overflows",
"refId": "D",
"step": 20
},
{
"datasource": {
"uid": "$datasource"
},
"expr": "rate(mysql_global_status_table_open_cache_hits{job=~\"$job\", instance=~\"$instance\"}[$__rate_interval])/(rate(mysql_global_status_table_open_cache_hits{job=~\"$job\", instance=~\"$instance\"}[$__rate_interval])+rate(mysql_global_status_table_open_cache_misses{job=~\"$job\", instance=~\"$instance\"}[$__rate_interval]))",
"format": "time_series",
"interval": "1m",
"intervalFactor": 1,
"legendFormat": "Table Open Cache Hit Ratio",
"refId": "E",
"step": 20
}
],
"thresholds": [],
"timeRegions": [],
"title": "MySQL Table Open Cache Status",
"tooltip": {
"msResolution": false,
"shared": true,
"sort": 0,
"value_type": "individual"
},
"type": "graph",
"xaxis": {
"mode": "time",
"show": true,
"values": []
},
"yaxes": [
{
"format": "short",
"logBase": 1,
"min": 0,
"show": true
},
{
"format": "percentunit",
"logBase": 1,
"min": 0,
"show": true
}
],
"yaxis": {
"align": false
}
},
{
"aliasColors": {},
"bars": false,
"dashLength": 10,
"dashes": false,
"datasource": {
"uid": "$datasource"
},
"decimals": 2,
"description": "**MySQL Open Tables**\n\nThe recommendation is to set the `table_open_cache_instances` to a loose correlation to virtual CPUs, keeping in mind that more instances means the cache is split more times. If you have a cache set to 500 but it has 10 instances, each cache will only have 50 cached.\n\nThe `table_definition_cache` and `table_open_cache` can be left as default as they are auto-sized MySQL 5.6 and above (ie: do not set them to any value).",
"editable": true,
"error": false,
"fieldConfig": {
"defaults": {
"links": []
},
"overrides": []
},
"fill": 2,
"fillGradient": 0,
"grid": {},
"gridPos": {
"h": 7,
"w": 12,
"x": 12,
"y": 113
},
"hiddenSeries": false,
"id": 42,
"legend": {
"alignAsTable": true,
"avg": true,
"current": false,
"max": true,
"min": true,
"rightSide": false,
"show": true,
"sort": "avg",
"sortDesc": true,
"total": false,
"values": true
},
"lines": true,
"linewidth": 2,
"links": [
{
"title": "Server Status Variables (table_open_cache)",
"url": "http://dev.mysql.com/doc/refman/5.6/en/server-system-variables.html#sysvar_table_open_cache"
}
],
"nullPointMode": "null",
"options": {
"alertThreshold": true
},
"percentage": false,
"pluginVersion": "10.0.10",
"pointradius": 5,
"points": false,
"renderer": "flot",
"seriesOverrides": [],
"spaceLength": 10,
"stack": false,
"steppedLine": false,
"targets": [
{
"calculatedInterval": "2m",
"datasource": {
"uid": "$datasource"
},
"datasourceErrors": {},
"errors": {},
"expr": "mysql_global_status_open_tables{job=~\"$job\", instance=~\"$instance\"}",
"format": "time_series",
"interval": "1m",
"intervalFactor": 1,
"legendFormat": "Open Tables",
"metric": "",
"refId": "B",
"step": 20
},
{
"calculatedInterval": "2m",
"datasource": {
"uid": "$datasource"
},
"datasourceErrors": {},
"errors": {},
"expr": "mysql_global_variables_table_open_cache{job=~\"$job\", instance=~\"$instance\"}",
"format": "time_series",
"interval": "1m",
"intervalFactor": 1,
"legendFormat": "Table Open Cache",
"metric": "",
"refId": "C",
"step": 20
}
],
"thresholds": [],
"timeRegions": [],
"title": "MySQL Open Tables",
"tooltip": {
"msResolution": false,
"shared": true,
"sort": 0,
"value_type": "individual"
},
"type": "graph",
"xaxis": {
"mode": "time",
"show": true,
"values": []
},
"yaxes": [
{
"format": "short",
"logBase": 1,
"min": 0,
"show": true
},
{
"format": "short",
"logBase": 1,
"min": 0,
"show": true
}
],
"yaxis": {
"align": false
}
},
{
"collapsed": false,
"datasource": {
"uid": "$datasource"
},
"gridPos": {
"h": 1,
"w": 24,
"x": 0,
"y": 120
},
"id": 394,
"panels": [],
"targets": [
{
"datasource": {
"uid": "$datasource"
},
"refId": "A"
}
],
"title": "MySQL Table Definition Cache",
"type": "row"
},
{
"aliasColors": {},
"bars": false,
"dashLength": 10,
"dashes": false,
"datasource": {
"uid": "$datasource"
},
"decimals": 2,
"description": "**MySQL Table Definition Cache**\n\nThe recommendation is to set the `table_open_cache_instances` to a loose correlation to virtual CPUs, keeping in mind that more instances means the cache is split more times. If you have a cache set to 500 but it has 10 instances, each cache will only have 50 cached.\n\nThe `table_definition_cache` and `table_open_cache` can be left as default as they are auto-sized MySQL 5.6 and above (ie: do not set them to any value).",
"editable": true,
"error": false,
"fieldConfig": {
"defaults": {
"links": []
},
"overrides": []
},
"fill": 2,
"fillGradient": 0,
"grid": {},
"gridPos": {
"h": 7,
"w": 24,
"x": 0,
"y": 121
},
"hiddenSeries": false,
"id": 54,
"legend": {
"alignAsTable": true,
"avg": true,
"current": false,
"max": true,
"min": true,
"rightSide": false,
"show": true,
"sort": "avg",
"sortDesc": true,
"total": false,
"values": true
},
"lines": true,
"linewidth": 2,
"links": [
{
"title": "Server Status Variables (table_open_cache)",
"url": "http://dev.mysql.com/doc/refman/5.6/en/server-system-variables.html#sysvar_table_open_cache"
}
],
"nullPointMode": "null",
"options": {
"alertThreshold": true
},
"percentage": false,
"pluginVersion": "10.0.10",
"pointradius": 5,
"points": false,
"renderer": "flot",
"seriesOverrides": [
{
"alias": "Opened Table Definitions",
"yaxis": 2
}
],
"spaceLength": 10,
"stack": false,
"steppedLine": false,
"targets": [
{
"calculatedInterval": "2m",
"datasource": {
"uid": "$datasource"
},
"datasourceErrors": {},
"errors": {},
"expr": "mysql_global_status_open_table_definitions{job=~\"$job\", instance=~\"$instance\"}",
"format": "time_series",
"interval": "1m",
"intervalFactor": 1,
"legendFormat": "Open Table Definitions",
"metric": "",
"refId": "B",
"step": 20
},
{
"calculatedInterval": "2m",
"datasource": {
"uid": "$datasource"
},
"datasourceErrors": {},
"errors": {},
"expr": "mysql_global_variables_table_definition_cache{job=~\"$job\", instance=~\"$instance\"}",
"format": "time_series",
"interval": "1m",
"intervalFactor": 1,
"legendFormat": "Table Definitions Cache Size",
"metric": "",
"refId": "C",
"step": 20
},
{
"datasource": {
"uid": "$datasource"
},
"expr": "rate(mysql_global_status_opened_table_definitions{job=~\"$job\", instance=~\"$instance\"}[$__rate_interval])",
"format": "time_series",
"interval": "1m",
"intervalFactor": 1,
"legendFormat": "Opened Table Definitions",
"refId": "A",
"step": 20
}
],
"thresholds": [],
"timeRegions": [],
"title": "MySQL Table Definition Cache",
"tooltip": {
"msResolution": false,
"shared": true,
"sort": 0,
"value_type": "individual"
},
"type": "graph",
"xaxis": {
"mode": "time",
"show": true,
"values": []
},
"yaxes": [
{
"format": "short",
"logBase": 1,
"min": 0,
"show": true
},
{
"format": "short",
"logBase": 1,
"min": 0,
"show": true
}
],
"yaxis": {
"align": false
}
}
],
"refresh": "30m",
"schemaVersion": 38,
"style": "dark",
"tags": [],
"templating": {
"list": [
{
"current": {
"selected": false,
"text": "Prometheus",
"value": "Prometheus"
},
"hide": 0,
"includeAll": false,
"label": "Data Source",
"multi": false,
"name": "datasource",
"options": [],
"query": "prometheus",
"refresh": 1,
"regex": "",
"skipUrlSync": false,
"type": "datasource"
},
{
"current": {},
"datasource": {
"uid": "$datasource"
},
"definition": "label_values(mysql_up, job)",
"hide": 0,
"includeAll": false,
"multi": false,
"name": "job",
"options": [],
"query": {
"query": "label_values(mysql_up, job)",
"refId": "Prometheus-job-Variable-Query"
},
"refresh": 1,
"regex": "",
"skipUrlSync": false,
"sort": 0,
"tagValuesQuery": "",
"tagsQuery": "",
"type": "query",
"useTags": false
},
{
"current": {},
"datasource": {
"uid": "$datasource"
},
"definition": "label_values(mysql_up,instance)",
"hide": 0,
"includeAll": false,
"label": "Data Source",
"multi": false,
"name": "instance",
"options": [],
"query": {
"query": "label_values(mysql_up,instance)",
"refId": "PrometheusVariableQueryEditor-VariableQuery"
},
"refresh": 1,
"regex": "",
"skipUrlSync": false,
"sort": 0,
"tagValuesQuery": "",
"tagsQuery": "",
"type": "query",
"useTags": false
}
]
},
"time": {
"from": "now-1h",
"to": "now"
},
"timepicker": {
"collapse": false,
"enable": true,
"hidden": false,
"notice": false,
"now": true,
"refresh_intervals": [
"10s",
"30s",
"1m",
"5m",
"15m",
"30m",
"1h",
"2h",
"1d"
],
"status": "Stable",
"time_options": [
"5m",
"15m",
"1h",
"6h",
"12h",
"24h",
"2d",
"7d",
"30d"
],
"type": "timepicker"
},
"timezone": "",
"title": "MySQL",
"uid": "549c2bf8936f7767ea6ac47c47b00f2a",
"version": 12,
"weekStart": ""
}
2、模版2
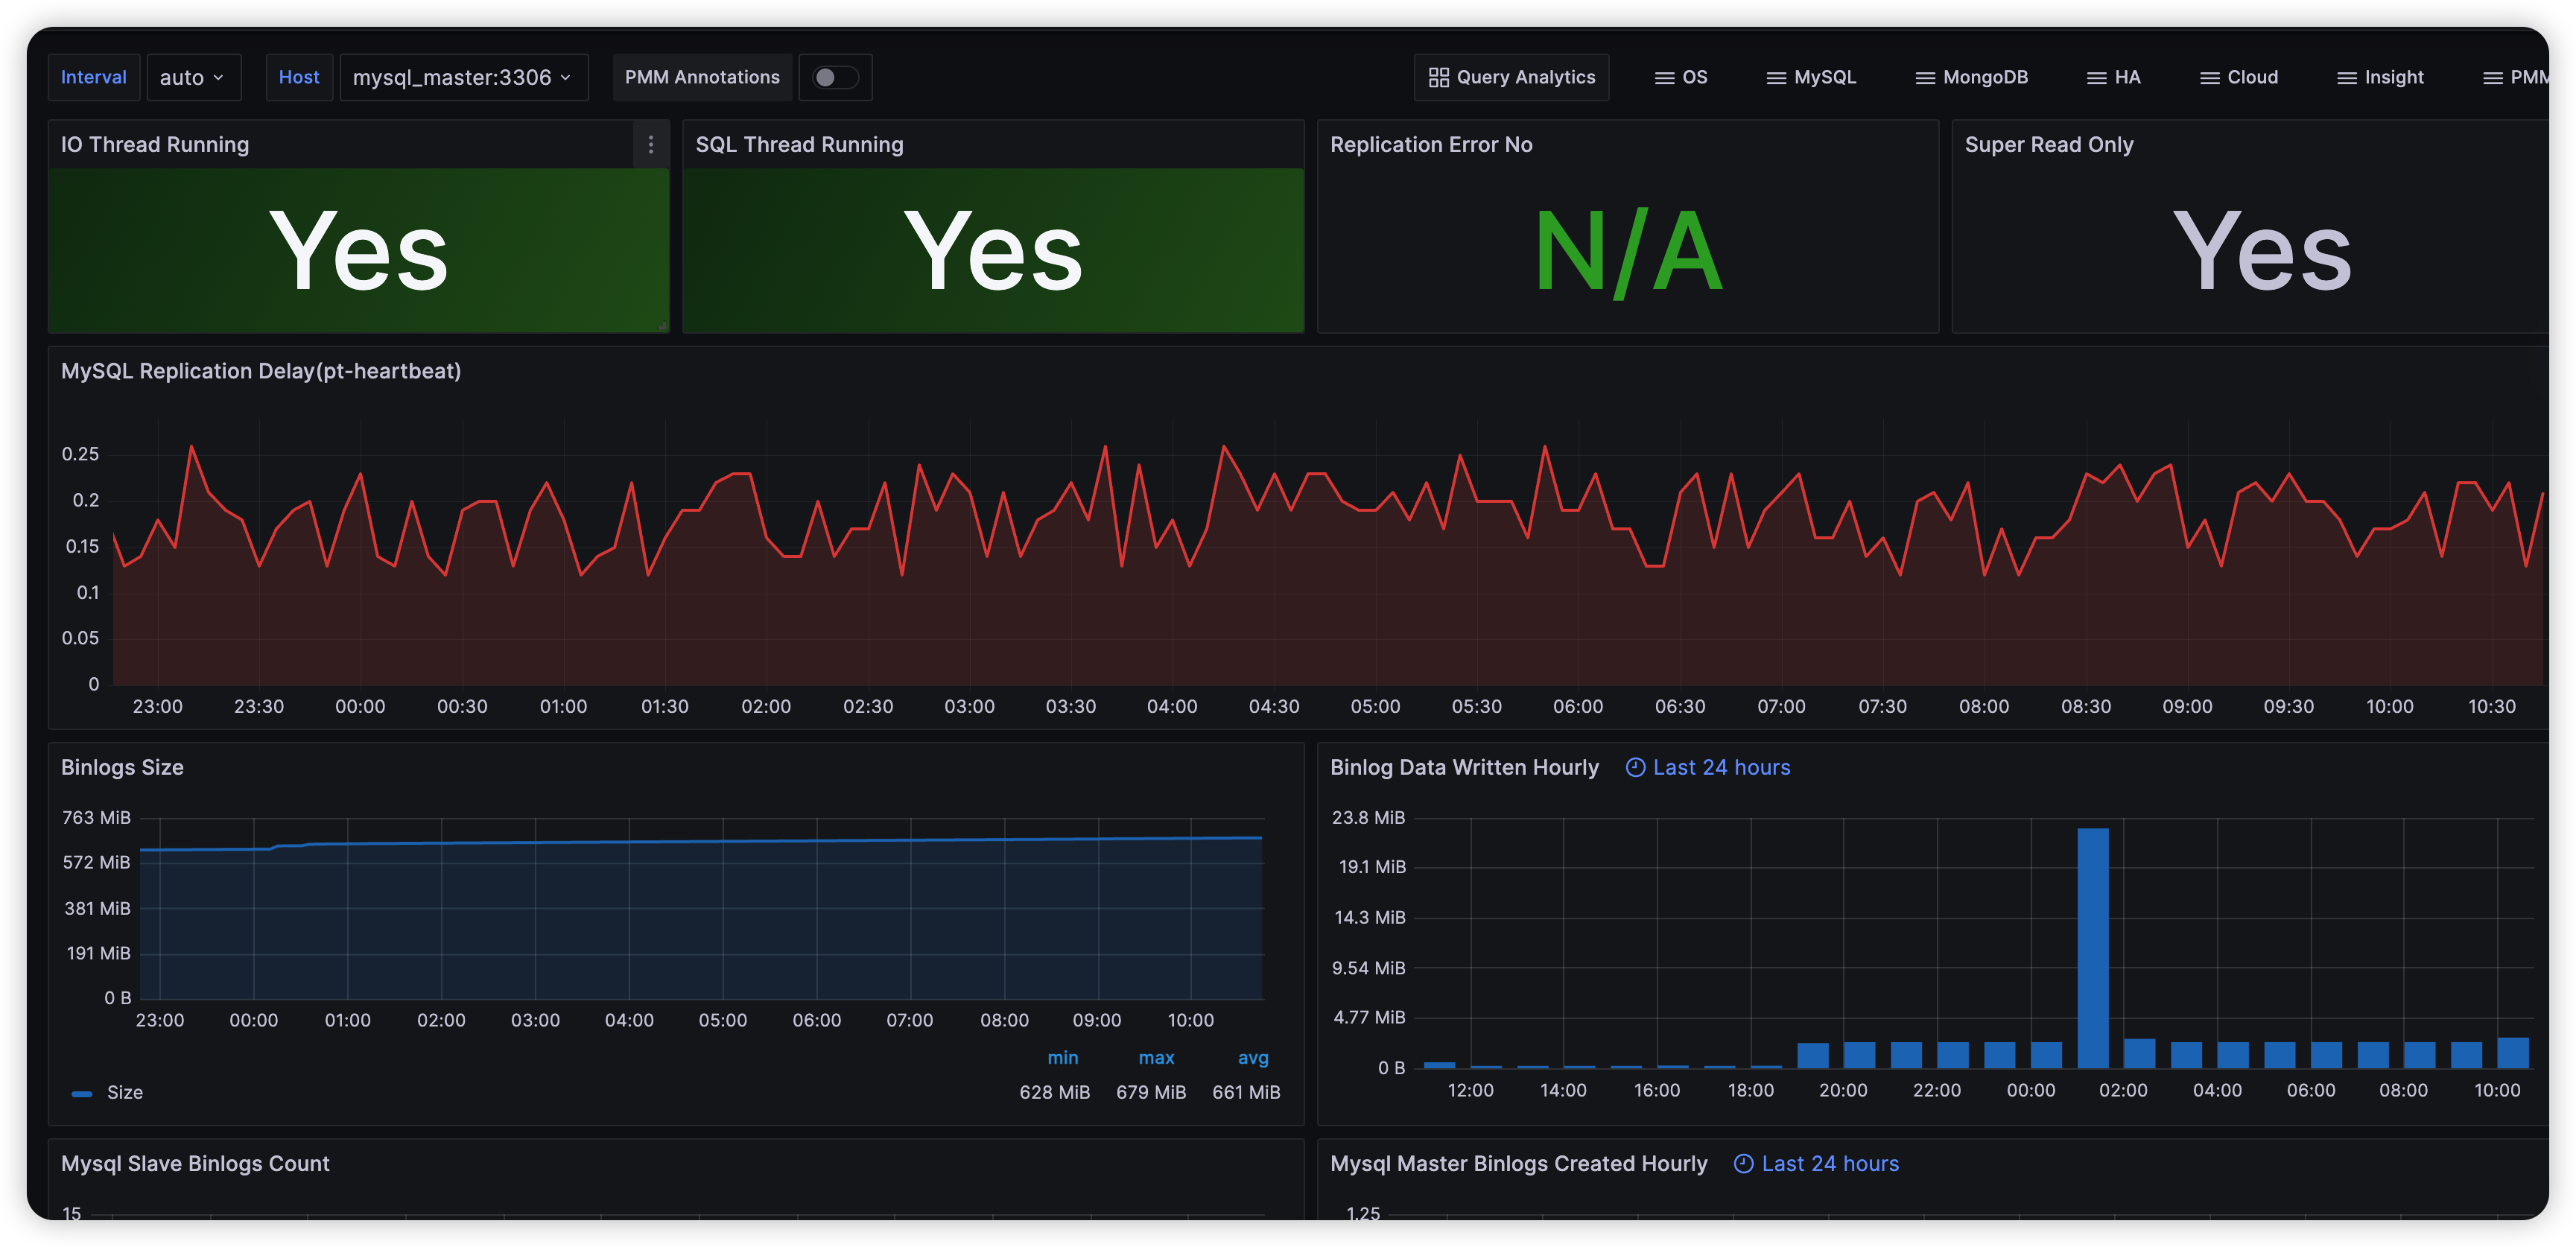
{
"__inputs": [
{
"name": "DS_PROMETHEUS",
"label": "Prometheus",
"description": "",
"type": "datasource",
"pluginId": "prometheus",
"pluginName": "Prometheus"
}
],
"__elements": {},
"__requires": [
{
"type": "grafana",
"id": "grafana",
"name": "Grafana",
"version": "10.0.10"
},
{
"type": "panel",
"id": "graph",
"name": "Graph (old)",
"version": ""
},
{
"type": "datasource",
"id": "prometheus",
"name": "Prometheus",
"version": "1.0.0"
},
{
"type": "panel",
"id": "stat",
"name": "Stat",
"version": ""
},
{
"type": "panel",
"id": "timeseries",
"name": "Time series",
"version": ""
}
],
"annotations": {
"list": [
{
"builtIn": 1,
"datasource": {
"type": "datasource",
"uid": "grafana"
},
"enable": false,
"hide": false,
"iconColor": "#e0752d",
"limit": 100,
"name": "PMM Annotations",
"showIn": 0,
"tags": [
"pmm_annotation"
],
"target": {
"limit": 100,
"matchAny": false,
"tags": [
"pmm_annotation"
],
"type": "tags"
},
"type": "tags"
}
]
},
"description": "Dashboard from Percona Monitoring and Management project. https://github.com/percona/grafana-dashboards",
"editable": true,
"fiscalYearStartMonth": 0,
"gnetId": 7371,
"graphTooltip": 1,
"id": null,
"links": [
{
"icon": "dashboard",
"includeVars": true,
"keepTime": true,
"tags": [
"QAN"
],
"targetBlank": false,
"title": "Query Analytics",
"type": "link",
"url": "/graph/dashboard/db/_pmm-query-analytics"
},
{
"asDropdown": true,
"includeVars": true,
"keepTime": true,
"tags": [
"OS"
],
"targetBlank": false,
"title": "OS",
"type": "dashboards"
},
{
"asDropdown": true,
"includeVars": true,
"keepTime": true,
"tags": [
"MySQL"
],
"targetBlank": false,
"title": "MySQL",
"type": "dashboards"
},
{
"asDropdown": true,
"includeVars": true,
"keepTime": true,
"tags": [
"MongoDB"
],
"targetBlank": false,
"title": "MongoDB",
"type": "dashboards"
},
{
"asDropdown": true,
"includeVars": true,
"keepTime": true,
"tags": [
"HA"
],
"targetBlank": false,
"title": "HA",
"type": "dashboards"
},
{
"asDropdown": true,
"includeVars": true,
"keepTime": true,
"tags": [
"Cloud"
],
"targetBlank": false,
"title": "Cloud",
"type": "dashboards"
},
{
"asDropdown": true,
"includeVars": true,
"keepTime": true,
"tags": [
"Insight"
],
"targetBlank": false,
"title": "Insight",
"type": "dashboards"
},
{
"asDropdown": true,
"includeVars": true,
"keepTime": true,
"tags": [
"PMM"
],
"targetBlank": false,
"title": "PMM",
"type": "dashboards"
}
],
"liveNow": false,
"panels": [
{
"datasource": {
"type": "prometheus",
"uid": "${DS_PROMETHEUS}"
},
"fieldConfig": {
"defaults": {
"color": {
"mode": "thresholds"
},
"decimals": 0,
"mappings": [
{
"options": {
"0": {
"text": "No"
},
"1": {
"text": "Yes"
}
},
"type": "value"
}
],
"thresholds": {
"mode": "absolute",
"steps": [
{
"color": "rgba(161, 18, 18, 0.9)",
"value": null
},
{
"color": "rgba(237, 129, 40, 0.89)",
"value": 0.5
},
{
"color": "rgba(36, 112, 33, 0.97)",
"value": 1
}
]
},
"unit": "short"
},
"overrides": []
},
"gridPos": {
"h": 4,
"w": 6,
"x": 0,
"y": 0
},
"id": 26,
"interval": "$interval",
"links": [],
"maxDataPoints": 100,
"options": {
"colorMode": "background",
"graphMode": "none",
"justifyMode": "auto",
"orientation": "horizontal",
"reduceOptions": {
"calcs": [
"lastNotNull"
],
"fields": "",
"values": false
},
"textMode": "auto"
},
"pluginVersion": "10.0.10",
"targets": [
{
"calculatedInterval": "10m",
"datasource": {
"type": "prometheus",
"uid": "${DS_PROMETHEUS}"
},
"datasourceErrors": {},
"editorMode": "code",
"errors": {},
"expr": "mysql_slave_status_slave_io_running{instance=\"mysql_slave:3306\"}",
"interval": "5m",
"intervalFactor": 1,
"legendFormat": "",
"metric": "",
"range": true,
"refId": "A",
"step": 300
}
],
"title": "IO Thread Running",
"type": "stat"
},
{
"datasource": {
"type": "prometheus",
"uid": "${DS_PROMETHEUS}"
},
"fieldConfig": {
"defaults": {
"color": {
"mode": "thresholds"
},
"decimals": 0,
"mappings": [
{
"options": {
"0": {
"text": "No"
},
"1": {
"text": "Yes"
}
},
"type": "value"
}
],
"thresholds": {
"mode": "absolute",
"steps": [
{
"color": "rgba(161, 18, 18, 0.9)",
"value": null
},
{
"color": "rgba(237, 129, 40, 0.89)",
"value": 0.5
},
{
"color": "rgba(36, 112, 33, 0.97)",
"value": 1
}
]
},
"unit": "short"
},
"overrides": []
},
"gridPos": {
"h": 4,
"w": 6,
"x": 6,
"y": 0
},
"id": 17,
"interval": "$interval",
"links": [],
"maxDataPoints": 100,
"options": {
"colorMode": "background",
"graphMode": "none",
"justifyMode": "auto",
"orientation": "horizontal",
"reduceOptions": {
"calcs": [
"lastNotNull"
],
"fields": "",
"values": false
},
"textMode": "auto"
},
"pluginVersion": "10.0.10",
"targets": [
{
"calculatedInterval": "10m",
"datasource": {
"type": "prometheus",
"uid": "${DS_PROMETHEUS}"
},
"datasourceErrors": {},
"editorMode": "code",
"errors": {},
"expr": "mysql_slave_status_slave_sql_running{instance=\"mysql_slave:3306\"}",
"interval": "5m",
"intervalFactor": 1,
"legendFormat": "",
"metric": "",
"range": true,
"refId": "A",
"step": 300
}
],
"title": "SQL Thread Running",
"type": "stat"
},
{
"datasource": {
"type": "prometheus",
"uid": "${DS_PROMETHEUS}"
},
"fieldConfig": {
"defaults": {
"color": {
"mode": "thresholds"
},
"decimals": 0,
"mappings": [
{
"options": {
"0": {
"text": "N/A"
}
},
"type": "value"
}
],
"thresholds": {
"mode": "absolute",
"steps": [
{
"color": "rgba(50, 172, 45, 0.97)",
"value": null
},
{
"color": "rgba(237, 129, 40, 0.89)",
"value": 0.5
},
{
"color": "rgba(245, 54, 54, 0.9)",
"value": 1
}
]
},
"unit": "none"
},
"overrides": []
},
"gridPos": {
"h": 4,
"w": 6,
"x": 12,
"y": 0
},
"id": 39,
"interval": "$interval",
"links": [],
"maxDataPoints": 100,
"options": {
"colorMode": "value",
"graphMode": "none",
"justifyMode": "auto",
"orientation": "horizontal",
"reduceOptions": {
"calcs": [
"lastNotNull"
],
"fields": "",
"values": false
},
"textMode": "auto"
},
"pluginVersion": "10.0.10",
"targets": [
{
"calculatedInterval": "10m",
"datasource": {
"type": "prometheus",
"uid": "${DS_PROMETHEUS}"
},
"datasourceErrors": {},
"editorMode": "code",
"errors": {},
"expr": "mysql_slave_status_last_errno{instance=\"mysql_slave:3306\"}",
"interval": "5m",
"intervalFactor": 1,
"legendFormat": "",
"metric": "",
"range": true,
"refId": "A",
"step": 300
}
],
"title": "Replication Error No",
"type": "stat"
},
{
"datasource": {
"type": "prometheus",
"uid": "${DS_PROMETHEUS}"
},
"fieldConfig": {
"defaults": {
"color": {
"mode": "thresholds"
},
"decimals": 0,
"mappings": [
{
"options": {
"0": {
"text": "No"
},
"1": {
"text": "Yes"
}
},
"type": "value"
}
],
"thresholds": {
"mode": "absolute",
"steps": [
{
"color": "rgba(50, 172, 45, 0.97)",
"value": null
},
{
"color": "rgba(237, 129, 40, 0.89)",
"value": 0.5
},
{
"color": "rgba(245, 54, 54, 0.9)",
"value": 1
}
]
},
"unit": "short"
},
"overrides": []
},
"gridPos": {
"h": 4,
"w": 6,
"x": 18,
"y": 0
},
"id": 27,
"interval": "$interval",
"links": [],
"maxDataPoints": 100,
"options": {
"colorMode": "none",
"graphMode": "none",
"justifyMode": "auto",
"orientation": "horizontal",
"reduceOptions": {
"calcs": [
"lastNotNull"
],
"fields": "",
"values": false
},
"textMode": "auto"
},
"pluginVersion": "10.0.10",
"targets": [
{
"calculatedInterval": "10m",
"datasource": {
"type": "prometheus",
"uid": "${DS_PROMETHEUS}"
},
"datasourceErrors": {},
"editorMode": "code",
"errors": {},
"expr": "mysql_global_variables_super_read_only{instance=\"mysql_slave:3306\"}",
"interval": "5m",
"intervalFactor": 1,
"legendFormat": "",
"metric": "",
"range": true,
"refId": "A",
"step": 300
}
],
"title": "Super Read Only",
"type": "stat"
},
{
"datasource": {
"type": "prometheus",
"uid": "${DS_PROMETHEUS}"
},
"fieldConfig": {
"defaults": {
"color": {
"mode": "palette-classic"
},
"custom": {
"axisCenteredZero": false,
"axisColorMode": "text",
"axisLabel": "",
"axisPlacement": "auto",
"barAlignment": 0,
"drawStyle": "line",
"fillOpacity": 20,
"gradientMode": "none",
"hideFrom": {
"legend": false,
"tooltip": false,
"viz": false
},
"lineInterpolation": "linear",
"lineWidth": 2,
"pointSize": 5,
"scaleDistribution": {
"type": "linear"
},
"showPoints": "never",
"spanNulls": false,
"stacking": {
"group": "A",
"mode": "none"
},
"thresholdsStyle": {
"mode": "off"
}
},
"mappings": [],
"min": 0,
"thresholds": {
"mode": "absolute",
"steps": [
{
"color": "green",
"value": null
},
{
"color": "red",
"value": 80
}
]
},
"unit": "short"
},
"overrides": [
{
"matcher": {
"id": "byName",
"options": "Lag"
},
"properties": [
{
"id": "color",
"value": {
"fixedColor": "#E24D42",
"mode": "fixed"
}
}
]
}
]
},
"gridPos": {
"h": 7,
"w": 24,
"x": 0,
"y": 4
},
"id": 16,
"links": [],
"options": {
"legend": {
"calcs": [
"mean",
"max",
"min"
],
"displayMode": "table",
"placement": "right",
"showLegend": false
},
"tooltip": {
"mode": "multi",
"sort": "none"
}
},
"pluginVersion": "9.3.6",
"targets": [
{
"calculatedInterval": "2m",
"datasource": {
"type": "prometheus",
"uid": "${DS_PROMETHEUS}"
},
"datasourceErrors": {},
"editorMode": "code",
"errors": {},
"expr": "ceil((mysql_heartbeat_now_timestamp_seconds{instance='mysql_slave:3306'}-mysql_heartbeat_stored_timestamp_seconds{instance='mysql_slave:3306'})*100)/100",
"interval": "$interval",
"intervalFactor": 1,
"legendFormat": "Lag",
"metric": "",
"range": true,
"refId": "A",
"step": 300
}
],
"title": "MySQL Replication Delay(pt-heartbeat)",
"type": "timeseries"
},
{
"aliasColors": {},
"bars": false,
"dashLength": 10,
"dashes": false,
"datasource": {
"type": "prometheus",
"uid": "${DS_PROMETHEUS}"
},
"editable": true,
"error": false,
"fill": 2,
"fillGradient": 0,
"grid": {},
"gridPos": {
"h": 7,
"w": 12,
"x": 0,
"y": 11
},
"hiddenSeries": false,
"id": 33,
"legend": {
"alignAsTable": true,
"avg": true,
"current": false,
"max": true,
"min": true,
"rightSide": false,
"show": true,
"total": false,
"values": true
},
"lines": true,
"linewidth": 2,
"links": [],
"nullPointMode": "null",
"options": {
"alertThreshold": true
},
"percentage": false,
"pluginVersion": "10.0.10",
"pointradius": 5,
"points": false,
"renderer": "flot",
"seriesOverrides": [
{
"alias": "Size",
"color": "#1F78C1"
}
],
"spaceLength": 10,
"stack": false,
"steppedLine": false,
"targets": [
{
"calculatedInterval": "2m",
"datasource": {
"type": "prometheus",
"uid": "${DS_PROMETHEUS}"
},
"datasourceErrors": {},
"errors": {},
"expr": "mysql_binlog_size_bytes{instance=\"$host\"}",
"interval": "$interval",
"intervalFactor": 1,
"legendFormat": "Size",
"metric": "",
"refId": "A",
"step": 300
}
],
"thresholds": [],
"timeRegions": [],
"title": "Binlogs Size",
"tooltip": {
"msResolution": false,
"shared": true,
"sort": 0,
"value_type": "individual"
},
"type": "graph",
"xaxis": {
"mode": "time",
"show": true,
"values": []
},
"yaxes": [
{
"format": "bytes",
"logBase": 1,
"min": 0,
"show": true
},
{
"format": "bytes",
"logBase": 1,
"min": 0,
"show": true
}
],
"yaxis": {
"align": false
}
},
{
"aliasColors": {},
"bars": true,
"dashLength": 10,
"dashes": false,
"datasource": {
"type": "prometheus",
"uid": "${DS_PROMETHEUS}"
},
"decimals": 2,
"editable": true,
"error": false,
"fill": 2,
"fillGradient": 0,
"grid": {},
"gridPos": {
"h": 7,
"w": 12,
"x": 12,
"y": 11
},
"hiddenSeries": false,
"id": 35,
"legend": {
"alignAsTable": false,
"avg": false,
"current": false,
"max": false,
"min": false,
"rightSide": false,
"show": false,
"total": false,
"values": false
},
"lines": false,
"linewidth": 2,
"links": [],
"nullPointMode": "null",
"options": {
"alertThreshold": true
},
"percentage": false,
"pluginVersion": "10.0.10",
"pointradius": 5,
"points": false,
"renderer": "flot",
"seriesOverrides": [
{
"alias": "Size",
"color": "#1F78C1"
}
],
"spaceLength": 10,
"stack": false,
"steppedLine": false,
"targets": [
{
"calculatedInterval": "2m",
"datasource": {
"type": "prometheus",
"uid": "${DS_PROMETHEUS}"
},
"datasourceErrors": {},
"errors": {},
"expr": "increase(mysql_binlog_size_bytes{instance=\"$host\"}[1h])",
"interval": "1h",
"intervalFactor": 1,
"legendFormat": "Size",
"metric": "",
"refId": "A",
"step": 3600
}
],
"thresholds": [],
"timeFrom": "24h",
"timeRegions": [],
"title": "Binlog Data Written Hourly",
"tooltip": {
"msResolution": false,
"shared": true,
"sort": 0,
"value_type": "individual"
},
"type": "graph",
"xaxis": {
"mode": "time",
"show": true,
"values": []
},
"yaxes": [
{
"format": "bytes",
"logBase": 1,
"min": 0,
"show": true
},
{
"format": "bytes",
"logBase": 1,
"min": 0,
"show": true
}
],
"yaxis": {
"align": false
}
},
{
"aliasColors": {},
"bars": false,
"dashLength": 10,
"dashes": false,
"datasource": {
"type": "prometheus",
"uid": "${DS_PROMETHEUS}"
},
"decimals": 0,
"editable": true,
"error": false,
"fill": 2,
"fillGradient": 0,
"grid": {},
"gridPos": {
"h": 7,
"w": 12,
"x": 0,
"y": 18
},
"hiddenSeries": false,
"id": 34,
"legend": {
"alignAsTable": true,
"avg": true,
"current": false,
"max": true,
"min": true,
"rightSide": false,
"show": true,
"total": false,
"values": true
},
"lines": true,
"linewidth": 2,
"links": [],
"nullPointMode": "null",
"options": {
"alertThreshold": true
},
"percentage": false,
"pluginVersion": "10.0.10",
"pointradius": 5,
"points": false,
"renderer": "flot",
"seriesOverrides": [
{
"alias": "Count",
"color": "#E0752D"
}
],
"spaceLength": 10,
"stack": false,
"steppedLine": false,
"targets": [
{
"calculatedInterval": "2m",
"datasource": {
"type": "prometheus",
"uid": "${DS_PROMETHEUS}"
},
"datasourceErrors": {},
"errors": {},
"expr": "mysql_binlog_files{instance=\"$host\"}",
"interval": "$interval",
"intervalFactor": 1,
"legendFormat": "Count",
"metric": "",
"refId": "A",
"step": 300
}
],
"thresholds": [],
"timeRegions": [],
"title": "Mysql Slave Binlogs Count",
"tooltip": {
"msResolution": false,
"shared": true,
"sort": 0,
"value_type": "individual"
},
"type": "graph",
"xaxis": {
"mode": "time",
"show": true,
"values": []
},
"yaxes": [
{
"format": "none",
"logBase": 1,
"min": 0,
"show": true
},
{
"format": "none",
"logBase": 1,
"min": 0,
"show": true
}
],
"yaxis": {
"align": false
}
},
{
"aliasColors": {},
"bars": true,
"dashLength": 10,
"dashes": false,
"datasource": {
"type": "prometheus",
"uid": "${DS_PROMETHEUS}"
},
"decimals": 0,
"editable": true,
"error": false,
"fill": 2,
"fillGradient": 0,
"grid": {},
"gridPos": {
"h": 7,
"w": 12,
"x": 12,
"y": 18
},
"hiddenSeries": false,
"id": 36,
"legend": {
"alignAsTable": false,
"avg": false,
"current": false,
"max": false,
"min": false,
"rightSide": false,
"show": false,
"total": false,
"values": false
},
"lines": false,
"linewidth": 2,
"links": [],
"nullPointMode": "null",
"options": {
"alertThreshold": true
},
"percentage": false,
"pluginVersion": "10.0.10",
"pointradius": 5,
"points": false,
"renderer": "flot",
"seriesOverrides": [
{
"alias": "Count",
"color": "#E0752D"
}
],
"spaceLength": 10,
"stack": false,
"steppedLine": false,
"targets": [
{
"calculatedInterval": "2m",
"datasource": {
"type": "prometheus",
"uid": "${DS_PROMETHEUS}"
},
"datasourceErrors": {},
"editorMode": "code",
"errors": {},
"expr": "increase(mysql_binlog_file_number{instance=\"$host\"}[1h])",
"interval": "1h",
"intervalFactor": 1,
"legendFormat": "Count",
"metric": "",
"range": true,
"refId": "A",
"step": 3600
}
],
"thresholds": [],
"timeFrom": "24h",
"timeRegions": [],
"title": "Mysql Master Binlogs Created Hourly",
"tooltip": {
"msResolution": false,
"shared": true,
"sort": 0,
"value_type": "individual"
},
"type": "graph",
"xaxis": {
"mode": "time",
"show": true,
"values": []
},
"yaxes": [
{
"format": "none",
"logBase": 1,
"min": 0,
"show": true
},
{
"format": "none",
"logBase": 1,
"min": 0,
"show": true
}
],
"yaxis": {
"align": false
}
},
{
"aliasColors": {},
"bars": false,
"dashLength": 10,
"dashes": false,
"datasource": {
"type": "prometheus",
"uid": "${DS_PROMETHEUS}"
},
"editable": true,
"error": false,
"fill": 2,
"fillGradient": 0,
"grid": {},
"gridPos": {
"h": 7,
"w": 12,
"x": 0,
"y": 25
},
"hiddenSeries": false,
"id": 37,
"legend": {
"alignAsTable": true,
"avg": true,
"current": false,
"max": true,
"min": true,
"rightSide": false,
"show": true,
"total": false,
"values": true
},
"lines": true,
"linewidth": 2,
"links": [],
"nullPointMode": "null",
"options": {
"alertThreshold": true
},
"percentage": false,
"pluginVersion": "10.0.10",
"pointradius": 5,
"points": false,
"renderer": "flot",
"seriesOverrides": [
{
"alias": "Size",
"color": "#BA43A9"
}
],
"spaceLength": 10,
"stack": false,
"steppedLine": false,
"targets": [
{
"calculatedInterval": "2m",
"datasource": {
"type": "prometheus",
"uid": "${DS_PROMETHEUS}"
},
"datasourceErrors": {},
"editorMode": "code",
"errors": {},
"expr": "mysql_slave_status_relay_log_space{instance=\"mysql_slave:3306\"}",
"interval": "$interval",
"intervalFactor": 1,
"legendFormat": "Size",
"metric": "",
"range": true,
"refId": "A",
"step": 300
}
],
"thresholds": [],
"timeRegions": [],
"title": "Mysql Slave Relay Log Space",
"tooltip": {
"msResolution": false,
"shared": true,
"sort": 0,
"value_type": "individual"
},
"type": "graph",
"xaxis": {
"mode": "time",
"show": true,
"values": []
},
"yaxes": [
{
"format": "bytes",
"logBase": 1,
"min": 0,
"show": true
},
{
"format": "bytes",
"logBase": 1,
"min": 0,
"show": true
}
],
"yaxis": {
"align": false
}
},
{
"aliasColors": {},
"bars": true,
"dashLength": 10,
"dashes": false,
"datasource": {
"type": "prometheus",
"uid": "${DS_PROMETHEUS}"
},
"decimals": 2,
"editable": true,
"error": false,
"fill": 2,
"fillGradient": 0,
"grid": {},
"gridPos": {
"h": 7,
"w": 12,
"x": 12,
"y": 25
},
"hiddenSeries": false,
"id": 38,
"legend": {
"alignAsTable": true,
"avg": true,
"current": false,
"max": true,
"min": true,
"rightSide": false,
"show": false,
"total": false,
"values": true
},
"lines": false,
"linewidth": 2,
"links": [],
"nullPointMode": "null",
"options": {
"alertThreshold": true
},
"percentage": false,
"pluginVersion": "10.0.10",
"pointradius": 5,
"points": false,
"renderer": "flot",
"seriesOverrides": [
{
"alias": "Size",
"color": "#BA43A9"
}
],
"spaceLength": 10,
"stack": false,
"steppedLine": false,
"targets": [
{
"calculatedInterval": "2m",
"datasource": {
"type": "prometheus",
"uid": "${DS_PROMETHEUS}"
},
"datasourceErrors": {},
"editorMode": "code",
"errors": {},
"expr": "increase(mysql_slave_status_relay_log_space{instance=\"mysql_slave:3306\"}[1h])",
"interval": "1h",
"intervalFactor": 1,
"legendFormat": "Size",
"metric": "",
"range": true,
"refId": "A",
"step": 3600
}
],
"thresholds": [],
"timeFrom": "24h",
"timeRegions": [],
"title": "Mysql Slave Relay Log Written Hourly",
"tooltip": {
"msResolution": false,
"shared": true,
"sort": 0,
"value_type": "individual"
},
"type": "graph",
"xaxis": {
"mode": "time",
"show": true,
"values": []
},
"yaxes": [
{
"format": "bytes",
"logBase": 1,
"min": 0,
"show": true
},
{
"format": "bytes",
"logBase": 1,
"min": 0,
"show": true
}
],
"yaxis": {
"align": false
}
}
],
"refresh": "30m",
"schemaVersion": 38,
"style": "dark",
"tags": [
"Percona",
"MySQL"
],
"templating": {
"list": [
{
"allFormat": "glob",
"auto": true,
"auto_count": 200,
"auto_min": "1s",
"current": {
"selected": false,
"text": "auto",
"value": "$__auto_interval_interval"
},
"datasource": "0",
"hide": 0,
"includeAll": false,
"label": "Interval",
"multi": false,
"multiFormat": "glob",
"name": "interval",
"options": [
{
"selected": true,
"text": "auto",
"value": "$__auto_interval_interval"
},
{
"selected": false,
"text": "1s",
"value": "1s"
},
{
"selected": false,
"text": "5s",
"value": "5s"
},
{
"selected": false,
"text": "1m",
"value": "1m"
},
{
"selected": false,
"text": "5m",
"value": "5m"
},
{
"selected": false,
"text": "1h",
"value": "1h"
},
{
"selected": false,
"text": "6h",
"value": "6h"
},
{
"selected": false,
"text": "1d",
"value": "1d"
}
],
"query": "1s,5s,1m,5m,1h,6h,1d",
"queryValue": "",
"refresh": 2,
"skipUrlSync": false,
"type": "interval"
},
{
"allFormat": "glob",
"current": {},
"datasource": {
"type": "prometheus",
"uid": "${DS_PROMETHEUS}"
},
"definition": "label_values({__name__=~\"(mysql_binlog_files|mysql_slave_status_seconds_behind_master)\"},instance)",
"hide": 0,
"includeAll": false,
"label": "Host",
"multi": false,
"multiFormat": "regex values",
"name": "host",
"options": [],
"query": {
"query": "label_values({__name__=~\"(mysql_binlog_files|mysql_slave_status_seconds_behind_master)\"},instance)",
"refId": "PrometheusVariableQueryEditor-VariableQuery"
},
"refresh": 1,
"refresh_on_load": false,
"regex": "",
"skipUrlSync": false,
"sort": 1,
"type": "query",
"useTags": false
}
]
},
"time": {
"from": "now-12h",
"to": "now"
},
"timepicker": {
"collapse": false,
"enable": true,
"hidden": false,
"notice": false,
"now": true,
"refresh_intervals": [
"5s",
"10s",
"30s",
"1m",
"5m",
"15m",
"30m",
"1h",
"2h",
"1d"
],
"status": "Stable",
"time_options": [
"5m",
"15m",
"1h",
"6h",
"12h",
"24h",
"2d",
"7d",
"30d"
],
"type": "timepicker"
},
"timezone": "browser",
"title": "MySQL Replication",
"uid": "_9zrwMHmk",
"version": 19,
"weekStart": ""
}

 浙公网安备 33010602011771号