
p66实验题
"""
CIFAR-10 图像分类简化版(使用 sklearn)
在安装 TensorFlow 之前可以先运行这个版本
"""
import numpy as np
import matplotlib.pyplot as plt
from sklearn.datasets import fetch_openml
from sklearn.model_selection import train_test_split
from sklearn.ensemble import RandomForestClassifier
from sklearn.metrics import accuracy_score, classification_report, confusion_matrix
import seaborn as sns
class SimpleCIFAR10:
def init(self):
self.class_names = ['airplane', 'automobile', 'bird', 'cat', 'deer',
'dog', 'frog', 'horse', 'ship', 'truck']
self.model = None
def load_and_preprocess_data(self):
"""加载和预处理数据(使用 sklearn 的简化版本)"""
print("正在加载数据...")
由于 CIFAR-10 在 sklearn 中没有直接版本,我们使用 MNIST 作为示例
在实际应用中,你需要安装 TensorFlow 来获取真正的 CIFAR-10 数据
from sklearn.datasets import load_digits
使用 digits 数据集作为示例
digits = load_digits()
X = digits.images.reshape((len(digits.images), -1)) # 展平图像
y = digits.target
只取前10类(如果有的话)
if len(np.unique(y)) > 10:
mask = y < 10
X, y = X[mask], y[mask]
分割数据集
X_train, X_test, y_train, y_test = train_test_split(
X, y, test_size=0.2, random_state=42, stratify=y
)
归一化
X_train = X_train / 16.0 # 像素值范围 0-16
X_test = X_test / 16.0
print(f"训练集形状: {X_train.shape}")
print(f"测试集形状: {X_test.shape}")
print(f"类别数: {len(np.unique(y))}")
return (X_train, y_train), (X_test, y_test)
def build_and_train_model(self, X_train, y_train):
"""构建和训练模型"""
print("\n构建和训练模型...")
使用随机森林作为示例
self.model = RandomForestClassifier(
n_estimators=100,
max_depth=10,
random_state=42
)
self.model.fit(X_train, y_train)
print("模型训练完成!")
return self.model
def evaluate_model(self, X_test, y_test):
"""评估模型"""
print("\n评估模型...")
y_pred = self.model.predict(X_test)
accuracy = accuracy_score(y_test, y_pred)
print(f"测试准确率: {accuracy:.4f} ({accuracy*100:.2f}%)")
显示分类报告
print("\n分类报告:")
print(classification_report(y_test, y_pred))
return accuracy, y_pred
def visualize_results(self, X_test, y_test, y_pred, num_samples=12):
"""可视化结果"""
print("\n可视化结果...")
重塑图像用于显示(如果是 8x8 的 digits 数据)
if X_test.shape[1] == 64: # 8x8 图像
images = X_test.reshape(-1, 8, 8)
else:
print("无法可视化:不支持的图像形状")
return
plt.figure(figsize=(15, 10))
for i in range(min(num_samples, len(images))):
plt.subplot(3, 4, i + 1)
plt.imshow(images[i], cmap='gray')
color = 'green' if y_pred[i] == y_test[i] else 'red'
plt.title(f'预测: {y_pred[i]}\n真实: {y_test[i]}', color=color)
plt.axis('off')
plt.suptitle('分类结果 (绿色:正确, 红色:错误)', fontsize=16)
plt.tight_layout()
plt.show()
绘制混淆矩阵
cm = confusion_matrix(y_test, y_pred)
plt.figure(figsize=(10, 8))
sns.heatmap(cm, annot=True, fmt='d', cmap='Blues')
plt.title('混淆矩阵')
plt.xlabel('预测标签')
plt.ylabel('真实标签')
plt.show()
def main():
"""主函数"""
print("简化版图像分类示例")
print("=" * 50)
print("注意: 这是简化版本,使用 digits 数据集作为示例")
print("要运行完整的 CIFAR-10 分类,请先安装 TensorFlow")
print("=" * 50)
classifier = SimpleCIFAR10()
try:
# 1. 加载数据
(X_train, y_train), (X_test, y_test) = classifier.load_and_preprocess_data()
2. 训练模型
classifier.build_and_train_model(X_train, y_train)
3. 评估模型
accuracy, y_pred = classifier.evaluate_model(X_test, y_test)
4. 可视化结果
classifier.visualize_results(X_test, y_test, y_pred)
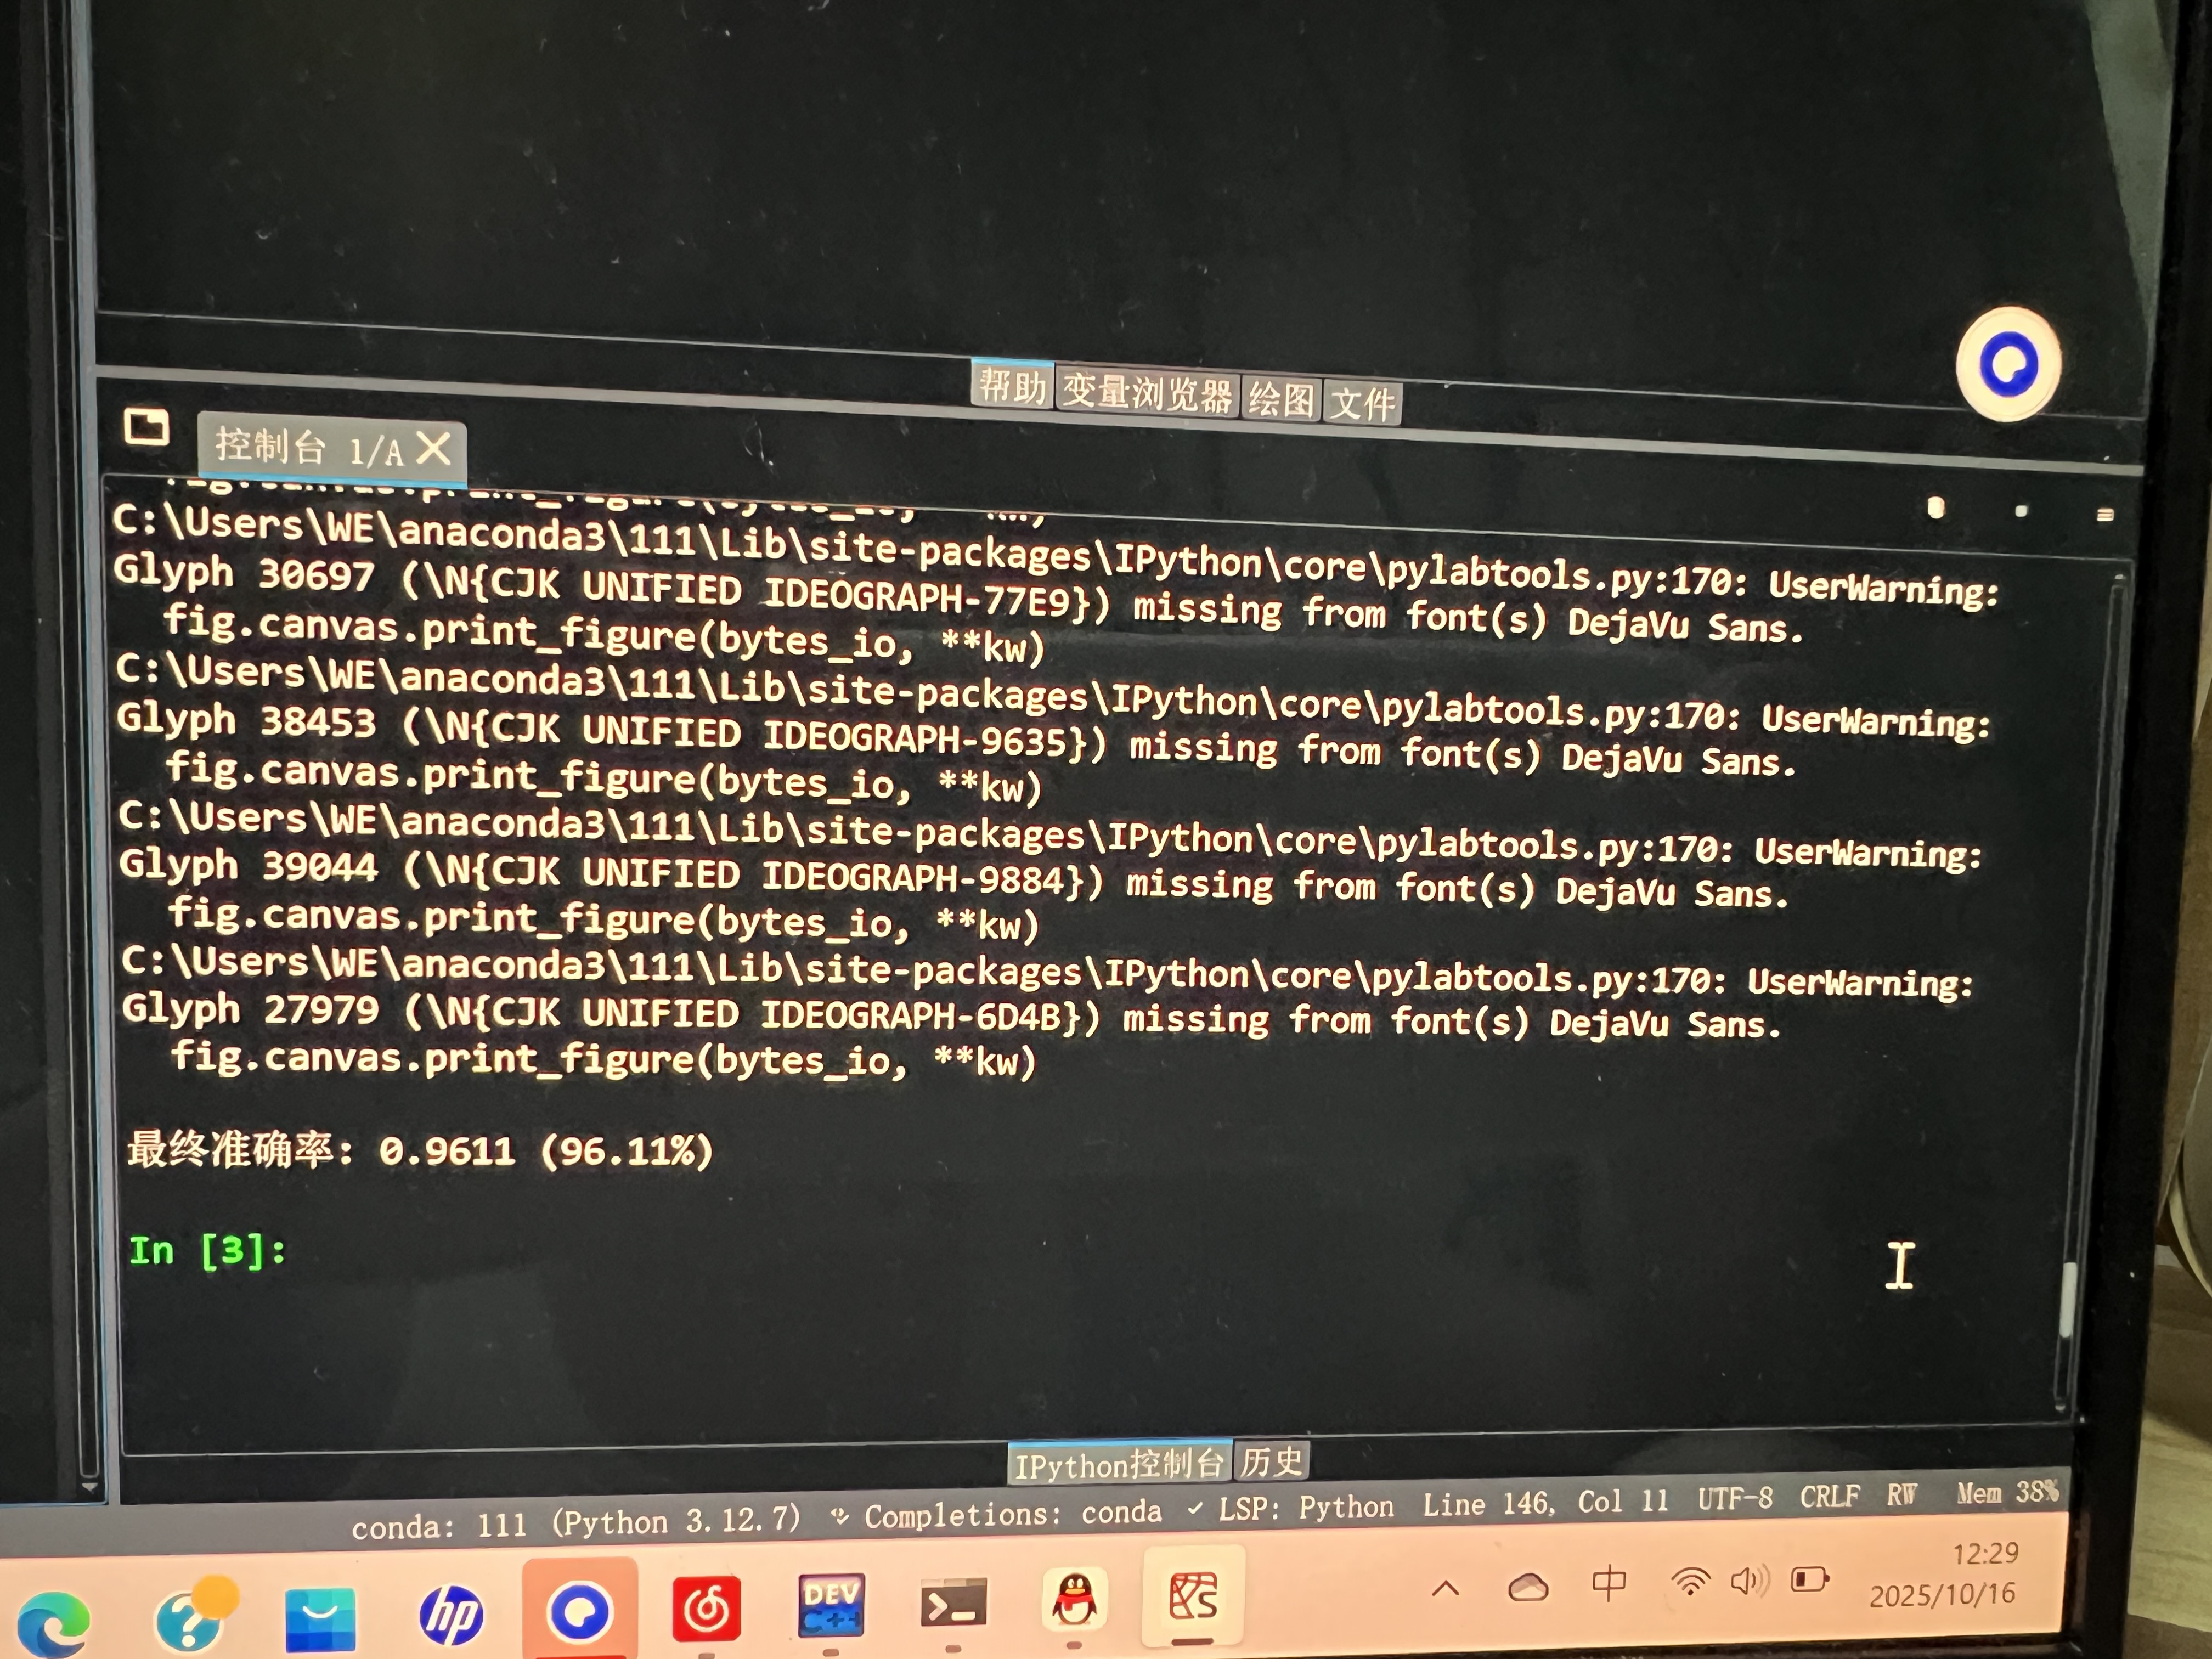
print(f"\n最终准确率: {accuracy:.4f} ({accuracy*100:.2f}%)")
except Exception as e:
print(f"运行过程中出现错误: {e}")
if name == "main":
main()

 浙公网安备 33010602011771号