雷达图
import numpy as np
import matplotlib.pyplot as plt
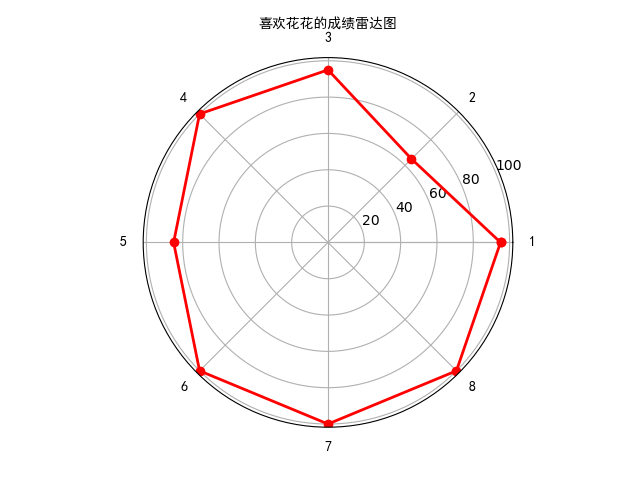
labels = np.array(['1','2','3','4','5','6','7','8']) #标签 考试的次数
dataLenth = 8 #数据个数
data = np.array([95,65,95,100,85,100,100,100]) #数据 成绩
angles = np.linspace(0, 2*np.pi, len(labels), endpoint=False) #把圆形8等分
data = np.concatenate((data,[data[0]]))
angles = np.concatenate((angles, [angles[0]])) #拼接
fig = plt.figure() #初始化一个极坐标
ax = fig.add_subplot(111, polar=True) #参数polar,以极坐标形式画图
ax.plot(angles, data, 'ro-', linewidth=2) #画线
ax.set_thetagrids(angles * 180/np.pi, labels, fontproperties="SimHei")
ax.set_title("喜欢花花的成绩雷达图", va='bottom', fontproperties="SimHei") #雷达图取名
ax.grid(True)
plt.show()
效果图:

 浙公网安备 33010602011771号