使用递归图 recurrence plot 表征时间序列
在本文中,我将展示如何使用递归图 Recurrence Plots 来描述不同类型的时间序列。我们将查看具有500个数据点的各种模拟时间序列。我们可以通过可视化时间序列的递归图并将其与其他已知的不同时间序列的递归图进行比较,从而直观地表征时间序列。
递归图
Recurrence Plots(RP)是一种用于可视化和分析时间序列或动态系统的方法。它将时间序列转化为图形化的表示形式,以便分析时间序列中的重复模式和结构。Recurrence Plots 是非常有用的,尤其是在时间序列数据中存在周期性、重复事件或关联结构时。
Recurrence Plots 的基本原理是测量时间序列中各点之间的相似性。如果两个时间点之间的距离小于某个给定的阈值,就会在 Recurrence Plot 中绘制一个点,表示这两个时间点之间存在重复性。这些点在二维平面上组成了一种图像。
import numpy as npimport matplotlib.pyplot as pltdef recurrence_plot(data, threshold=0.1):"""Generate a recurrence plot from a time series.:param data: Time series data:param threshold: Threshold to determine recurrence:return: Recurrence plot"""# Calculate the distance matrixN = len(data)distance_matrix = np.zeros((N, N))for i in range(N):for j in range(N):distance_matrix[i, j] = np.abs(data[i] - data[j])# Create the recurrence plotrecurrence_plot = np.where(distance_matrix <= threshold, 1, 0)return recurrence_plot
上面的代码创建了一个二进制距离矩阵,如果时间序列i和j的值相差在0.1以内(阈值),则它们的值为1,否则为0。得到的矩阵可以看作是一幅图像。
白噪声
接下来我们将可视化白噪声。首先,我们需要创建一系列模拟的白噪声:
# Set a seed for reproducibilitynp.random.seed(0)# Generate 500 data points of white noisewhite_noise = np.random.normal(size=500)# Plot the white noise time seriesplt.figure(figsize=(10, 6))plt.plot(white_noise, label='White Noise')plt.title('White Noise Time Series')plt.xlabel('Time')plt.ylabel('Value')plt.legend()plt.grid(True)plt.show()
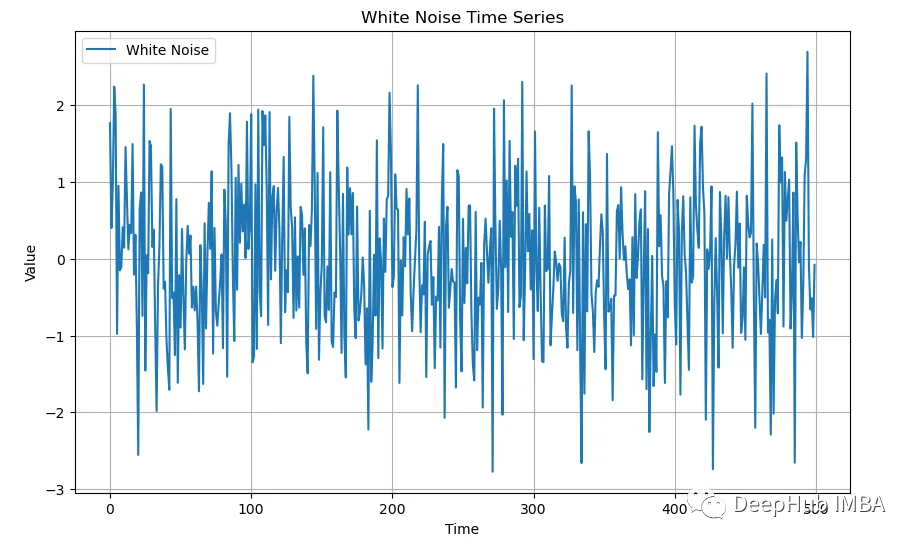
递归图为这种白噪声提供了有趣的可视化效果。对于任何一种白噪声,图看起来都是一样的:
https://avoid.overfit.cn/post/6b385fd6e8d64f2cb62d9caafd05389b

 浙公网安备 33010602011771号