在  v-charts 第一次亲密接触 中记录了很多v-charts的用法。

近期老板给了个需求,在图表中列出 S、A、B、C三个绩效层级的阈值。经过调研,markline可以实现。v-charts中markline的具体用法如下:

1.图表组件,直接绑定

<VeHistogram :data="product_trend_data" :settings="product_trend_data.settings" :extend="product_trend_data.extend" :mark-line="markLine"></VeHistogram>

2.数据、样式设置

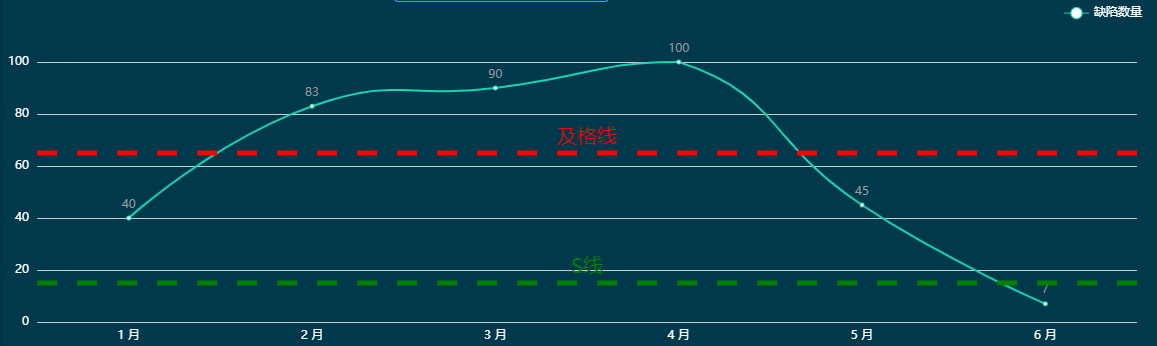
                markLine:{
                    symbol: 'none',
                    data: [
                        {
                            yAxis: 15,
                            label:{
                                show: 'true',
                                position: 'middle',
                                formatter: 'S线',
                                color: 'green',
                                fontSize: 20
                            },
                            lineStyle:{
                                color: 'green',
                                width: 5
                            }
                        },
                        {
                            yAxis: 65,
                            label:{
                                show: 'true',
                                position: 'middle',
                                formatter: '及格线',
                                color: 'red',
                                fontSize: 20
                            },
                            lineStyle:{
                                color: 'red',
                                width: 5
                            }
                        }
                    ]
                }
View Code

3.效果图


echats markline文档:https://echarts.apache.org/zh/option.html#series-line.markLine

posted on 2020-06-04 19:45  蛋尼  阅读(1485)  评论(0编辑  收藏  举报