
利用Deepseek AI,在书上的例子增加了一些功能。QMap和QList可以替换为Java自带的HashMap和ArrayList。
QPlotter类
package jqt; import io.qt.core.*; import io.qt.gui.*; import io.qt.widgets.*; import java.util.concurrent.atomic.AtomicReference; public class QPlotter extends QWidget { final int Margin = 50; QToolButton zoomInButton; QToolButton zoomOutButton; QMap<String, QList<QPointF>> curveMap = "QMap<String, QList<QPointF>>".create(); QList<QPlotSettings> zoomStack = "QList<jqt.QPlotter\$QPlotSettings>".create(); int curZoom; boolean rubberBandIsShown; QRect rubberBandRect = new QRect(); QPixmap pixmap; // 新增悬停相关成员 String highlightedCurve; QPointF hoverPoint; QLabel statusLabel; SpatialGrid spatialGrid; final double HOVER_THRESHOLD = 5.0; String xLabel = ""; String yLabel = ""; String title = ""; boolean dataDirty = true; public QPlotter() { this(null); } public QPlotter(QWidget parent) { super(parent); setBackgroundRole(QPalette.ColorRole.Dark); setAutoFillBackground(true); setSizePolicy(QSizePolicy.Policy.Expanding, QSizePolicy.Policy.Expanding); setFocusPolicy(Qt.FocusPolicy.StrongFocus); rubberBandIsShown = false; // 初始化缩放按钮 zoomInButton = new QToolButton(this); zoomInButton.setIcon(new QIcon(":/toolbar/zoomin.png")); zoomInButton.adjustSize(); zoomInButton.clicked.connect(this::zoomIn); zoomOutButton = new QToolButton(this); zoomOutButton.setIcon(new QIcon(":/toolbar/zoomout.png")); zoomOutButton.adjustSize(); zoomOutButton.clicked.connect(this::zoomOut); // 初始化状态标签 statusLabel = new QLabel(this); statusLabel.setStyleSheet("background-color: rgba(255, 0, 0, 100); padding: 3px; border-radius: 3px;"); statusLabel.hide(); setMouseTracking(true); setPlotSettings(new QPlotSettings()); } // 空间网格加速类 private class SpatialGrid { private static final int CELL_SIZE = 50; private final QMap<QPair<Integer, Integer>, QList<QPointF>> grid = "QMap<QPair<Integer, Integer>, QList<QPointF>>".create(); private QRectF dataRange; void build(QList<QPointF> points) { grid.clear(); if (points.isEmpty()) return; dataRange = new QRectF(points.get(0).x(), points.get(0).y(), 0, 0); for (QPointF p : points) { int xCell = (int)(p.x() / CELL_SIZE); int yCell = (int)(p.y() / CELL_SIZE); QPair<Integer, Integer> key = new QPair<>(xCell, yCell); QList<QPointF> cell = grid.getOrDefault(key, new QList<>(QPointF.class)); cell.add(p); grid.put(key, cell); dataRange = dataRange.united(new QRectF(p.x(), p.y(), 0, 0)); } } QPointF findNearest(QPointF mousePos, double maxDist) { if (grid.isEmpty()) return null; int xCell = (int)(mousePos.x() / CELL_SIZE); int yCell = (int)(mousePos.y() / CELL_SIZE); AtomicReference<Double> minDistSq = new AtomicReference<>(maxDist * maxDist); AtomicReference<QPointF> nearest = new AtomicReference<>(null); for (int dx = -1; dx <= 1; dx++) { for (int dy = -1; dy <= 1; dy++) { QPair<Integer, Integer> key = new QPair<>(xCell + dx, yCell + dy); QList<QPointF> cell = grid.get(key); if (cell != null) { cell.forEach(p -> { double dxVal = p.x() - mousePos.x(); double dyVal = p.y() - mousePos.y(); double distSq = dxVal * dxVal + dyVal * dyVal; if (distSq < minDistSq.get()) { minDistSq.set(distSq); nearest.set(p); } }); } } } return nearest.get(); } } public void setPlotSettings(QPlotSettings settings) { zoomStack.clear(); zoomStack.append(settings); curZoom = 0; updateZoomButtons(); refreshPixmap(); } public void zoomIn() { if (curZoom < zoomStack.size() - 1) { curZoom++; updateZoomButtons(); refreshPixmap(); } } public void zoomOut() { if (curZoom > 0) { curZoom--; updateZoomButtons(); refreshPixmap(); } } private void updateZoomButtons() { zoomInButton.setEnabled(curZoom < zoomStack.size() - 1); zoomOutButton.setEnabled(curZoom > 0); } public void setCurveData(String id, QList<QPointF> data) { curveMap.put(id, data); dataDirty = true; // 标记数据变化 refreshPixmap(); } public void clearCurve(String id) { curveMap.remove(id); dataDirty = true; // 标记数据变化 refreshPixmap(); } // 新增方法:设置坐标轴标签 public void setAxisLabels(String xLabel, String yLabel) { this.xLabel = xLabel; this.yLabel = yLabel; refreshPixmap(); } // 新增方法:设置图表标题 public void setTitle(String title) { this.title = title; refreshPixmap(); } @Override public QSize minimumSizeHint() { return new QSize(6 * Margin, 4 * Margin); } @Override public QSize sizeHint() { return new QSize(12 * Margin, 8 * Margin); } @Override public void paintEvent(QPaintEvent e) { QStylePainter painter = new QStylePainter(this); painter.drawPixmap(0, 0, pixmap); if (rubberBandIsShown) { painter.setRenderHint(QPainter.RenderHint.Antialiasing); painter.setPen(new QColor(64, 64, 64, 200)); painter.setBrush(new QColor(200, 200, 200, 50)); painter.drawRect(rubberBandRect); } if (hasFocus()) { QStyleOptionFocusRect option = new QStyleOptionFocusRect(); option.initFrom(this); option.setBackgroundColor(palette().dark().color()); painter.drawPrimitive(QStyle.PrimitiveElement.PE_FrameFocusRect, option); } // 绘制高亮点 if (hoverPoint != null) { painter.setRenderHint(QPainter.RenderHint.Antialiasing); QPoint pos = dataToWidget(hoverPoint); painter.setPen(Qt.GlobalColor.red); painter.setBrush(new QColor(255, 0, 0, 100)); painter.drawEllipse(pos.x() - 5, pos.y() - 5, 10, 10); } painter.end(); } @Override public void resizeEvent(QResizeEvent e) { int x = width() - (zoomInButton.width() + zoomOutButton.width() + 10); zoomInButton.move(x, 5); zoomOutButton.move(x + zoomInButton.width() + 5, 5); refreshPixmap(); } @Override public void mousePressEvent(QMouseEvent e) { QRect plotArea = new QRect(Margin, Margin, width() - 2 * Margin, height() - 2 * Margin); if (e.button() == Qt.MouseButton.LeftButton && plotArea.contains(e.pos())) { rubberBandIsShown = true; rubberBandRect.setTopLeft(e.pos()); rubberBandRect.setBottomRight(e.pos()); updateRubberBandRegion(); setCursor(Qt.CursorShape.CrossCursor); } } @Override public void mouseMoveEvent(QMouseEvent e) { // 处理橡皮筋 if (rubberBandIsShown) { QRect plotArea = new QRect(Margin, Margin, width() - 2 * Margin, height() - 2 * Margin); int x = Math.min(Math.max(e.pos().x(), plotArea.left()), plotArea.right()); int y = Math.min(Math.max(e.pos().y(), plotArea.top()), plotArea.bottom()); updateRubberBandRegion(); rubberBandRect.setBottomRight(new QPoint(x, y)); updateRubberBandRegion(); } // 处理悬停 QPointF dataPos = widgetToData(e.pos()); findHoverPoint(dataPos, e.pos()); updateHoverDisplay(e.globalPos()); update(); } private QPointF widgetToData(QPoint widgetPos) { QPlotSettings settings = zoomStack.get(curZoom); QRect plotArea = new QRect(Margin, Margin, width() - 2 * Margin, height() - 2 * Margin); double x = settings.minX + (widgetPos.x() - plotArea.x()) * settings.spanX() / plotArea.width(); double y = settings.maxY - (widgetPos.y() - plotArea.y()) * settings.spanY() / plotArea.height(); return new QPointF(x, y); } private QPoint dataToWidget(QPointF dataPoint) { QPlotSettings settings = zoomStack.get(curZoom); QRect plotArea = new QRect(Margin, Margin, width() - 2 * Margin, height() - 2 * Margin); int x = Margin + (int)((dataPoint.x() - settings.minX) * plotArea.width() / settings.spanX()); int y = Margin + (int)((settings.maxY - dataPoint.y()) * plotArea.height() / settings.spanY()); return new QPoint(x, y); } private void findHoverPoint(QPointF dataPos, QPoint widgetPos) { highlightedCurve = null; hoverPoint = null; for (String curveId : curveMap.keySet()) { QList<QPointF> points = curveMap.get(curveId); if (points.isEmpty()) continue; if (spatialGrid == null || dataDirty) { spatialGrid = new SpatialGrid(); spatialGrid.build(points); dataDirty = false; } else if (!spatialGrid.dataRange.contains(dataPos)){ spatialGrid.build(points); } QPointF nearest = spatialGrid.findNearest(dataPos, HOVER_THRESHOLD); if (nearest != null) { QPoint nearestWidgetPos = dataToWidget(nearest); // 手动计算两点距离 double dx = nearestWidgetPos.x() - widgetPos.x(); double dy = nearestWidgetPos.y() - widgetPos.y(); double distance = Math.sqrt(dx*dx + dy*dy); if (distance <= HOVER_THRESHOLD) { highlightedCurve = curveId; hoverPoint = nearest; break; } } } } private void updateHoverDisplay(QPoint globalPos) { if (hoverPoint != null) { statusLabel.setText(String.format("(%.3f, %.3f)", hoverPoint.x(), hoverPoint.y())); statusLabel.adjustSize(); QPoint localPos = mapFromGlobal(globalPos).add(new QPoint(15, -20)); statusLabel.move(localPos); statusLabel.show(); } else { statusLabel.hide(); } } @Override public void mouseReleaseEvent(QMouseEvent e) { if (e.button() == Qt.MouseButton.LeftButton && rubberBandIsShown) { rubberBandIsShown = false; updateRubberBandRegion(); unsetCursor(); QRect rect = rubberBandRect.normalized(); if (rect.width() < 4 || rect.height() < 4) return; QRect plotArea = new QRect(Margin, Margin, width() - 2 * Margin, height() - 2 * Margin); QPlotSettings prevSettings = zoomStack.get(curZoom); double xRatio = prevSettings.spanX() / plotArea.width(); double yRatio = prevSettings.spanY() / plotArea.height(); QPlotSettings settings = new QPlotSettings(); settings.minX = prevSettings.minX + xRatio * (rect.left() - plotArea.left()); settings.maxX = prevSettings.minX + xRatio * (rect.right() - plotArea.left()); settings.minY = prevSettings.maxY - yRatio * (rect.bottom() - plotArea.top()); settings.maxY = prevSettings.maxY - yRatio * (rect.top() - plotArea.top()); if (settings.spanX() <= 0 || settings.spanY() <= 0) return; settings.adjust(); if (curZoom < zoomStack.size() - 1) { zoomStack = new QList<>(zoomStack.mid(0, curZoom + 1)); } zoomStack.add(settings); curZoom = zoomStack.size() - 1; updateZoomButtons(); refreshPixmap(); } } @Override public void leaveEvent(QEvent e) { highlightedCurve = null; hoverPoint = null; statusLabel.hide(); update(); } @Override public void keyPressEvent(QKeyEvent e) { switch (Qt.Key.resolve(e.key())) { case Key_Plus: zoomIn(); break; case Key_Minus: zoomOut(); break; case Key_Left: zoomStack.get(curZoom).scroll(-1, 0); break; case Key_Right: zoomStack.get(curZoom).scroll(+1, 0); break; case Key_Down: zoomStack.get(curZoom).scroll(0, -1); break; case Key_Up: zoomStack.get(curZoom).scroll(0, +1); break; default: super.keyPressEvent(e); } refreshPixmap(); } private void updateRubberBandRegion() { update(rubberBandRect.normalized().adjusted(-1, -1, 1, 1)); } private void refreshPixmap() { if (pixmap != null) { pixmap.dispose(); // 显式释放资源 } pixmap = new QPixmap(size()); pixmap.fill(palette().color(QPalette.ColorRole.Window)); QPainter painter = new QPainter(pixmap); try { painter.setRenderHint(QPainter.RenderHint.Antialiasing); drawGrid(painter); drawCurves(painter); drawLegend(painter); } finally { painter.end(); } update(); } private void drawGrid(QPainter painter) { QRect rect = new QRect(Margin, Margin, width() - 2 * Margin, height() - 2 * Margin); if (!rect.isValid()) return; QPlotSettings settings = zoomStack.get(curZoom); QFont labelFont = new QFont(font()); labelFont.setBold(true); QFontMetrics fm = painter.fontMetrics(); // ================ 绘制标题 ================ if (!title.isEmpty()) { painter.setFont(labelFont); // 标题位置上移,距顶部10像素 painter.drawText(0, 10, width(), 30, Qt.AlignmentFlag.AlignCenter.value(), title); } // ================ 绘制X轴标签 ================ if (!xLabel.isEmpty()) { painter.setFont(labelFont); // 位于X轴左端下方(图左下角) painter.drawText(width() - Margin, height() - Margin / 2, width() - 2*Margin, Margin, Qt.AlignmentFlag.AlignLeft.value(), xLabel); } // ================ 绘制Y轴标签 ================ if (!yLabel.isEmpty()) { painter.setFont(labelFont); // 垂直排列在Y轴下端左侧 int startX = 5; int startY = Margin / 2; int charHeight = fm.height(); // 将字符串转换为字符数组 char[] chars = yLabel.toCharArray(); for (int i = 0; i < chars.length; i++) { String ch = String.valueOf(chars[i]); // 每个字符单独绘制 painter.drawText(startX, startY + i*charHeight, ch); } } QPen axisPen = new QPen(palette().color(QPalette.ColorRole.WindowText), 1); painter.setFont(font()); // X轴 for (int i = 0; i <= settings.numXTicks; i++) { double value = settings.minX + (i * settings.spanX() / settings.numXTicks); int x = rect.left() + (int)((value - settings.minX) * rect.width() / settings.spanX()); painter.setPen(axisPen); painter.drawLine(x, rect.top(), x, rect.bottom()); String text = String.format("%.2f", value); painter.drawText(x - 50, rect.bottom() + 5, 100, 20, Qt.AlignmentFlag.AlignHCenter.value() | Qt.AlignmentFlag.AlignTop.value(), text); } // Y轴 for (int j = 0; j <= settings.numYTicks; j++) { double value = settings.minY + (j * settings.spanY() / settings.numYTicks); int y = rect.bottom() - (int)((value - settings.minY) * rect.height() / settings.spanY()); painter.setPen(axisPen); painter.drawLine(rect.left(), y, rect.right(), y); String text = String.format("%.2f", value); painter.drawText(rect.left() - Margin, y - 10, Margin - 5, 20, Qt.AlignmentFlag.AlignRight.value() | Qt.AlignmentFlag.AlignVCenter.value(), text); } painter.drawRect(rect.adjusted(0, 0, -1, -1)); } private void drawCurves(QPainter painter) { QPlotSettings settings = zoomStack.get(curZoom); QRect rect = new QRect(Margin, Margin, width() - 2 * Margin, height() - 2 * Margin); if (!rect.isValid()) return; painter.setClipRect(rect.adjusted(+1, +1, -1, -1)); int colorId = 0; for (String id : curveMap.keySet()) { QList<QPointF> data = curveMap.get(id); QPolygonF polyline = new QPolygonF(); for (QPointF point : data) { double x = rect.left() + ((point.x() - settings.minX) * rect.width() / settings.spanX()); double y = rect.bottom() - ((point.y() - settings.minY) * rect.height() / settings.spanY()); polyline.add(new QPointF(x, y)); } boolean isHighlighted = id.equals(highlightedCurve); float hue = (colorId * 0.618f) % 1.0f; QColor color = QColor.fromHsvF(hue, 0.8f, 0.8f); color.setAlphaF(isHighlighted ? 1.0f : 0.6f); painter.setPen(new QPen(color, isHighlighted ? 3 : 1)); painter.drawPolyline(polyline); colorId++; } } private void drawLegend(QPainter painter) { int legendX = width() - 150; int legendY = Margin + 20; int colorId = 0; painter.setFont(font()); painter.setPen(palette().color(QPalette.ColorRole.WindowText)); for (String id : curveMap.keySet()) { float hue = (colorId * 0.618f) % 1.0f; QColor color = QColor.fromHsvF(hue, 0.8f, 0.8f); painter.fillRect(legendX, legendY - 10, 15, 15, color); painter.drawText(legendX + 20, legendY + 5, id); legendY += 20; colorId++; } } public void autoScale() { if (curveMap.isEmpty()) { setPlotSettings(new QPlotSettings()); // 设置默认范围 return; } double minX = Double.MAX_VALUE; double maxX = -Double.MAX_VALUE; double minY = Double.MAX_VALUE; double maxY = -Double.MAX_VALUE; for (QList<QPointF> data : curveMap.values()) { for (QPointF point : data) { minX = Math.min(minX, point.x()); maxX = Math.max(maxX, point.x()); minY = Math.min(minY, point.y()); maxY = Math.max(maxY, point.y()); } } if (minX == maxX) { minX -= 1.0; maxX += 1.0; } if (minY == maxY) { minY -= 1.0; maxY += 1.0; } double xMargin = 0.1 * (maxX - minX); double yMargin = 0.1 * (maxY - minY); QPlotSettings settings = new QPlotSettings(); settings.minX = minX - xMargin; settings.maxX = maxX + xMargin; settings.minY = minY - yMargin; settings.maxY = maxY + yMargin; settings.adjust(); setPlotSettings(settings); } public static class QPlotSettings { public double minX; public double maxX; public int numXTicks; public double minY; public double maxY; public int numYTicks; public QPlotSettings() { minX = 0.0; maxX = 10.0; numXTicks = 5; minY = 0.0; maxY = 10.0; numYTicks = 5; } public double spanX() { return maxX - minX; } public double spanY() { return maxY - minY; } public void scroll(int dx, int dy) { double stepX = spanX() / numXTicks; minX += dx * stepX; maxX += dx * stepX; double stepY = spanY() / numYTicks; minY += dy * stepY; maxY += dy * stepY; } public void adjust() { adjustAxis(true); adjustAxis(false); } private void adjustAxis(boolean isXAxis) { double min = isXAxis ? minX : minY; double max = isXAxis ? maxX : maxY; final int MinTicks = 4; if (Math.abs(max - min) < 1e-6) { max = min + (min >= 0 ? 1e-6 : -1e-6); } double range = max - min; double grossStep = range / MinTicks; double step = calculateOptimalStep(grossStep); double newMin = Math.floor(min/step)*step; double newMax = Math.ceil(max/step)*step; int numTicks = (int) Math.round((newMax - newMin)/step); while(numTicks < MinTicks) { step /= 2.0; newMin = Math.floor(min/step)*step; newMax = Math.ceil(max/step)*step; numTicks = (int) Math.round((newMax - newMin)/step); } if (isXAxis) { this.minX = newMin; this.maxX = newMax; this.numXTicks = numTicks; } else { this.minY = newMin; this.maxY = newMax; this.numYTicks = numTicks; } } private double calculateOptimalStep(double grossStep) { double absStep = Math.abs(grossStep); double exponent = Math.floor(Math.log10(absStep)); double fraction = absStep / Math.pow(10, exponent); double[] candidates = {1.0, 2.0, 5.0, 10.0}; double optimal = 10.0; for (double candidate : candidates) { if (candidate >= fraction) { optimal = candidate; break; } } double step = optimal * Math.pow(10, exponent); return grossStep < 0 ? -step : step; } } }
测试代码
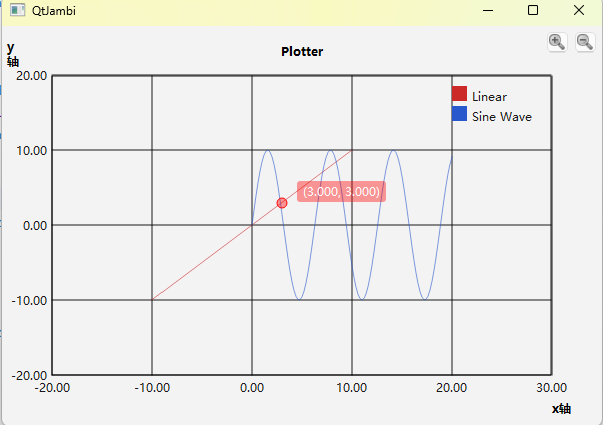
package one;

import io.qt.core.QList;
import io.qt.core.QPointF;
import jqt.Jqt;
import jqt.QPlotter;

public class Main{

    public static void main(String[] args){
        Jqt qt = new Jqt(args, null);
        QPlotter plotter = new QPlotter();
        // 测试数据1:正负线性数据
        QList<QPointF> linearData = new QList<>(QPointF.class);
        for (int i = -10; i <= 10; i++) {
            linearData.add(new QPointF(i, i));
        }

        // 测试数据2:完整正弦波
        QList<QPointF> sineData = new QList<>(QPointF.class);
        for (int i = 0; i <= 100; i++) {
            double x = i * 0.2;
            sineData.add(new QPointF(x, 10 * Math.sin(x)));
        }
        plotter.setTitle("Plotter");
        plotter.setAxisLabels("x轴", "y轴");
        plotter.setCurveData("Linear", linearData);
        plotter.setCurveData("Sine Wave", sineData);
        plotter.autoScale();
        plotter.show();
        qt.run();
    }

}
运行效果图

 浙公网安备 33010602011771号