1 from pylab import *
2
3 # 设置图片尺寸和分辨率
4 figure(figsize=(10, 6), dpi=80)
5
6 # 创建一个新的 1 * 1 的子图,接下来的图样绘制在其中的第 1 块(也是唯一的一块)
7 subplot(1, 1, 1)
8
9 X = np.linspace(-np.pi, np.pi, 256, endpoint=True)
10 C, S = np.cos(X), np.sin(X)
11
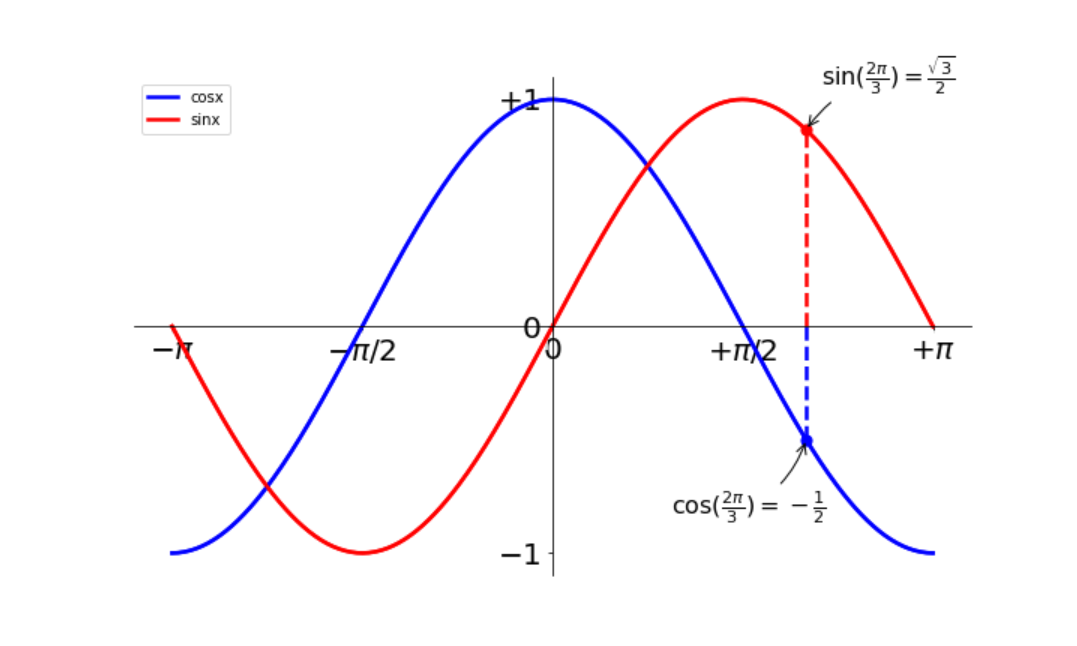
12 # 绘制余弦曲线,使用蓝色的、连续的、宽度为 2.5 (像素)的线条(可修改颜色及粗细)
13 plot(X, C, color="blue", linewidth=2.5, linestyle="-")
14
15 # 绘制正弦曲线,使用红色的、连续的、宽度为 2.5 (像素)的线条(可修改颜色及粗细)
16 plot(X, S, color="red", linewidth=2.5, linestyle="-")
17
18 # 设置横轴的上下限
19 xlim(-4.0, 4.0)
20
21 # 设置横轴记号
22 xticks(np.linspace(-4, 4, 9, endpoint=True))
23
24 # 设置纵轴的上下限
25 ylim(-1.0, 1.0)
26
27 # 设置纵轴记号
28 yticks(np.linspace(-1, 1, 5, endpoint=True))
29
30 # 设置图片边界
31 xmin, xmax = X.min(), X.max()
32 ymin, ymax = C.min(), C.max()
33
34 dx = (xmax - xmin) * 0.05
35 dy = (ymax - ymin) * 0.05
36
37 xlim(xmin - dx, xmax + dx)
38 ylim(ymin - dy, ymax + dy)
39
40 # 设置x、y轴记号
41 xticks([-np.pi, -np.pi / 2, 0, np.pi / 2, np.pi])
42 yticks([-1, 0, +1])
43
44 xticks([-np.pi, -np.pi / 2, 0, np.pi / 2, np.pi],
45 [r'$-\pi$', r'$-\pi/2$', r'$0$', r'$+\pi/2$', r'$+\pi$'])
46
47 yticks([-1, 0, +1],
48 [r'$-1$', r'$0$', r'$+1$'])
49
50 # 设置脊柱
51 # 右上两条脊柱的颜色设为none,左下的脊柱进行移动
52 ax = gca()
53 ax.spines['right'].set_color('none')
54 ax.spines['top'].set_color('none')
55 ax.xaxis.set_ticks_position('bottom')
56 ax.spines['bottom'].set_position(('data', 0))
57 ax.yaxis.set_ticks_position('left')
58 ax.spines['left'].set_position(('data', 0))
59
60 # 对x、y轴上的记号进行处理
61 for label in ax.get_xticklabels() + ax.get_yticklabels():
62 label.set_fontsize(20)
63 label.set_bbox(dict(facecolor='white', edgecolor='None', alpha=0.8))
64
65 # 设置图例
66 plot(X, C, color="blue", linewidth=2.5, linestyle="-", label="cosx")
67 plot(X, S, color="red", linewidth=2.5, linestyle="-", label="sinx")
68
69 legend(loc='upper left')
70
71 # 特殊点注释
72 t = 2 * np.pi / 3
73 plot([t, t], [0, np.cos(t)], color='blue', linewidth=2.5, linestyle="--")
74 scatter([t, ], [np.cos(t), ], 50, color='blue')
75
76 annotate(r'$\sin(\frac{2\pi}{3})=\frac{\sqrt{3}}{2}$',
77 xy=(t, np.sin(t)), xycoords='data',
78 xytext=(+10, +30), textcoords='offset points', fontsize=16,
79 arrowprops=dict(arrowstyle="->", connectionstyle="arc3,rad=.2"))
80
81 plot([t, t], [0, np.sin(t)], color='red', linewidth=2.5, linestyle="--")
82 scatter([t, ], [np.sin(t), ], 50, color='red')
83
84 annotate(r'$\cos(\frac{2\pi}{3})=-\frac{1}{2}$',
85 xy=(t, np.cos(t)), xycoords='data',
86 xytext=(-90, -50), textcoords='offset points', fontsize=16,
87 arrowprops=dict(arrowstyle="->", connectionstyle="arc3,rad=.2"))
88
89 # 以分辨率 80 来保存图片
90 savefig("ang.png", dpi=72)
91
92 show()

 浙公网安备 33010602011771号