


2018.11.12
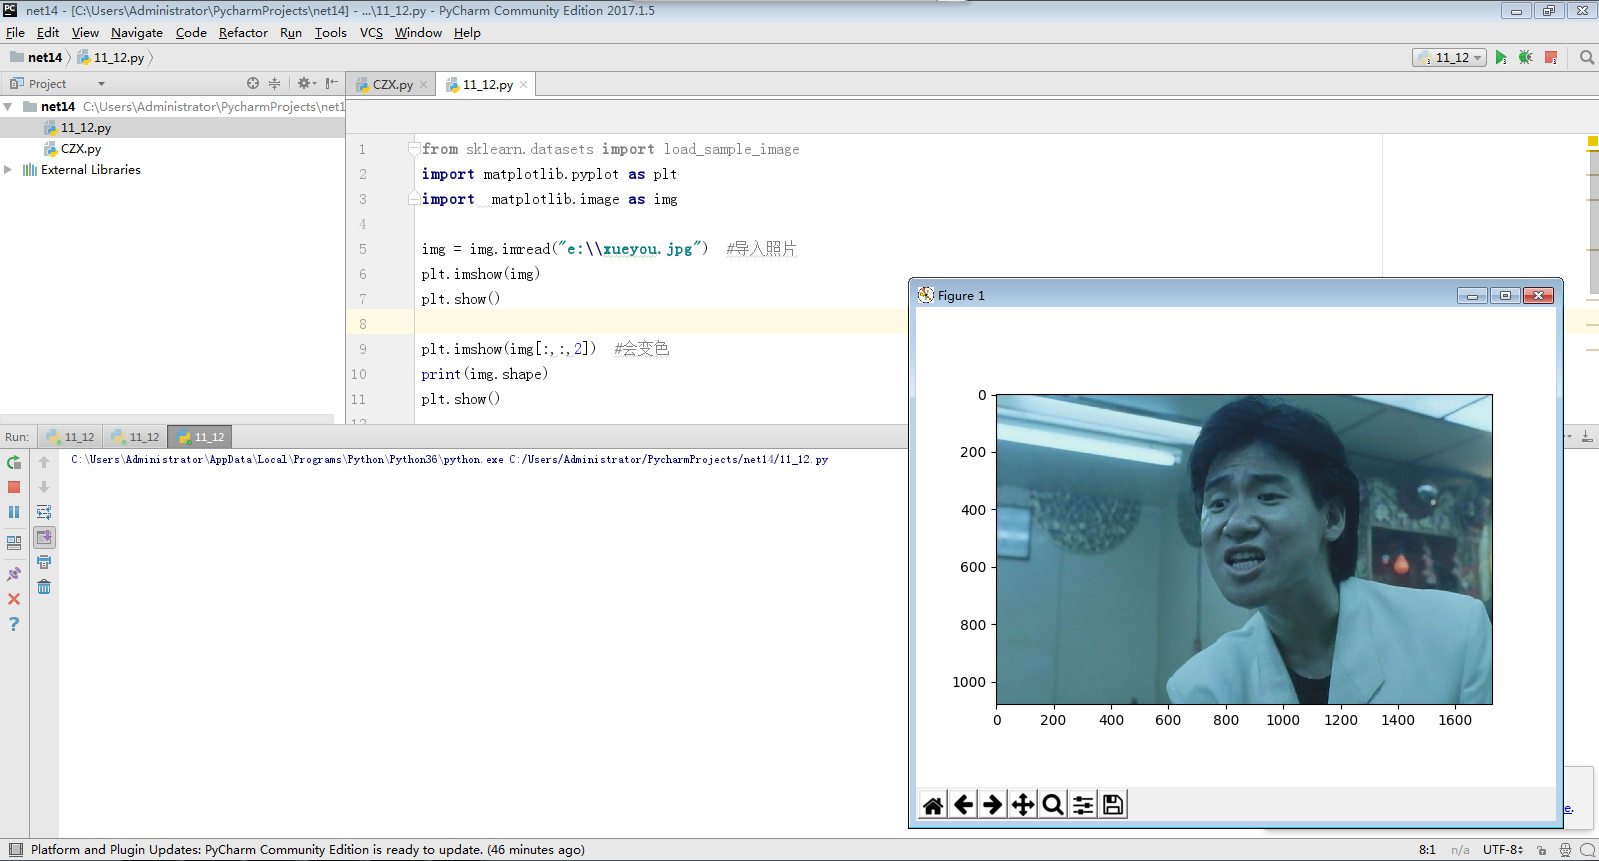
1.读取一张示例图片或自己准备的图片,观察图片存放数据特点。
from sklearn.datasets import load_sample_image
import matplotlib.pyplot as plt
import  matplotlib.image as img

img = img.imread("e:\\wujing.jpg")
plt.imshow(img)
plt.show()
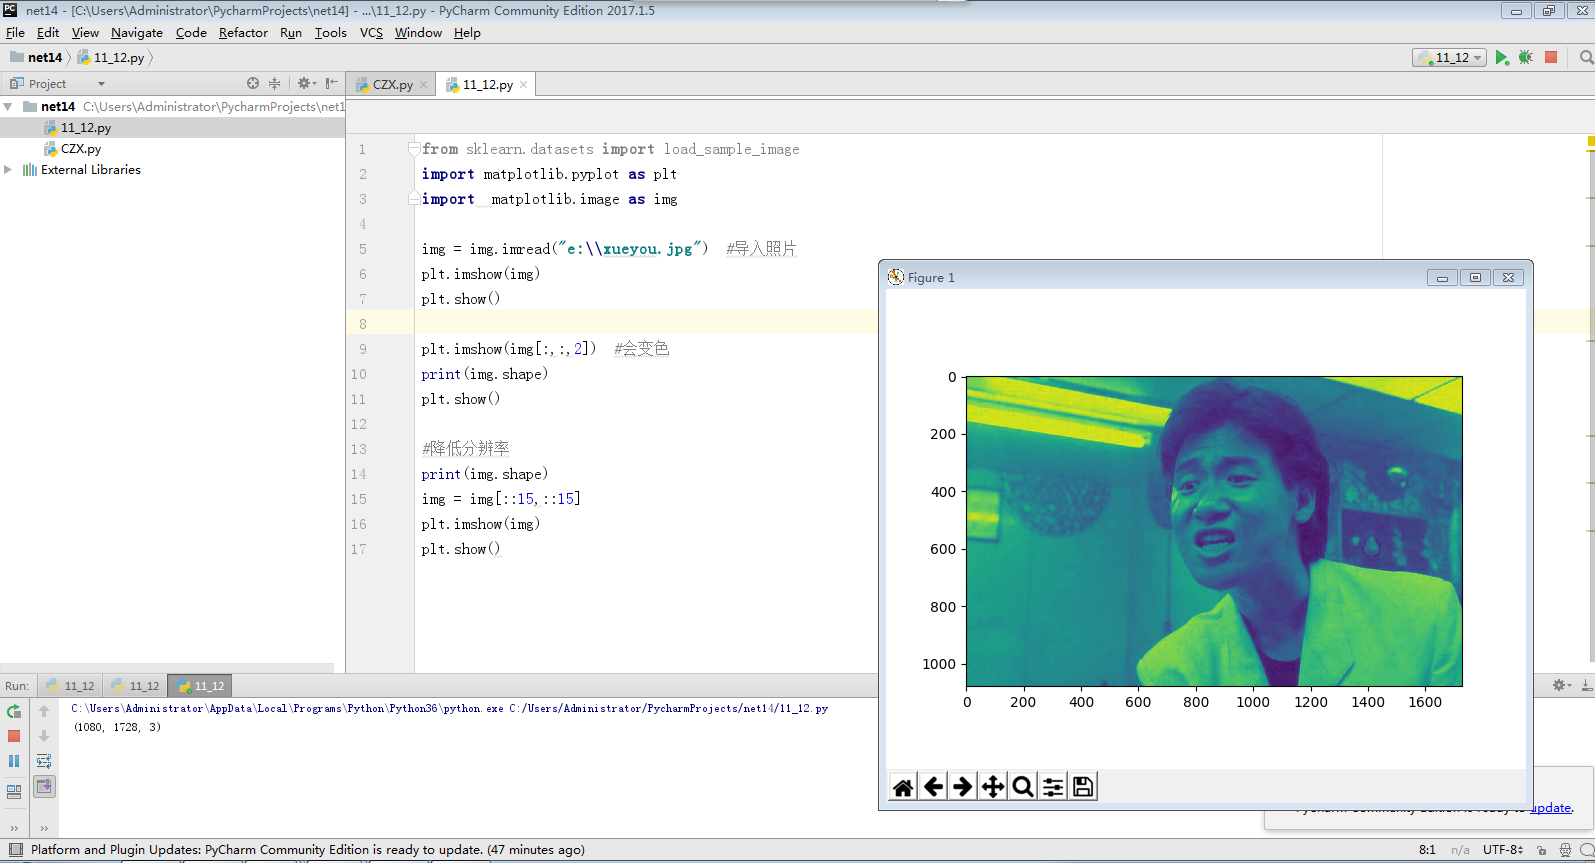
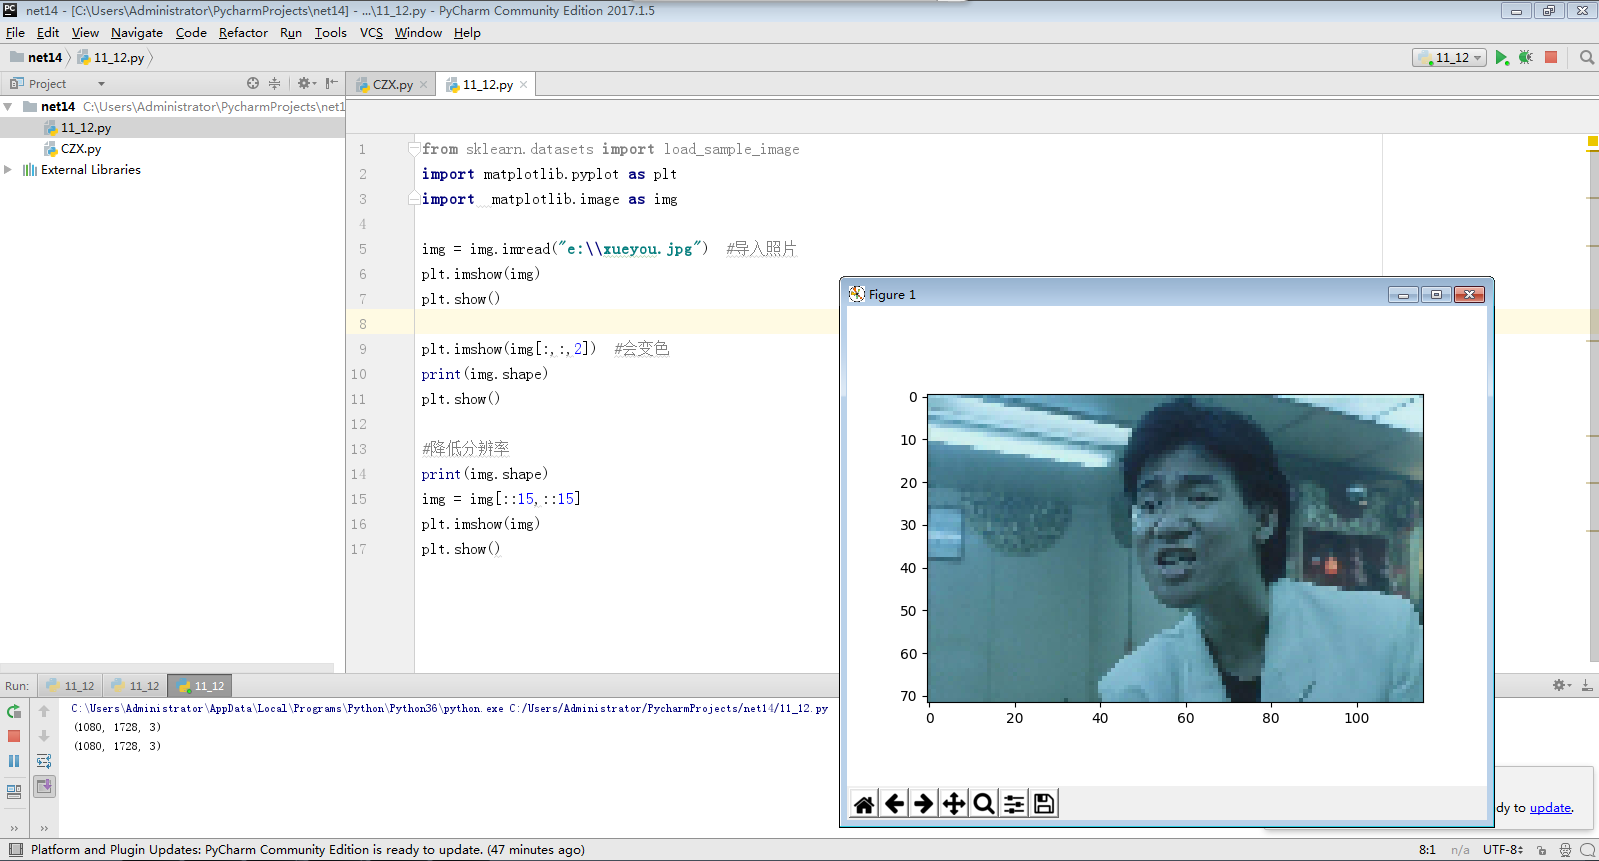
2.根据图片的分辨率,可适当降低分辨率。
#降低分辨率为1/15
print(img.shape)
img = img[::15,::15]
plt.imshow(img)
plt.show()
3.再用k均值聚类算法,将图片中所有的颜色值做聚类。
x=picture.reshape(-1,3)
n_colors=64
model=KMeans(n_colors)
labels=model.fit_predict(x)
colors=model.cluster_centers_
new_image=colors[labels]
new_image=new_image.reshape(picture.shape)
plt.imshow(new_image.astype(np.uint8))
img.imsave("E://yeshi.jpg",new_image)
plt.show()

print(sys.getsizeof(picture))
print(sys.getsizeof(new_image))


 浙公网安备 33010602011771号