python--sklearn,聚类结果可视化工具TSNE
TSNE提供了一种有效的降维方式,让我们对高于2维数据的聚类结果以二维的方式展示出来:
 1 #!/usr/bin/env python
 2 #-*- coding:utf-8 -*-
 3
 4 #接k_means.py
 5 #k_means.py中得到三维规范化数据data_zs;
 6 #r增加了最后一列,列索引为“聚类类别”
 7
 8 from sklearn.manifold import TSNE
 9
10 tsne=TSNE()
11 tsne.fit_transform(data_zs)  #进行数据降维,降成两维
12 #a=tsne.fit_transform(data_zs) #a是一个array,a相当于下面的tsne_embedding_
13 tsne=pd.DataFrame(tsne.embedding_,index=data_zs.index) #转换数据格式
14
15 import matplotlib.pyplot as plt
16
17 d=tsne[r[u'聚类类别']==0]
18 plt.plot(d[0],d[1],'r.')
19
20 d=tsne[r[u'聚类类别']==1]
21 plt.plot(d[0],d[1],'go')
22
23 d=tsne[r[u'聚类类别']==2]
24 plt.plot(d[0],d[1],'b*')
25
26 plt.show()
结果图: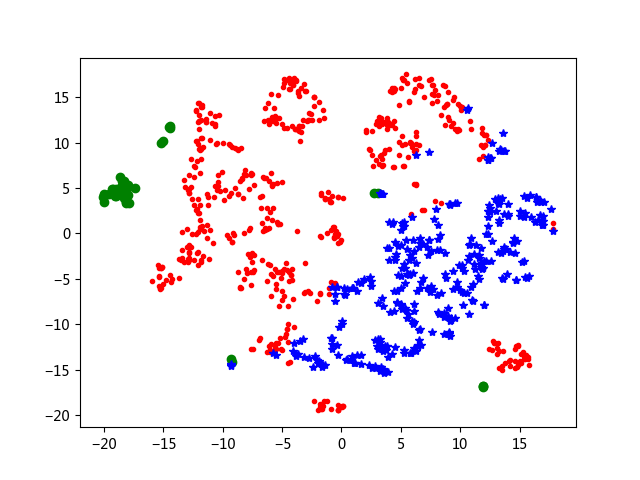
原数据data_zs是三维的数据!

 浙公网安备 33010602011771号