
python 对潜在客户数据集 进行数据分析
大家好,我是小寒。
今天给大家带来一篇 探索性数据分析(EDA) 案例分享。如果觉得不错,可以多多分享。
什么是探索性数据分析
探索性数据分析 (EDA) 是任何数据科学或数据分析项目的重要组成部分。EDA 背后的理念是在构建任何模型之前 检查和了解数据。
它查看数据集以发现异常值、模式和关系,并根据对给定数据集的理解形成假设。
以下内容是 EDA 的一部分:
- 从数据集中获得最大的洞察力
- 揭开底层结构
- 从数据集中提取重要特征
- 检查异常值
- 测试假设
EDA 是必不可少的,因为在动手之前了解问题陈述和数据特征之间的各种关系是一种很好的做法。
为什么 EDA 对 ML 项目很重要?
EDA 使理解数据集的结构变得容易,使数据建模更容易。
EDA 的主要目标是清洗数据,它有助于识别不正确的数据点,因此可以很容易地从数据集中删除它们。
从技术上讲,EDA 的主要动机是:
- 检查数据分布
- 处理缺失值和异常值
- 删除重复数据
- 编码类别变量
- 规范化和缩放
探索性数据分析案例
问题陈述:
我们需要对给定的 Lead Scoring 数据集执行 EDA,并做出尽可能多的推断。
数据集解释
我们可以在 Kaggle 上获得此数据集(https://www.kaggle.com/code/ashydv/lead-scoring-logistic-regression/data?select=Leads.csv)。
该数据集由各种属性组成,如潜在客户来源、网站上花费的总时间、总访问量、上次活动等,这些属性可能对最终决定潜在客户是否转换有用。
原始数据集共包含 37 列和 9240 行。为了简化,我们这里只考虑最重要的特征,这些特征是在对原始数据执行 EDA 后提取的。
本文所使用的特征说明如下:
| 变量 | 描述 |
|---|---|
| Prospect ID | 用于识别客户的唯一 ID。 |
| Lead Origin | 将客户识别为潜在客户的来源标识符。包括API、登陆页面提交等。 |
| Lead Source | 引流的来源。包括谷歌、自然搜索、Olark 聊天等。 |
| Converted | 目标变量。指示潜在客户是否已成功转换。 |
| Time Spent on Website | 客户在网站上花费的总时间。 |
| Last Activity | 客户执行的最后一项活动。包括打开的电子邮件、Olark 聊天对话等。 |
| Specialization | 客户之前工作的行业领域。包括 “ Select Specialization ” 级别,这意味着客户在填写表格时没有选择此选项。 |
| What is your current occupation | 指示客户是学生、失业者还是就业者。 |
数据准备
加载数据集
通过 pandas 的 read_csv 方法来读取 csv 文件。
import numpy as np
import pandas as pd
import matplotlib.pyplot as plt
import seaborn as sns
# Loading Dataset
data = pd.read_csv('Leads.csv')
# List of all the columns, to be dropped from the original data:
drop_list = ['How did you hear about X Education',
             'Lead Profile','Asymmetrique Activity Index',
             'Asymmetrique Activity Score',
             'Asymmetrique Profile Index',
             'Asymmetrique Profile Score',
             'Lead Number',
             'What matters most to you in choosing a course',
             'Search',
             'Magazine',
             'Newspaper Article',
             'X Education Forums',
             'Newspaper',
             'Digital Advertisement',
             'Through Recommendations',
             'Receive More Updates About Our Courses',
             'Update me on Supply Chain Content',
             'Get updates on DM Content',
             'I agree to pay the amount through cheque',
             'A free copy of Mastering The Interview',
             'Country']

# Dropping the columns
data = data.drop(drop_list, axis=1)
检查数据集是否有重复值:
sum(data.duplicated(subset = 'Prospect ID')) == 0
True
输出为 True,表示数据集中没有重复的行。
注意:许多列有很多的 “Select” 值,因为客户在填写表格时没有从给定列表中选择任何选项。这些 “Select” 值与 NULL 一样,所以我们必须用 NaN 替换它们。
data = data.replace('Select', np.nan)
让我们检查一下数据集中有多少空值:
Prospect ID                           0
Lead Origin                           0
Lead Source                          36
Do Not Email                          0
Do Not Call                           0
Converted                             0
TotalVisits                         137
Total Time Spent on Website           0
Page Views Per Visit                137
Last Activity                       103
Specialization                     3380
What is your current occupation    2690
Tags                               3353
Lead Quality                       4767
City                               3669
Last Notable Activity                 0
对于 int64/float64 数据类型的列,我们使用列的平均值替换 NaN 值。
对于 object 数据类型的列,我们使用 众数 来替换 NaN 的值。
你可以更好地处理空值,但对于本文,我们将采用最简单的方法来处理它们。
for col in data.columns:
    if data[col].dtypes == 'int64' or data[col].dtypes == 'float64':
        data[col].fillna(data[col].mean(), inplace=True)
    else:
        data[col].fillna(data[col].mode()[0], inplace=True)
探索性数据分析(EDA)
1.Converted
Converted 是目标变量,指示一个引流是否已成功转化(其中1代表转化,0 代表没有转化)。
data['Converted'].value_counts()
0    5679
1    3561
Name: Converted, dtype: int64
下面我们来看一下有多少转化率。
converted = round(sum(data['Converted']) / len(data['Converted'])*100, 2)
print(converted,'%')
38.54 %
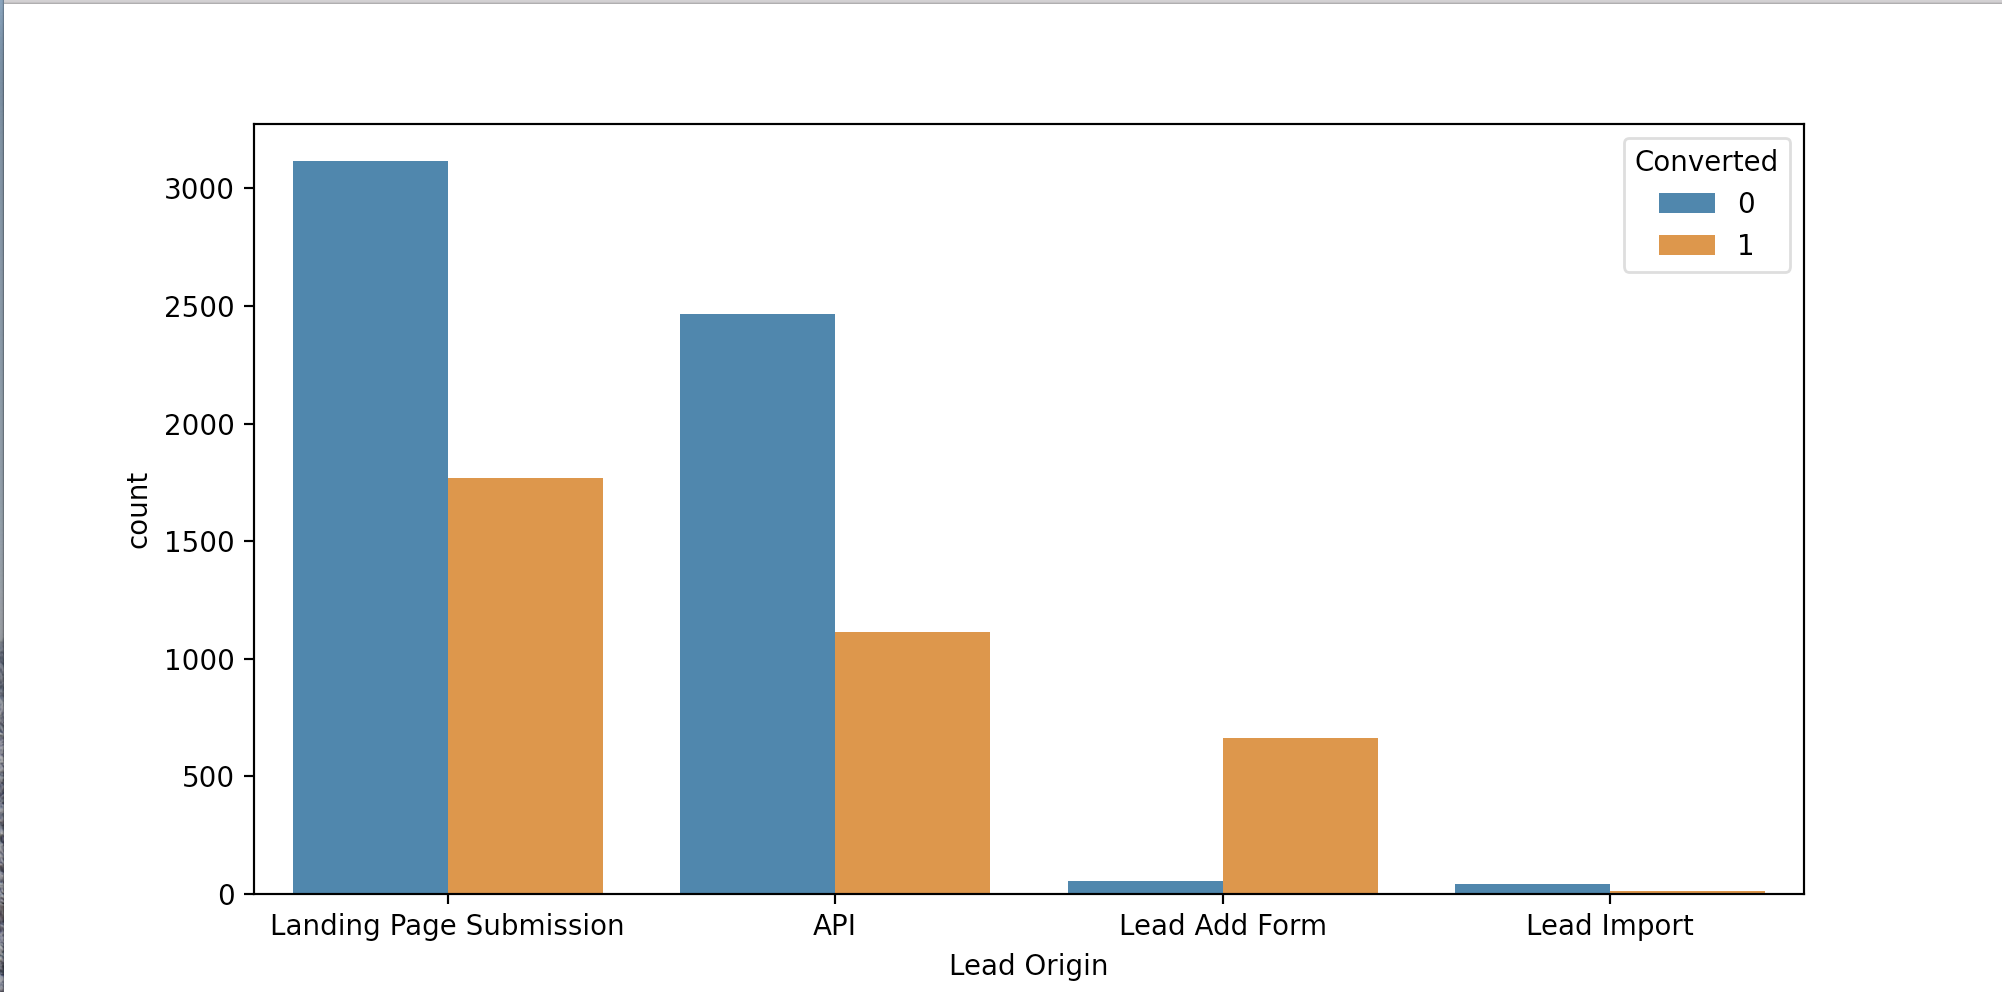
2. Lead Origin
data['Lead Origin'].value_counts()
我们删除出现1次的值。
data.drop(data.index[data['Lead Origin'] == 'Quick Add Form'], inplace=True)
# we plot the value counts with respect to the target variable
fig, axs = plt.subplots(figsize = (15,7.5))
sns.countplot(x = "Lead Origin", hue = "Converted", data = data, order = data['Lead Origin'].value_counts().index)
plt.show()
我们计算 Lead Origin 中每个值的转化率。
d = {}
for val in data['Lead Origin'].unique():
    a = data[data['Lead Origin'] == val]['Converted'].sum()
    b = data[data['Lead Origin'] == val]['Converted'].count()
    d[val] = [a, b, round(a/b*100, 2)]

pd.DataFrame.from_dict(d, orient='index').rename(columns = {0: 'Converted', 1: 'Leads',2: 'Conversion Ratio'}).sort_values(by=['Conversion Ratio'], ascending=False)
                         Converted  Leads  Conversion Ratio
Lead Add Form                  664    718             92.48
Landing Page Submission       1768   4886             36.19
API                           1115   3580             31.15
Lead Import                     13     55             23.64
推理:
- 最大潜在客户数量来自 “Landing Page Submission”,但转化率较低,即 36.19%。
- “Lead Add Form” 是表现最好的 Lead Origin,转化率为 92.48%。
3. Lead Source
data['Lead Source'].value_counts()
Google               2903
Direct Traffic       2543
Olark Chat           1755
Organic Search       1154
Reference             534
Welingak Website      142
Referral Sites        125
Facebook               55
bing                    6
google                  5
Click2call              4
Press_Release           2
Live Chat               2
Social Media            2
NC_EDM                  1
welearnblog_Home        1
Pay per Click Ads       1
blog                    1
testone                 1
youtubechannel          1
WeLearn                 1
其中有5个 “google”,我们可以将其替换为 “Google”
我们可以看到,有很多值的出现率非常低,我们可以用 “Others” 代替所有这些。
data['Lead Source'] = data['Lead Source'].replace(['google'], 'Google')
data['Lead Source'] = data['Lead Source']
.replace(['Click2call',
          'Live Chat',
          'NC_EDM',
          'Pay per Click Ads',
          'Press_Release',
          'Social Media',
          'WeLearn',
          'bing',
          'blog',
          'testone',
          'welearnblog_Home',
          'youtubechannel'], 'Others')
sns.countplot(x = "Lead Source", hue = "Converted", data = data, order = data['Lead Source'].value_counts().index)
plt.show()

计算 Lead Source 中每个值的转化率。
d = {}
for val in data['Lead Source'].unique():
    a = data[data['Lead Source'] == val]['Converted'].sum()
    b = data[data['Lead Source']==val]['Converted'].count()
    d[val] = [a, b, round(a/b*100, 2)]
pd.DataFrame.from_dict(d, orient='index').rename(columns = {0: 'Converted', 1: 'Leads',2: 'Conversion Ratio'}).sort_values(by=['Conversion Ratio'], ascending=False)
                  Converted  Leads  Conversion Ratio
Welingak Website        140    142             98.59
Reference               490    534             91.76
Google                 1175   2908             40.41
Others                    9     23             39.13
Organic Search          436   1154             37.78
Direct Traffic          818   2543             32.17
Olark Chat              448   1755             25.53
Referral Sites           31    125             24.80
Facebook                 13     55             23.64
推理:
- 潜在客户数量最多的来源是 “Google” 和 “Direct Traffic”,但转化率较低。
- “Welingak Website” 和 “Reference” 是表现最好的潜在客户来源,转化率分别为 98.59% 和 91.76%。
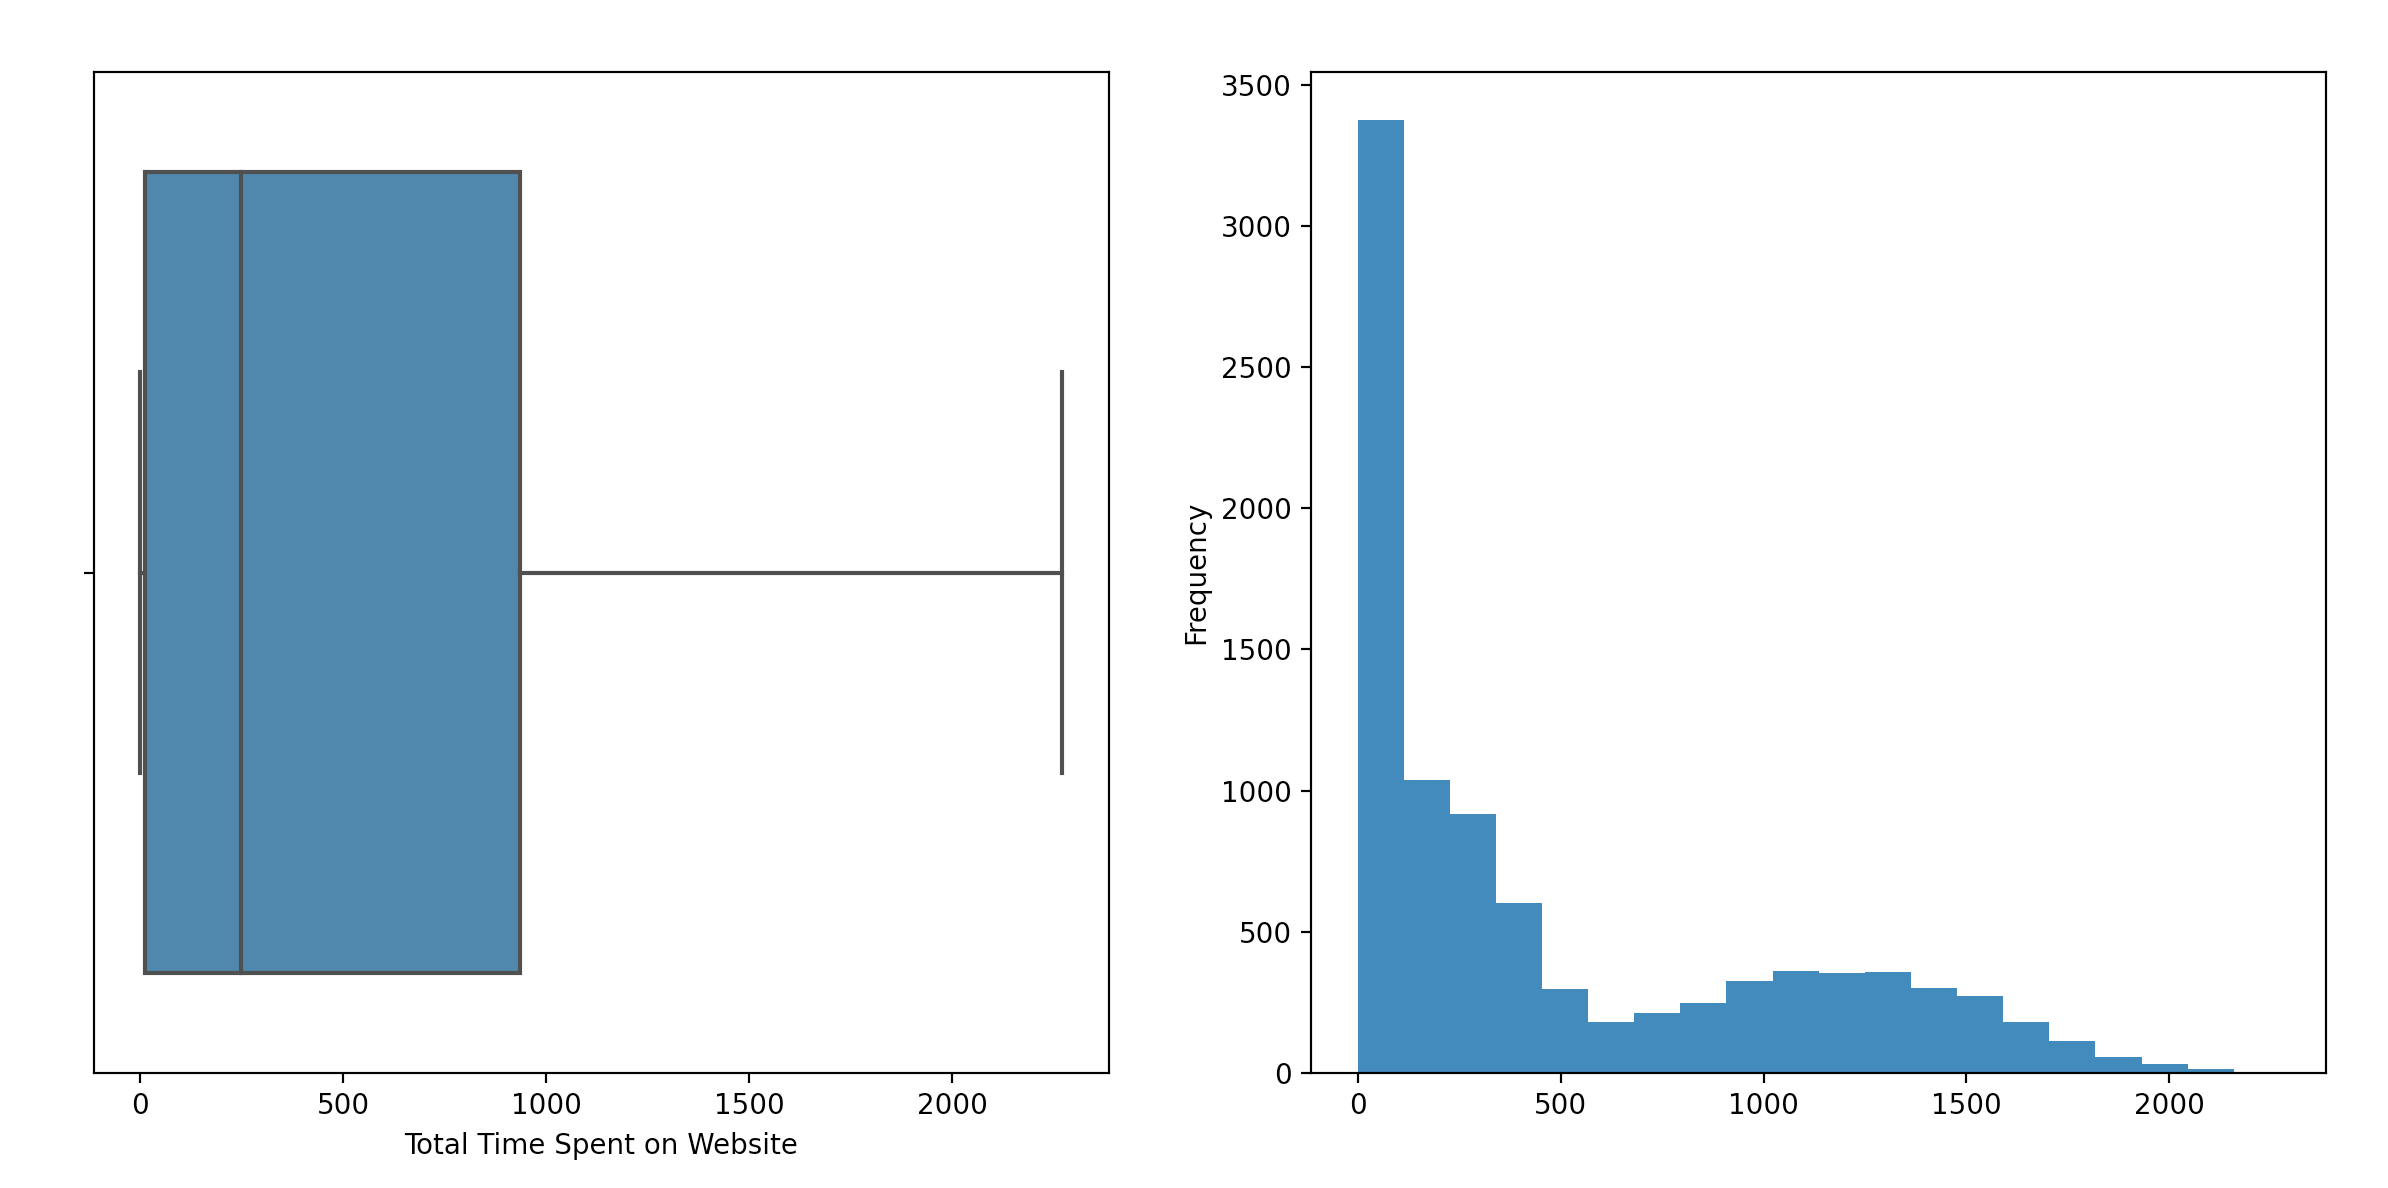
4.Total Time Spent on Website
data['Total Time Spent on Website'].describe()
count    9239.000000
mean      487.511094
std       547.755682
min         0.000000
25%        12.000000
50%       248.000000
75%       936.000000
max      2272.000000
Name: Total Time Spent on Website, dtype: float64
绘制箱线图和直方图
fig, axs = plt.subplots(1,2,figsize = (20,6.5))
sns.boxplot(data['Total Time Spent on Website'], ax = axs[0])
data['Total Time Spent on Website'].plot.hist(bins=20, ax = axs[1])
plt.show()
在目标变量上绘制箱线图。
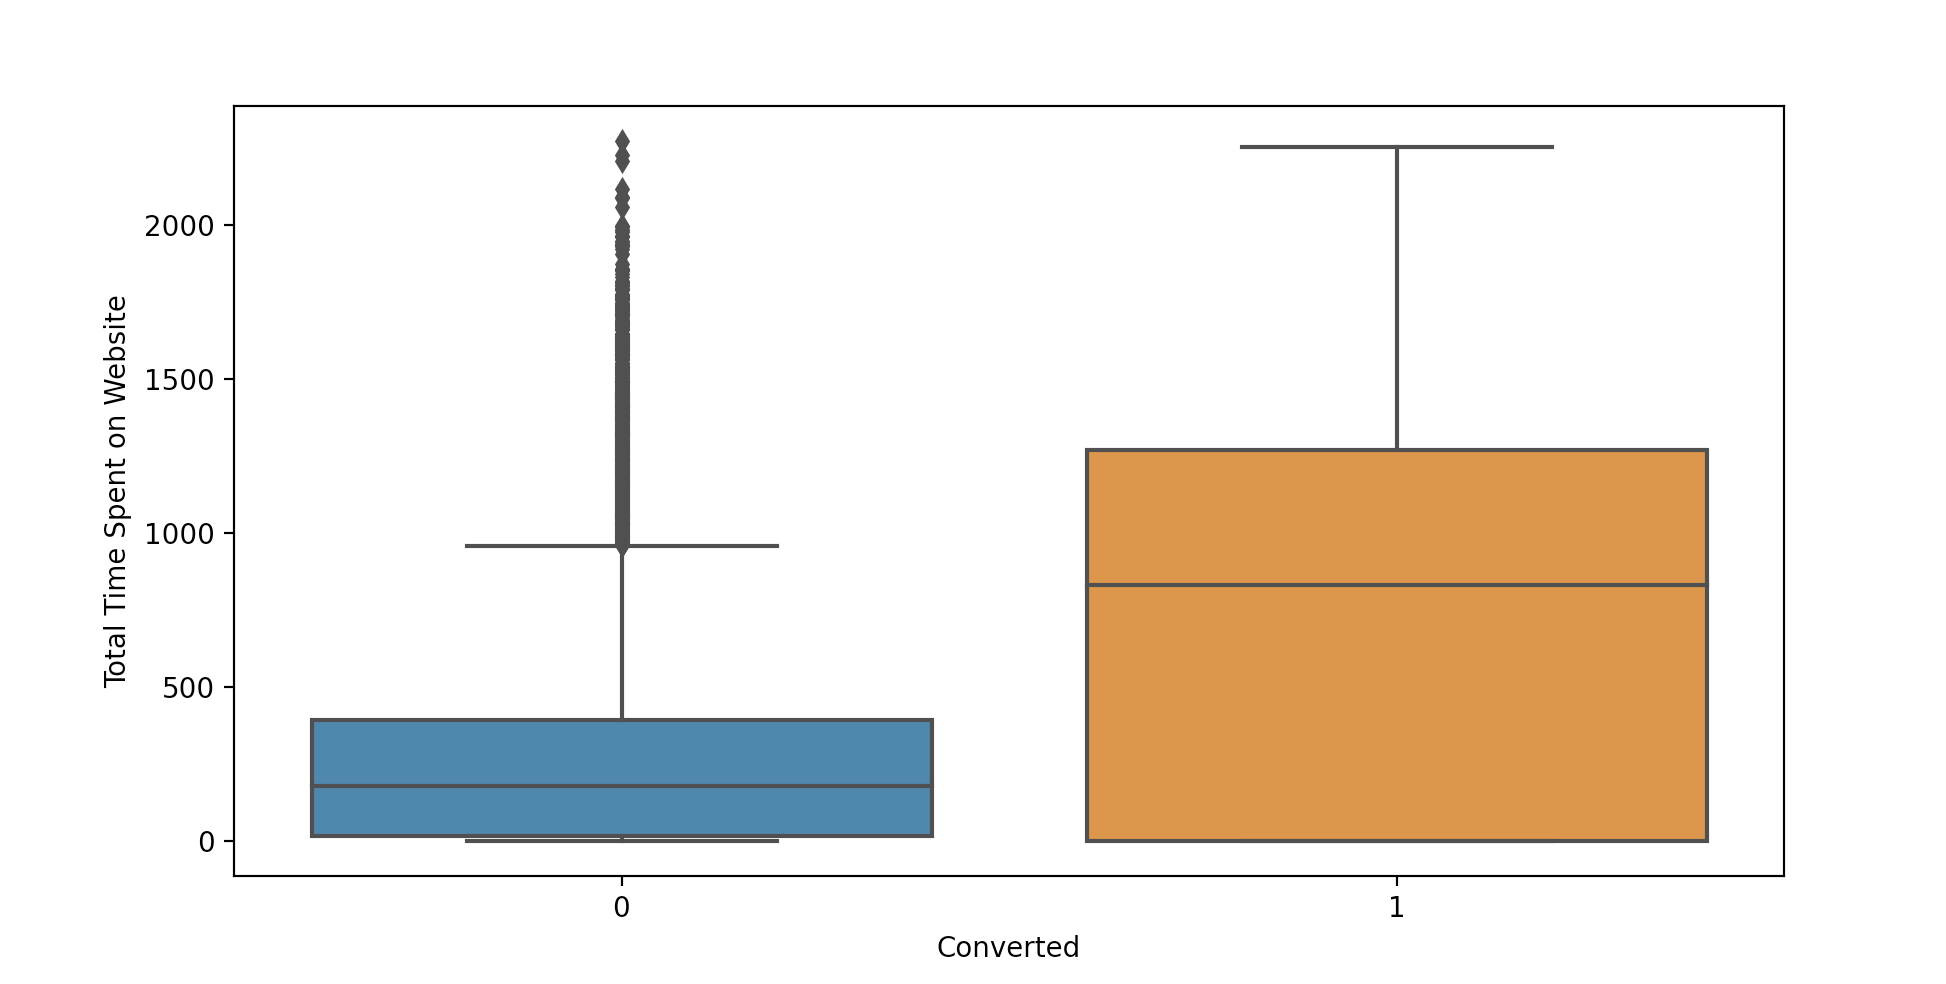
推理:
- 数据中没有异常值。
- 在网站上花费更多时间的潜在客户更有可能被转化。
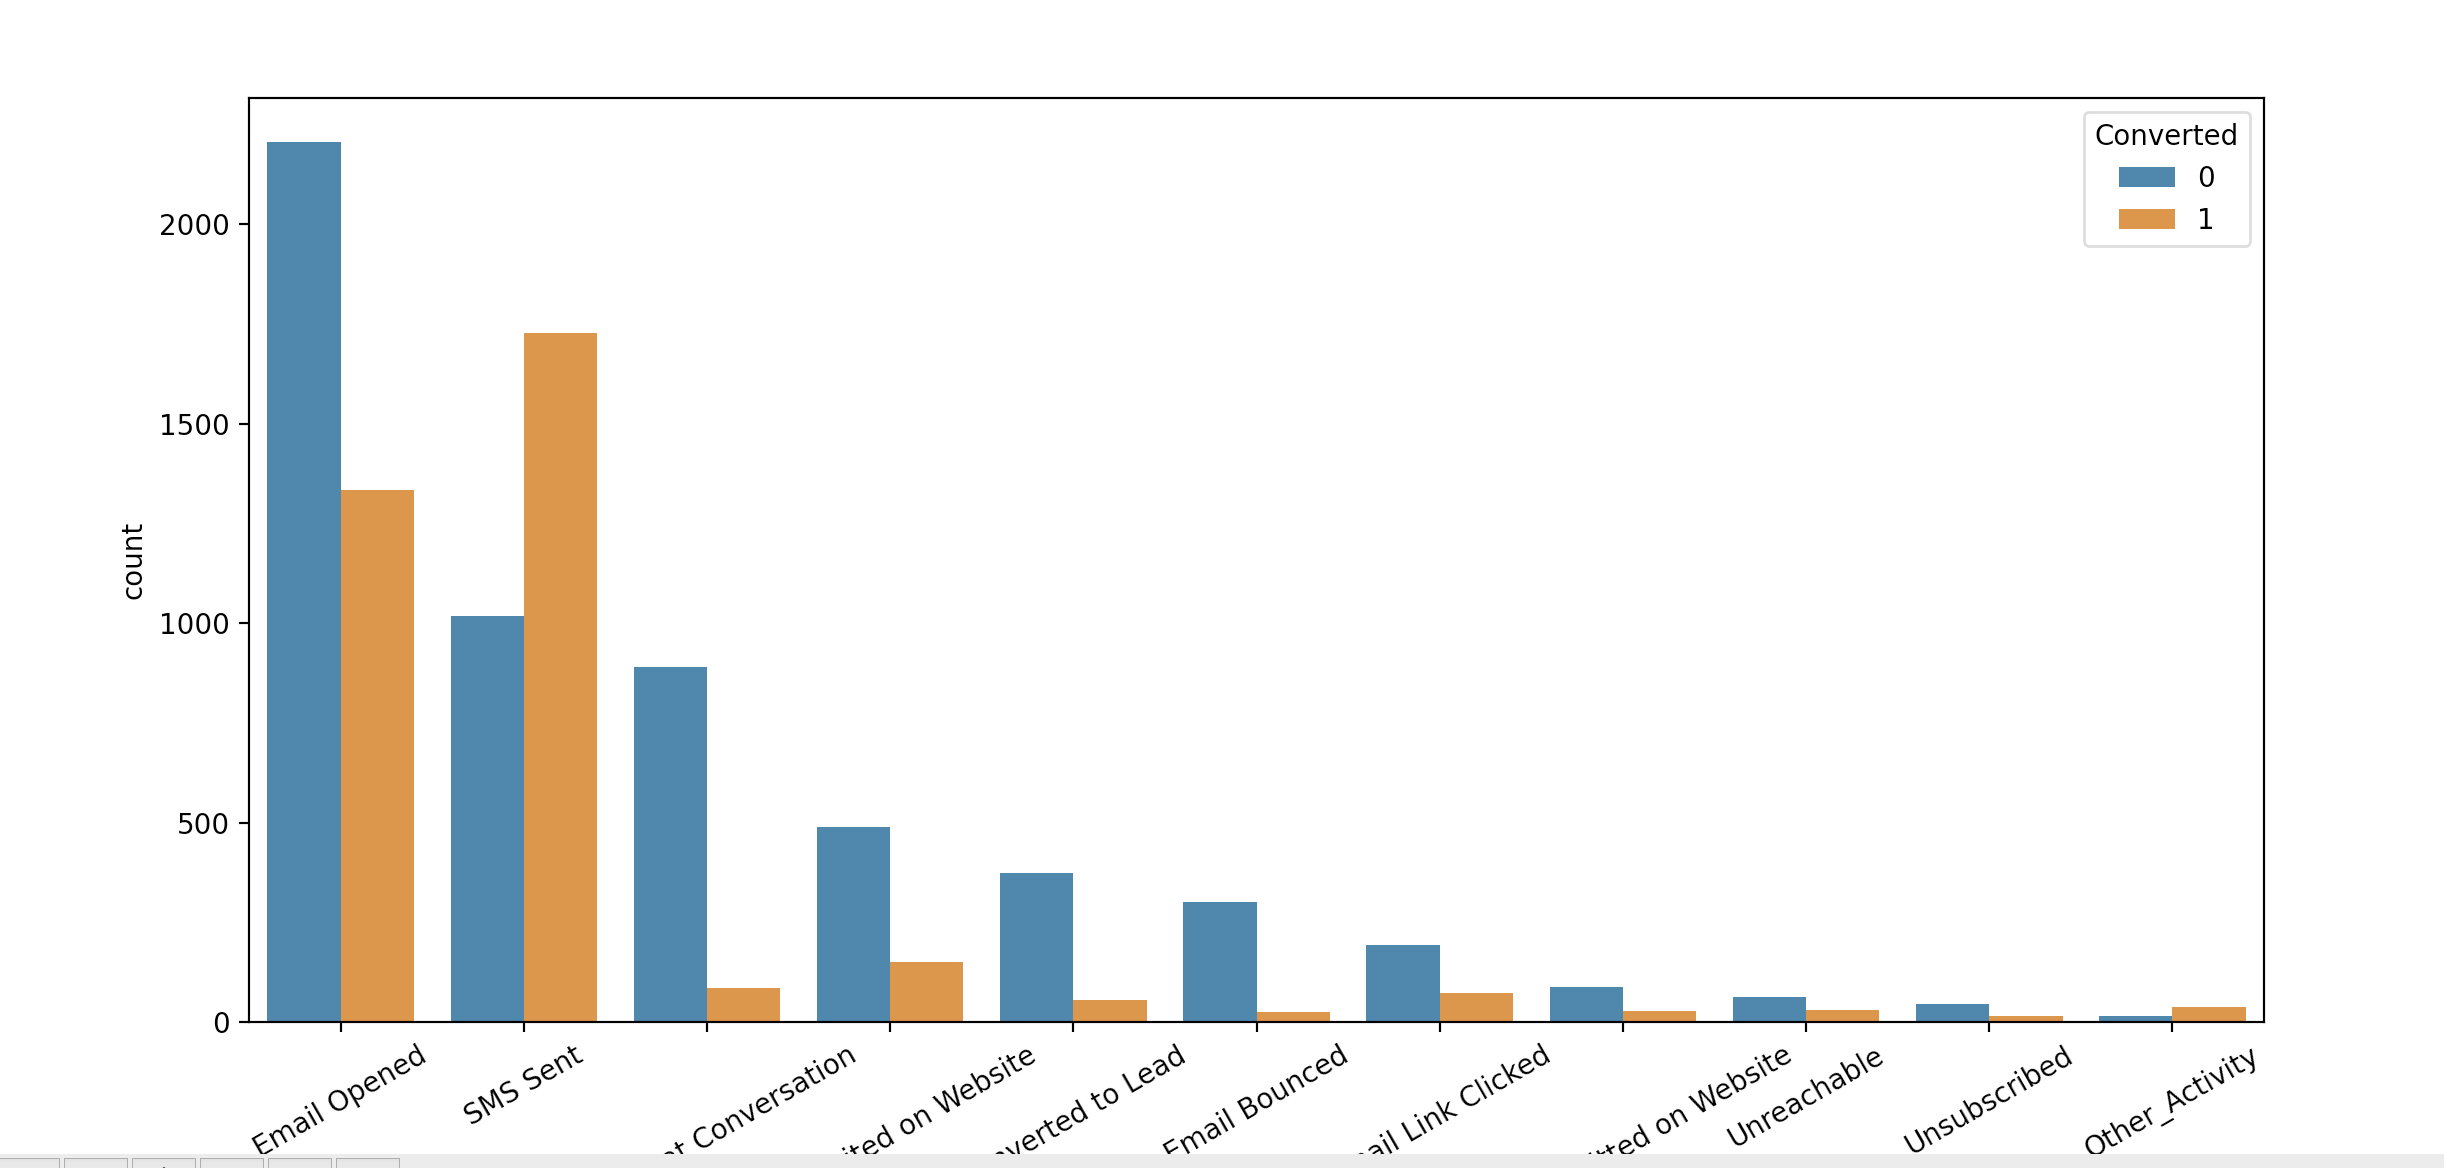
5.Last Activity
data['Last Activity'].value_counts()
Email Opened                    3540
SMS Sent                        2745
Olark Chat Conversation          973
Page Visited on Website          640
Converted to Lead                428
Email Bounced                    325
Email Link Clicked               267
Form Submitted on Website        116
Unreachable                       93
Unsubscribed                      61
Had a Phone Conversation          30
Approached upfront                 9
View in browser link Clicked       6
Email Marked Spam                  2
Email Received                     2
Visited Booth in Tradeshow         1
Resubscribed to emails             1
Name: Last Activity, dtype: int64
对于出现次数较少的 Last Activity ,我们使用 Other_Activity 进行替代。
data['Last Activity'] = data['Last Activity']
.replace(['Had a Phone Conversation',
          'View in browser link Clicked',
          'Visited Booth in Tradeshow',
          'Approached upfront',
          'Resubscribed to emails',
          'Email Received',
          'Email Marked Spam'], 'Other_Activity')
fig, axs = plt.subplots(figsize = (13,6))
sns.countplot(x = "Last Activity", hue = "Converted", data = data, order = data['Last Activity'].value_counts().index)
plt.xticks(rotation = 20)
plt.show()
计算 Last Activity 中每个值的转化率。
d = {}
for val in data['Last Activity'].unique():
    a = data[data['Last Activity'] == val]['Converted'].sum()
    b = data[data['Last Activity'] == val]['Converted'].count()
    d[val] = [a, b, round(a/b*100, 2)]
print(pd.DataFrame.from_dict(d, orient='index')
      .rename(columns = {0: 'Converted', 1: 'Leads',2: 'Conversion Ratio'})
      .sort_values(by=['Conversion Ratio'], ascending=False))
                           Converted  Leads  Conversion Ratio
Other_Activity                    37     51             72.55
SMS Sent                        1727   2745             62.91
Email Opened                    1334   3540             37.68
Unreachable                       31     93             33.33
Email Link Clicked                73    267             27.34
Unsubscribed                      16     61             26.23
Form Submitted on Website         28    116             24.14
Page Visited on Website          151    640             23.59
Converted to Lead                 54    428             12.62
Olark Chat Conversation           84    973              8.63
Email Bounced                     25    325              7.69
推理:
- “ Email Opened ” 和 “ SMS Sent ” 是最后产生最大潜在客户数量的活动,并且转化率也不错。
- “ SMS Sent ” 是表现最好的 Last Activity,转化率为 62.91%。
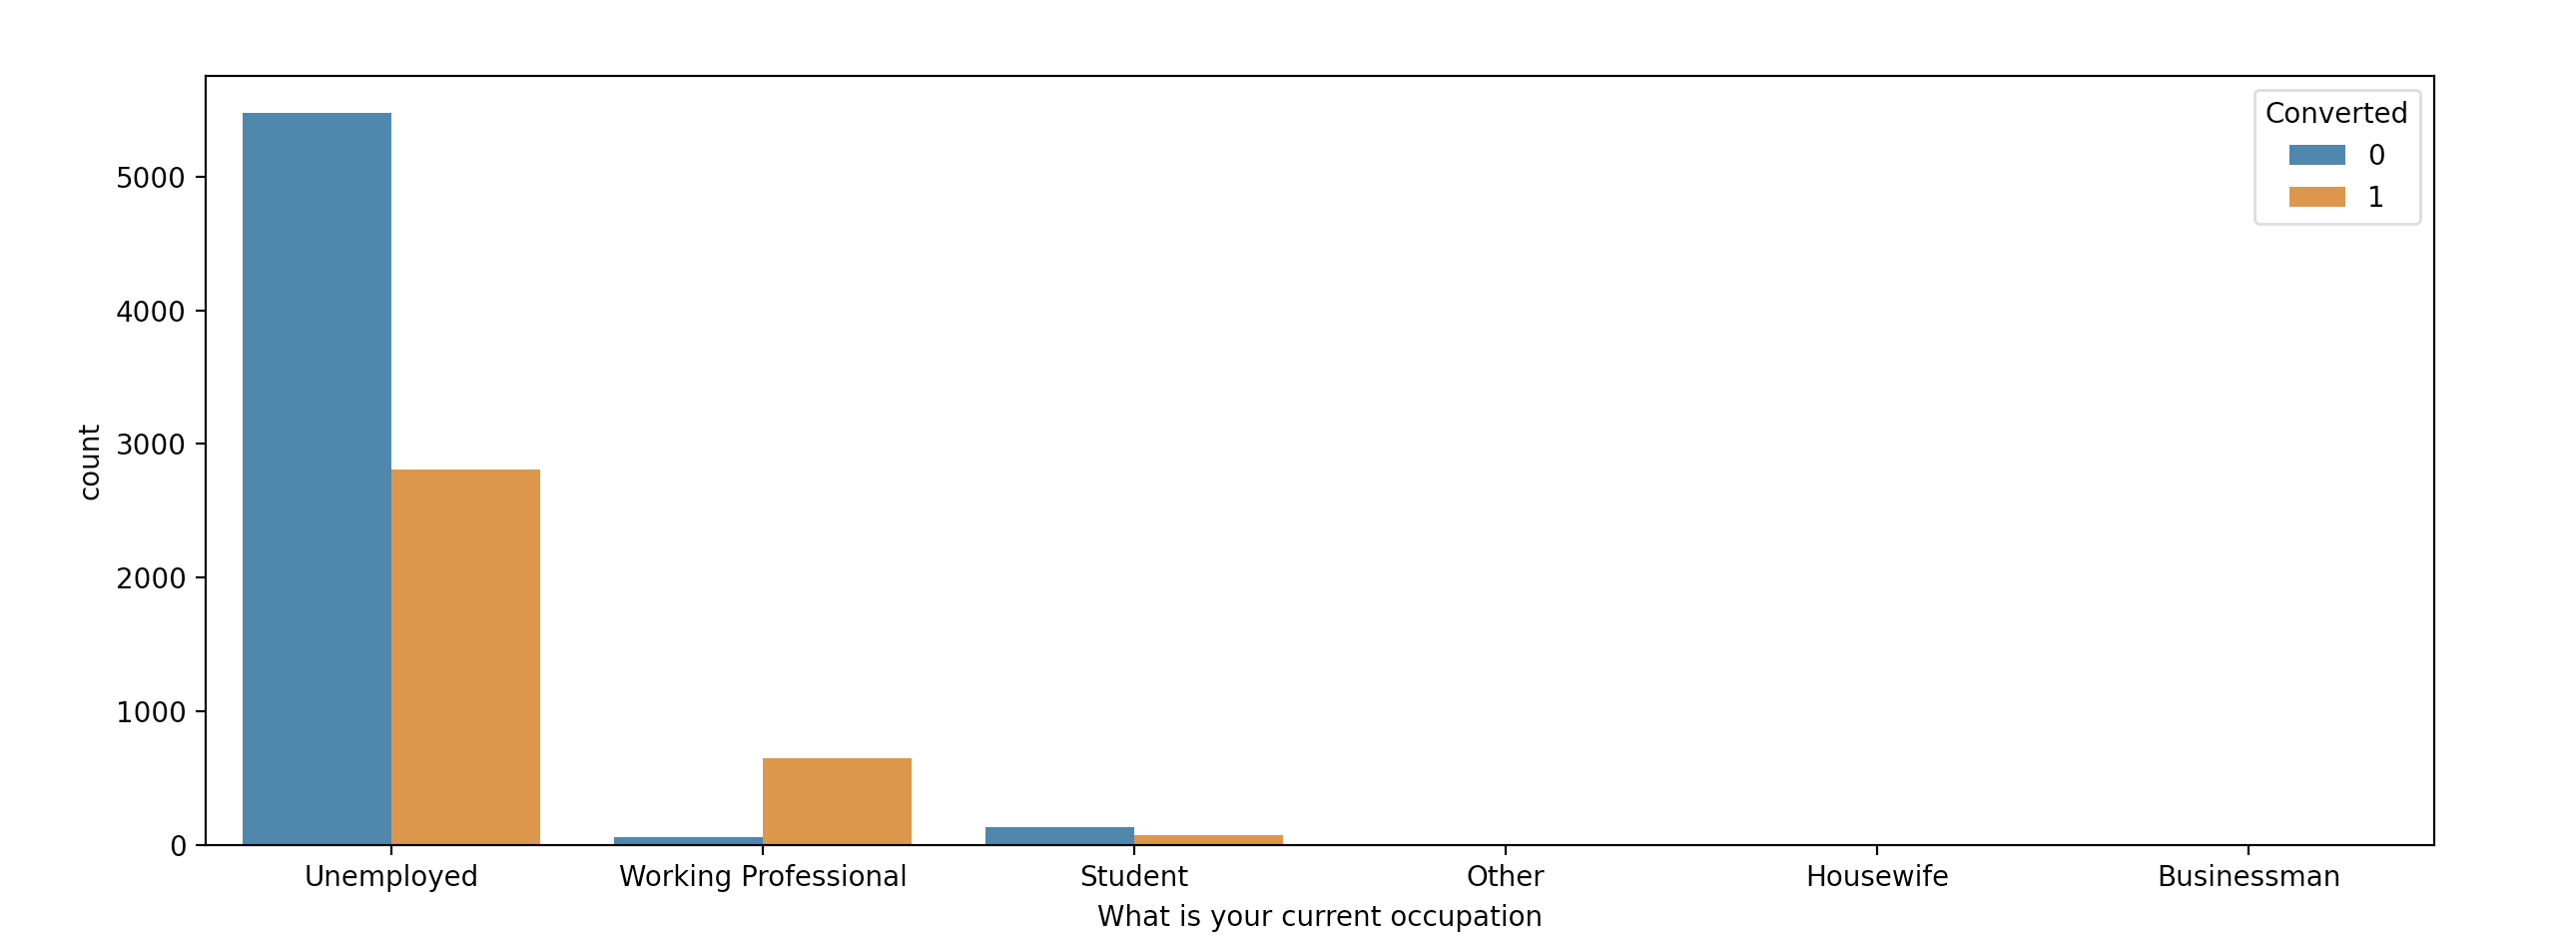
6. 你现在的职业是什么
data['What is your current occupation'].value_counts()
Unemployed              8289
Working Professional     706
Student                  210
Other                     16
Housewife                 10
Businessman                8
Name: What is your current occupation, dtype: int64
绘制目标变量的柱状图。
查看一下转化率。
d = {}
for val in data['What is your current occupation'].unique():
    a = data[data['What is your current occupation'] == val]['Converted'].sum()
    b = data[data['What is your current occupation']==val]['Converted'].count()
    d[val] = [a, b, round(a/b*100, 2)]
pd.DataFrame.from_dict(d, orient='index').rename(columns = {0: 'Converted', 1: 'Leads',2: 'Conversion Ratio'}).sort_values(by=['Conversion Ratio'], ascending=False)
                      Converted  Leads  Conversion Ratio
Housewife                    10     10            100.00
Working Professional        647    706             91.64
Businessman                   5      8             62.50
Other                        10     16             62.50
Student                      78    210             37.14
Unemployed                 2810   8289             33.90
推理:
- “Unemployed” 职业产生的潜在客户数量最多,但转化率最低。
- “Working Professional” 职业是表现最好的职业,转化率为 91.64%。
- “Housewife” 职业的转化率为 100%,但由于数据点较少,我们不考虑它。
结论
在本文中,我们通过案例研究了解了探索性数据分析 (EDA) 的含义以及为什么它在 ML 项目中必不可少。
我们研究了如何分析数据集并从中得出推论。
本文由mdnice多平台发布

 浙公网安备 33010602011771号