
期末大作业
一、boston房价预测
1. 读取数据集
#boston房价预测
#1.读取boston房价数据集
import pandas as pd
from sklearn.datasets import load_boston
boston = load_boston()
x=boston.data
y=boston.target
pd.DataFrame(x,y)
运行结果如下:

2. 训练集与测试集划分
#2.训练集与测试集划分
from sklearn.model_selection import train_test_split
x_train, x_test, y_train, y_test = train_test_split(x,y,test_size=0.3)#训练集是0.7,测试集是0.3
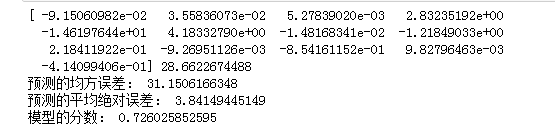
3. 线性回归模型:建立13个变量与房价之间的预测模型,并检测模型好坏。
#3.线性回归模型:建立13个变量与房价之间的预测模型,并检测模型好坏。
#多元线性回归模型
from sklearn.linear_model import LinearRegression
lineR=LinearRegression()
lineR.fit(x_train,y_train)
w=lineR.coef_
b=lineR.intercept_
print(w,b)
#检测模型好坏
from sklearn.metrics import regression
y_pred=lineR.predict(x_test)
print("预测的均方误差:", regression.mean_squared_error(y_test,y_pred))
print("预测的平均绝对误差:", regression.mean_absolute_error(y_test,y_pred))
# 输出模型的分数
print("模型的分数:",lineR.score(x_test, y_test))
运行结果如下:
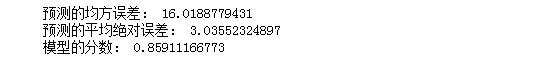
4. 多项式回归模型:建立13个变量与房价之间的预测模型,并检测模型好坏。
#4.多项式回归模型:建立13个变量与房价之间的预测模型,并检测模型好坏。
#多项式回归模型
from sklearn.preprocessing import PolynomialFeatures
poly=PolynomialFeatures(degree=2)
x_train_poly=poly.fit_transform(x_train)
x_test_poly=poly.transform(x_test)
lrp=LinearRegression()
lrp.fit(x_train_poly,y_train)

#检测模型好坏
y_pred_plot=lrp.predict(x_test_poly)
print("预测的均方误差:", regression.mean_squared_error(y_test,y_pred_plot))
print("预测的平均绝对误差:", regression.mean_absolute_error(y_test,y_pred_plot))
# 输出模型的分数
print("模型的分数:",lrp.score(x_test_poly, y_test))
运行结果如下:
5. 比较线性模型与非线性模型的性能,并说明原因。
同过比较线性模型与非线性模型运行结果,可以知道非线性模型更加贴合样本点的分布,而且比线性模型的误差小,所以非线性模型的性能比线性模型的性能更好。
二、中文文本分类
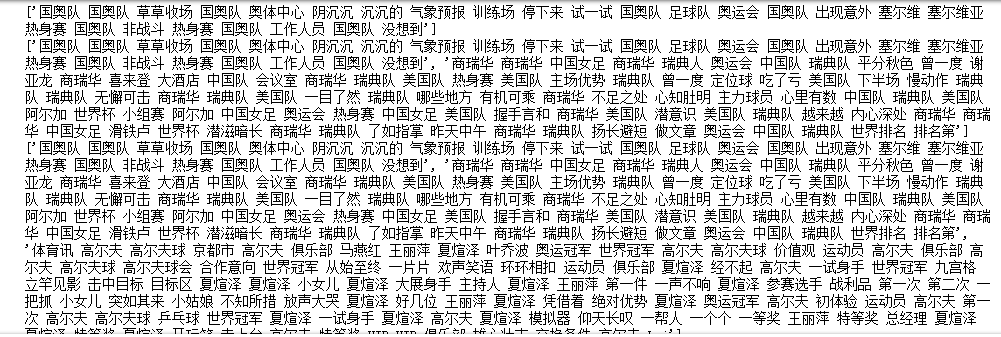
import os
import jieba
import numpy as np
import sys
from datetime import datetime
import gc
path = 'F:\\0369'

with open(r'F:\\stopsCN.txt',encoding='utf-8') as f:
    stopwords = f.read().split('\n')

def processing(text):

    text = "".join([char for char in text if char.isalpha()])

    text = [token for token in jieba.cut(text,cut_all=True) if len(token) >=3]

    text = " ".join([token for token in text if token not in stopwords])
    return text

data=[]
target=[]

for root,dirs,files in os.walk(path):
    for f in files:
        file = os.path.join(root,f)
        with open(file, encoding='utf-8') as f:
            datafile = f.read()
        targets = file.split('\\')[-2]
        target.append(targets)
        data.append(processing(datafile))
运行结果如下:
#2.训练集与测试集划分
from sklearn.model_selection import train_test_split
x_train,x_test,y_train,y_test=train_test_split(data,target,test_size=0.3)#训练集是0.7,测试集是0.3
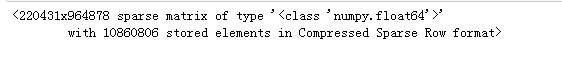
#TF-IDF
from sklearn.feature_extraction.text import TfidfVectorizer
vectorizer=TfidfVectorizer(min_df=2,ngram_range=(1,2),stop_words='english',strip_accents='unicode',norm='l2')#构建一个计算TF-IDF
X_train=vectorizer.fit_transform(x_train)#vectorizer.fit_transform(TFIDF_train)将文本TFIDF_train输入,得到词频矩阵
X_test=vectorizer.transform(x_test)#将这个矩阵作为输入,用transformer.fit_transform(词频矩阵)得到TF-IDF权重矩阵
X_train
运行结果如下:
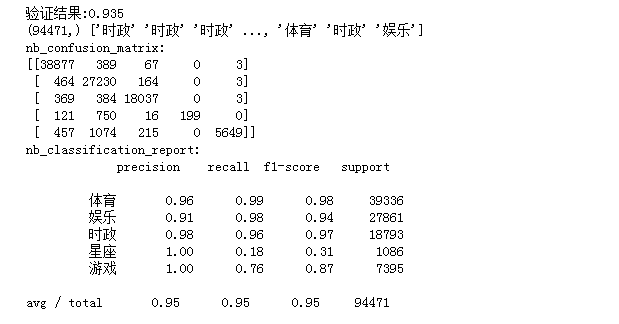
#将其向量化
#多项式朴素贝叶斯
from sklearn.naive_bayes import MultinomialNB
mul=MultinomialNB()
clf= mul.fit(X_train,y_train)
y_nb_pred=clf.predict(X_test)
#模型精确度
from sklearn.model_selection import cross_val_score
scores = cross_val_score(mul, X_test, y_test, cv=5)
print("验证结果:%.3f" % scores.mean())
#分类结果显示
from sklearn.metrics import confusion_matrix
from sklearn.metrics import classification_report
#x_test预测结果
print(y_nb_pred.shape,y_nb_pred)
print('nb_confusion_matrix:')
#混淆矩阵
cm=confusion_matrix(y_test,y_nb_pred)
print(cm)
print('nb_classification_report:')
cr=classification_report(y_test,y_nb_pred)#主要分类指标的文本报告
print(cr)
运行结果如下:

 浙公网安备 33010602011771号