tracing
tracing
什么是 Tracing

Wikipedia 中,对 Tracing 的定义 是,在软件工程中,Tracing 指使用特定的日志记录程序的执行信息,与之相近的还有两个概念,它们分别是 Logging 和 Metrics。
- Logging:用于记录离散的事件,包含程序执行到某一点或某一阶段的详细信息。
- Metrics:可聚合的数据,且通常是固定类型的时序数据,包括 Counter、Gauge、Histogram 等。
- Tracing:记录单个请求的处理流程,其中包括服务调用和处理时长等信息。
同时这三种定义相交的情况也比较常见。
- Logging & Metrics:可聚合的事件。例如分析某对象存储的 Nginx 日志,统计某段时间内 GET、PUT、DELETE、OPTIONS 操作的总数。
- Metrics & Tracing:单个请求中的可计量数据。例如 SQL 执行总时长、gRPC 调用总次数。
- Tracing & Logging:请求阶段的标签数据。例如在 Tracing 的信息中标记详细的错误原因。
针对每种分析需求,我们都有非常强大的集中式分析工具。
- Logging:ELK,近几年势头最猛的日志分析服务,无须多言。
- Metrics:Prometheus,第二个加入 CNCF 的开源项目,非常好用。
- Tracing:OpenTracing 和 Jaeger,Jaeger 是 Uber 开源的一个兼容 OpenTracing 标准的分布式追踪服务。目前 Jaeger 也加入了 CNCF。
Tracing background
OpenTracing is an open standard for distributed tracing. Distributed tracing, also called distributed request tracing, is a method used to profile and monitor applications, especially those built using a microservices architecture. Distributed tracing helps pinpoint where failures occur and what causes poor performance.
There are some famous implementations supporting OpenTracing. Some implementations have not only the tracing implementation, but GUIs to analyse tracing data
We study it mainly because
- Current vision event trace has logged lots of data, but the data is difficult to analyse
- The data has no hierarchy between each other
- As the data's limitation, there is no tools to visualzie the event hierarchy
- We need to compare two tracing (eg 2 PR Commands). The comparison should consider event hierachy
- We want to trace events of distributed vision system
OpenTracing seems have some solutions. We want to study whether can learn from its design or even adopt it to our system
- Dapper: google’s distributed tracing system https://research.google.com/pubs/pub36356.html
- Opentracing standard: https://opentracing.io/
- OpenZipKin: implementations by Twitter: http://zipkin.io/
- Jaeger: implementations by Uber https://www.jaegertracing.io/
- Canopy: facebook https://research.fb.com/publications/canopy-end-to-end-performance-tracing-at-scale/
- Videos: https://www.shkuro.com/talks/2019-06-06-distributed-tracing-at-uber-and-facebook/
- https://cdn.oreillystatic.com/en/assets/1/event/275/Tracing polyglot systems_ An OpenTracing tutorial Presentation.pdf
- Study visualizer: Single trace, trace comparison , etc [https://schd.ws/hosted_files/opsummitna18/03/KubeCon Observability Summit SEA 12-10-2018 - Jaeger.pdf](https://schd.ws/hosted_files/opsummitna18/03/KubeCon Observability Summit SEA 12-10-2018 - Jaeger.pdf)
Pros:
- Support distributed system. Vision will have distributed processing system soon
- Minimize our development Effort: It has some implementaitons & viewers
Cons:
- event trace is designed as minimal overhead, no memory allcoation
- efforts in changing API
Dapper
早在 2005 年,Google 就在内部部署了一套分布式追踪系统 Dapper,并发表了一篇论文《Dapper, a Large-Scale Distributed Systems Tracing Infrastructure》,阐述了该分布式追踪系统的设计和实现,可以视为分布式追踪领域的鼻祖。随后出现了受此启发的开源实现,如 Zipkin、SourceGraph 开源的 Appdash、Red Hat 的 Hawkular APM(Application Performance Management)、Uber 开源的 Jaeger 等。但各家的分布式追踪方案是互不兼容的,这才诞生了 OpenTracing。OpenTracing 是一个 Library,定义了一套通用的数据上报接口,要求各个分布式追踪系统都来实现这套接口。这样一来,应用程序只需要对接 OpenTracing,而无需关心后端采用的到底什么分布式追踪系统,因此开发者可以无缝切换分布式追踪系统,也使得在通用代码库增加对分布式追踪的支持成为可能。
Opentracing
OpenTracing 于 2016 年 10 月加入 CNCF 基金会
它是一个中立的(厂商无关、平台无关)分布式追踪的 API 规范,提供统一接口,可方便开发者在自己的服务中集成一种或多种分布式追踪的实现
主流的分布式追踪实现基本都已经支持 OpenTracing,包括 Jaeger、Zipkin、Appdash 等,具体可参考官方文档 《Supported Tracer Implementations》。
数据模型
这部分在 OpenTracing 的规范中写的非常清楚,下面只大概翻译一下其中的关键部分,细节可参考原始文档 《The OpenTracing Semantic Specification》。
Causal relationships between Spans in a single Trace

        [Span A]  ←←←(the root span)
            |
     +------+------+
     |             |
 [Span B]      [Span C] ←←←(Span C is a `ChildOf` Span A)
     |             |
 [Span D]      +---+-------+
               |           |
           [Span E]    [Span F] >>> [Span G] >>> [Span H]
                                       ↑
                                       ↑
                                       ↑
                         (Span G `FollowsFrom` Span F)
Trace 是调用链,每个调用链由多个 Span 组成。Span 的单词含义是范围,可以理解为某个处理阶段。Span 和 Span 的关系称为 Reference。上图中,总共有标号为 A-H 的 8 个阶段。
Temporal relationships between Spans in a single Trace

––|–––––––|–––––––|–––––––|–––––––|–––––––|–––––––|–––––––|–> time

 [Span A···················································]
   [Span B··············································]
      [Span D··········································]
    [Span C········································]
         [Span E·······]        [Span F··] [Span G··] [Span H··]
上图是按照时间顺序呈现的调用链。
每个阶段(Span)包含如下状态:
- 操作名称
- 起始时间
- 结束时间
- 一组 KV 值,作为阶段的标签(Span Tags)
- 阶段日志(Span Logs)
- 阶段上下文(SpanContext),其中包含 Trace ID 和 Span ID
- 引用关系(References)
阶段(Span)可以有 ChildOf 和 FollowsFrom 两种引用关系。ChildOf 用于表示父子关系,即在某个阶段中发生了另一个阶段,是最常见的阶段关系,典型的场景如调用 RPC 接口、执行 SQL、写数据。FollowsFrom 表示跟随关系,意为在某个阶段之后发生了另一个阶段,用来描述顺序执行关系。
如果对原理比较感兴趣,建议读一下 OpenTracing 的规范文档和 Go 语言的实现。
ELK
Prometheus
Zipkin
Twitter公司开源的一个分布式追踪工具,被Spring Cloud Sleuth集成,使用广泛而稳定
![[外链图片转存失败(20190716212457854.png)(https://gentlezuo.github.io/2019/07/13/APM工具对比/architecture-skywalking.png)]]( https://img-blog.csdnimg.cn/20190716212457854.png?x-oss-process=image/watermark ,type_ZmFuZ3poZW5naGVpdGk,shadow_10,text_aHR0cHM6Ly9ibG9nLmNzZG4ubmV0L2dlbnRsZXp1bw==,size_16,color_FFFFFF,t_70)
zipkin分为zipkin服务端和客户端,每一个被监控的服务都是客户端。
组件:
- 追踪器:位于客户端,并记录有关发生的操作的时间和元数据,对用户透明
- Reporter: 将数据发送到Zipkin的检测应用程序
- Transport :传输数据:HTTP, Kafka and Scribe.
- Collector:位于服务端中,收集传输来的数据
- Storage :存储数据,默认存储在内存中
- search :查询api,JSON应用编程接口,被UI调用
- UI :Web UI提供了一种基于服务,时间Annotation查看跟踪的方法。UI中没有内置身份验证
skywalking
中国人吴晟(华为)开源的一款分布式追踪,分析,告警的工具,现在是Apache旗下开源项目
https://github.com/apache/skywalking
cat
:大众点评开源的一款分布式链路追踪工具。
Appdash
Jaeger (Uber )

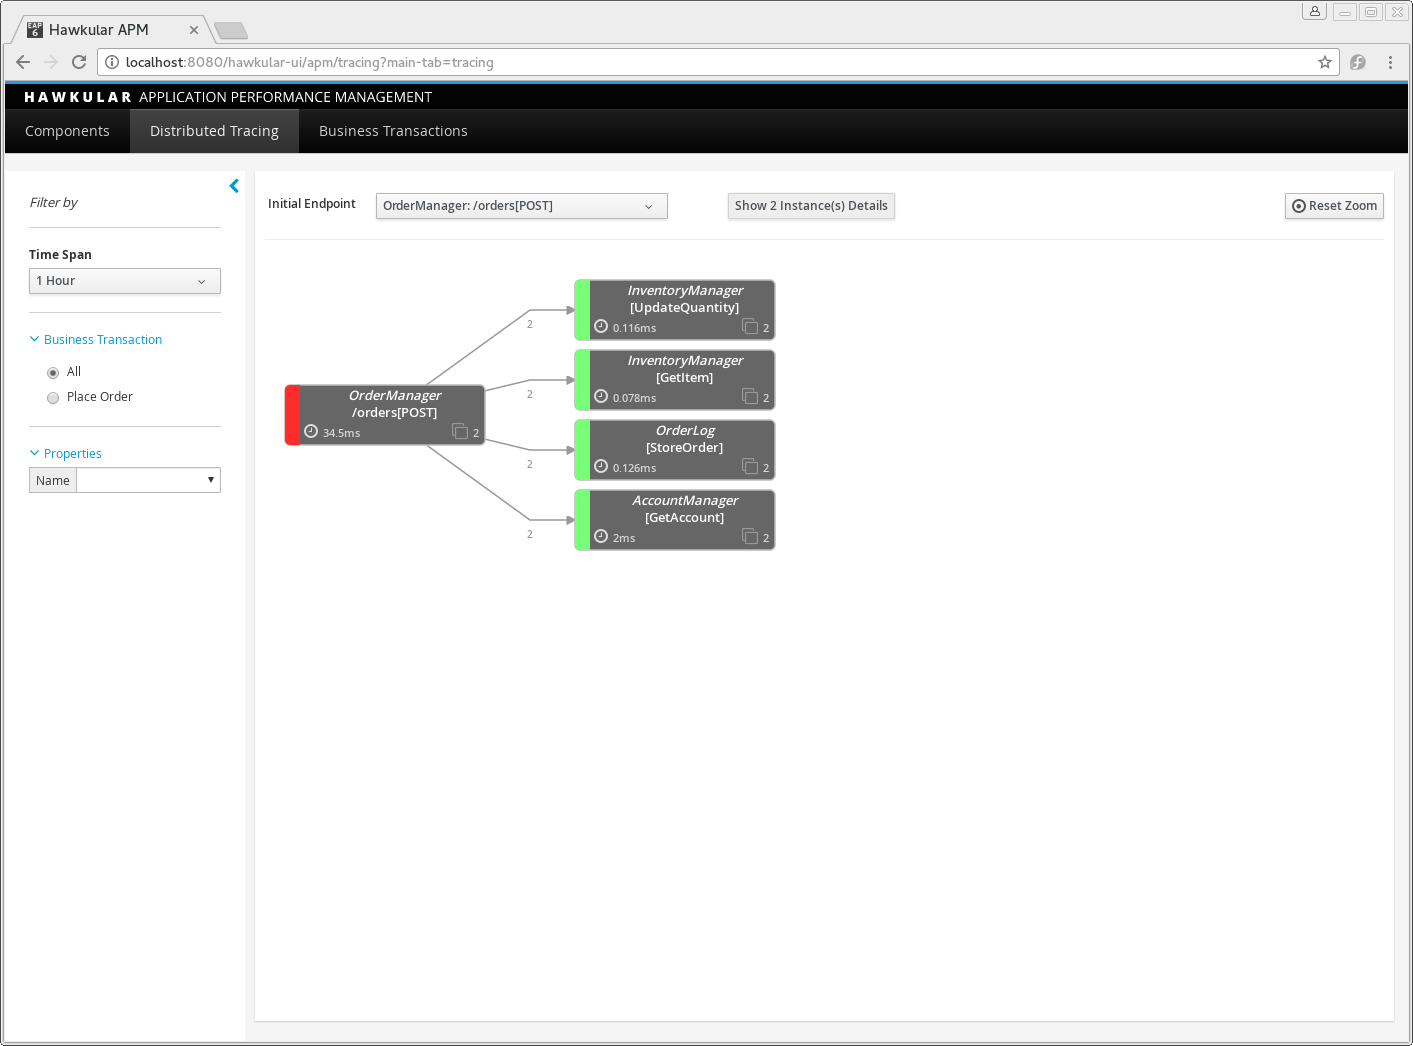
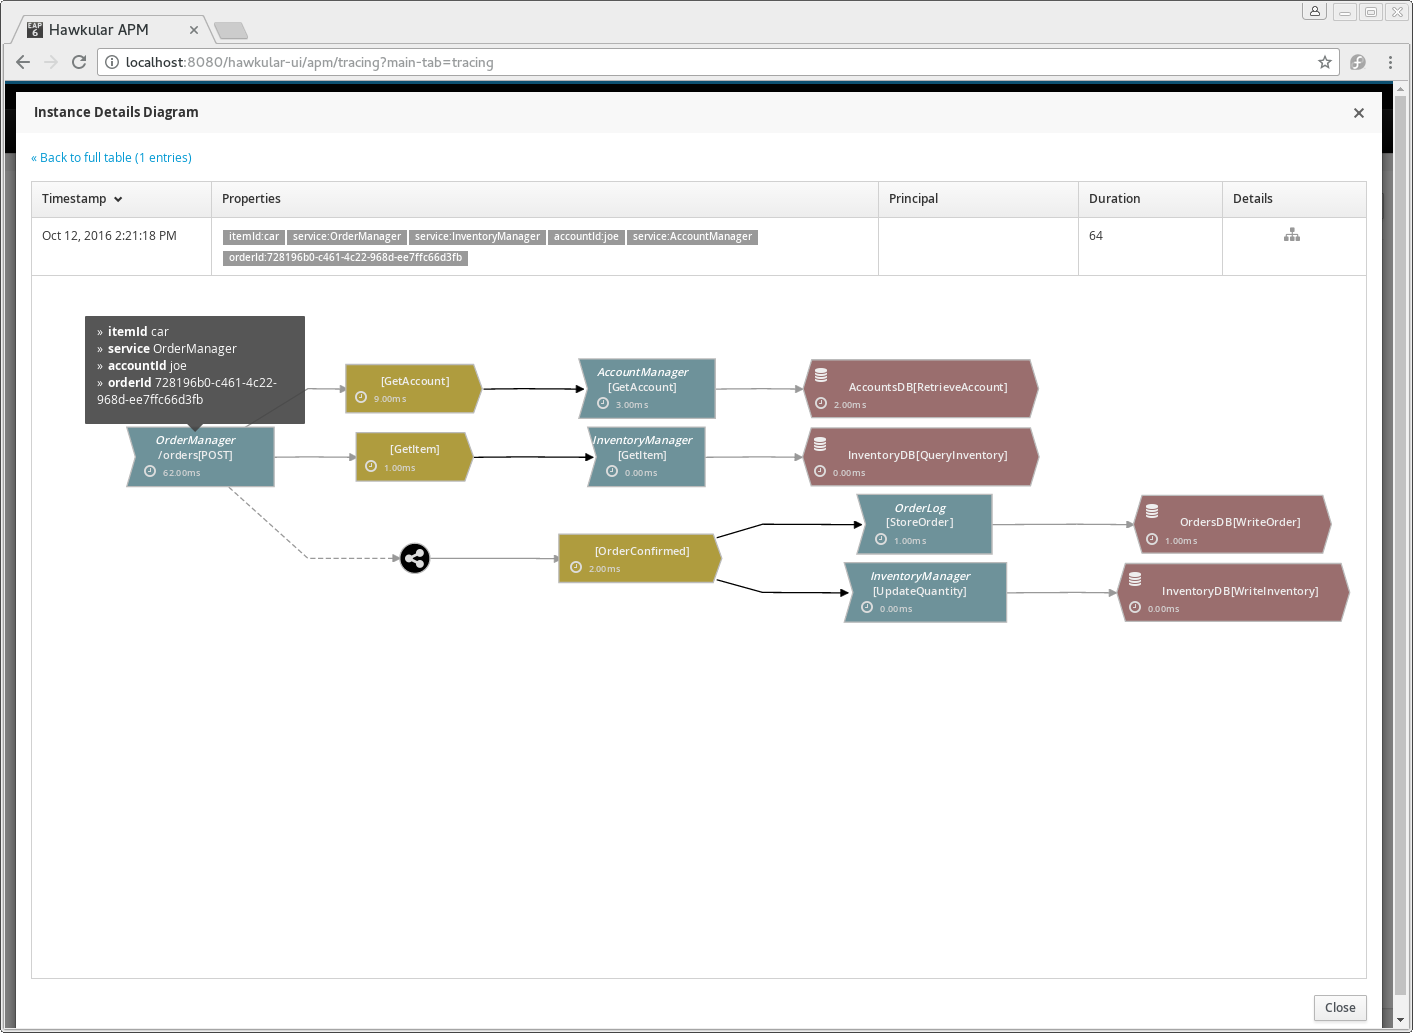
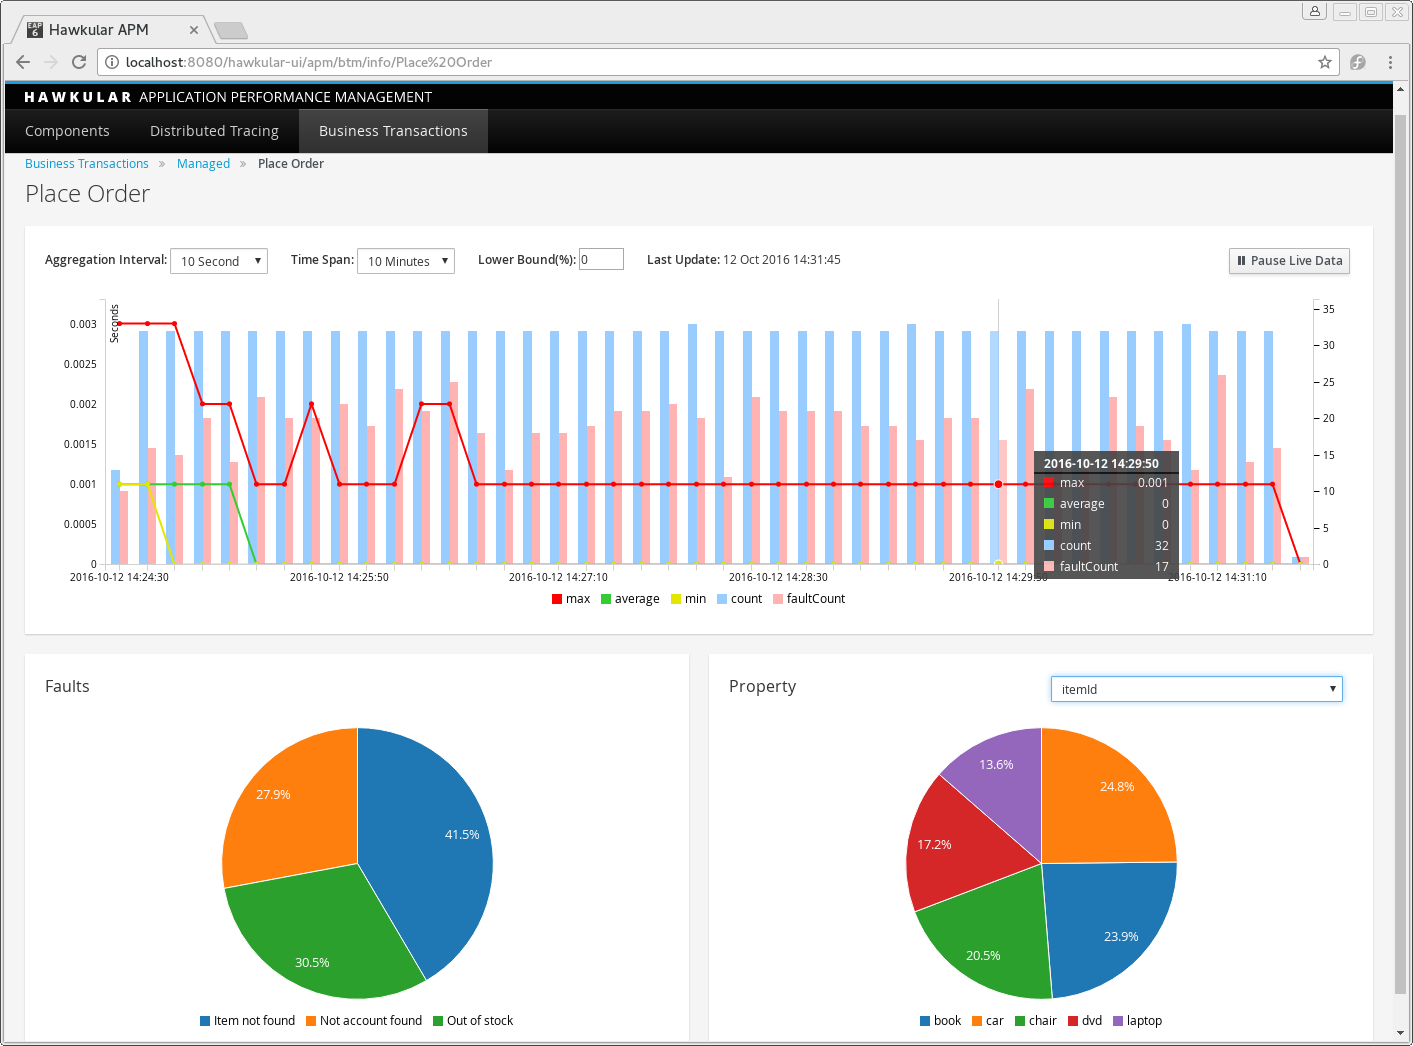
从 Jaeger 的前端界面上可以清晰的看到某个请求的所有阶段和内部调用,以及每个阶段所耗费的时间。展开某个阶段,还能看到这个阶段是在哪台机器(或容器)上执行的,也可以针对请求阶段增加的自定义标记,例如标记错误原因
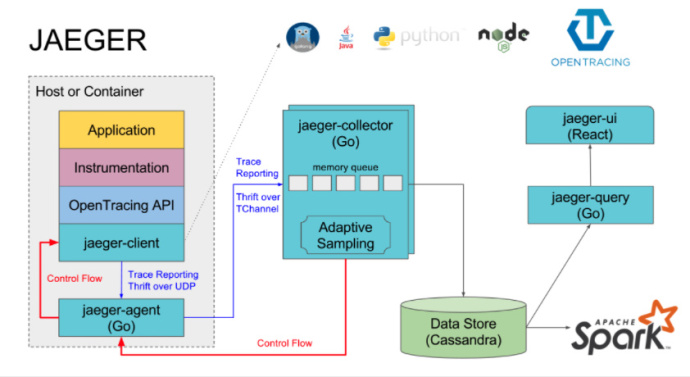
Uber Jaeger 是 Uber 工程团队开源的分布式追踪系统。自 2016年 起,Jaeger 在 Uber 内部实现大范围应用。Uber 同时开发了一种适用于 RPC 的网络多路复用和框架协议 —— TChannel | Support: Node.js,Python,Go,Java,该协议融入了分布式追踪能力。
TChannel 协议规范在二进制格式中直接定义了追踪字段:“ spanid:8 parentid:8 traceid:8 traceflags:1 ”。
- jaeger-client:支持多种语言的客户端库,如Go, Java, Python等语言
- jaeger-agent:客户端代理负责将追踪数据转发到服务端,这样能方便应用的快速处理,同时减轻服务端的直接压力;另外可以在客户端代理动态调整采样的频率,进行追踪数据采样的控制
- jaeger-collector:数据收集器主要进行数据收集和处理,从客户端代理收集数据进行处理后持久化到数据存储中
- 数据存储:目前支持将收集到的数据持久化到 Cassandra 、 Elasticsearch
- jaeger-query:主要根据不同的条件到数据存储中进行搜索,支撑前端页面的展示
- jaeger-ui:一个基于 React 的前端 webui
- jaeger spark: 是一个基于 Spark 聚合数据管道,用以完成服务依赖分析
原理
分布式追踪系统大体分为三个部分,数据采集、数据持久化、数据展示。
数据采集是指在代码中埋点,设置请求中要上报的阶段,以及设置当前记录的阶段隶属于哪个上级阶段。
数据持久化则是指将上报的数据落盘存储,例如 Jaeger 就支持多种存储后端,可选用 Cassandra 或者 Elasticsearch。
数据展示则是前端根据 Trace ID 查询与之关联的请求阶段,并在界面上呈现。
Q: 做的异步处理,如何表达?比如一个request提前返回,但是后台还在做别的处理
Service Mash
除了通过修改应用程序代码增加分布式追踪之外,还有一种不需要修改代码的非入侵的方式,那就是 Service Mesh。
Service Mesh 一般会被翻译成服务啮合层,它是在网络层面做文章,通过 Sidecar 的方式为 Pod 增加一层代理,通过这层网络代理来实现一些服务治理的功能,因为是工作在网络层面,可以做到跨语言、非入侵。
Istio 则是目前最成熟的 Service Mash 工具,支持启用分布式追踪服务。
Istio 会修改微服务之间发送的网络请求,在请求中注入 Trace 和 Span 标记,再将采集到的数据发送到支持 OpenTracing 的分布式追踪服务中,从而拿到请求在微服务中的调用链。当然这种方式也有缺点,它无法追踪某个微服务内部的调用过程,并且目前阶段 Istio 只能追踪 HTTP 请求,能够覆盖的范围比较有限。如果想追踪更详细的数据,还是需要在中间件和代码中埋点,不过好在埋点的过程并不复杂,不会成为一个额外的负担。
chrome tracing
https://aras-p.info/blog/2017/01/23/Chrome-Tracing-as-Profiler-Frontend/
如何跟踪异步事件
基于跨度的跟踪表示形式缺少对范围及其关系的含义的精确定义,并且表示形式与同步RPC编程模型紧密耦合
基于事件的跟踪模型起源于Leslie Lamport关于分布式计算机系统中事件排序的著作之一。我也承认,这里提出的大多数想法都是Facebook在2017 年的一份研究论文中发表的。(对于那些喜欢看书的人,我推荐这张聚会录像,Facebook工程师Edison Gao和Michael Bevilacqua-Linn做了简短的介绍。到天篷。)
links
- opentracing/open-for-event-based-tracing
- OpenTracing 详解https://pjw.io/articles/2018/05/08/opentracing-explanations/
- Datadog + OpenTracing: Embracing the open standard for APM https://www.datadoghq.com/blog/opentracing-datadog-cncf/
- Metrics, tracing, and logging https://peter.bourgon.org/blog/2017/02/21/metrics-tracing-and-logging.html
- Wikipedia - Tracing (software) https://www.wikiwand.com/en/Tracing_(software)
- Elastic https://www.elastic.co
- Prometheus https://prometheus.io
- OpenTracing http://opentracing.io
- Jaeger https://www.jaegertracing.io
- OpenTracing Joins the Cloud Native Computing Foundation https://www.cncf.io/blog/2016/10/11/opentracing-joins-the-cloud-native-computing-foundation/
- Introduction OpenTracing http://opentracing.io/documentation/
- Dapper, a Large-Scale Distributed Systems Tracing Infrastructure https://ai.google/research/pubs/pub36356
- OpenTracing: Turning the Lights On for Microservices https://www.cncf.io/blog/2016/10/20/opentracing-turning-the-lights-on-for-microservices/
- Supported Tracer Implementations http://opentracing.io/documentation/pages/supported-tracers.html#supported-tracer-implementations
- The OpenTracing Semantic Specification https://github.com/opentracing/specification/blob/master/specification.md
- Istio https://istio.io
- https://riboseyim.github.io/2018/05/18/DevOps-OpenTracing/
- https://zhuanlan.zhihu.com/p/34318538
-
[December 10, 2018] System Comprehension and Root Cause Analysis With Distributed Tracing
Observability Practitioners Summit @ KubeCon 2018
[video] [[slides](https://schd.ws/hosted_files/opsummitna18/03/KubeCon Observability Summit SEA 12-10-2018 - Jaeger.pdf)]
-
[October 1, 2018] Tracing Polyglot Systems: an OpenTracing Tutorial
Velocity NYC
[[slides](https://cdn.oreillystatic.com/en/assets/1/event/275/Tracing polyglot systems_ An OpenTracing tutorial Presentation.pdf)]
-
[December 6, 2017] Would You Like Some Tracing With Your Monitoring
KubeCon/CloudNativeCon NA 2017
-
[May 24, 2017] Tracing at Uber Scale: Creating a Treasure Map for your Monitoring Data
Monitorama PDX 2017
-
Prometheus
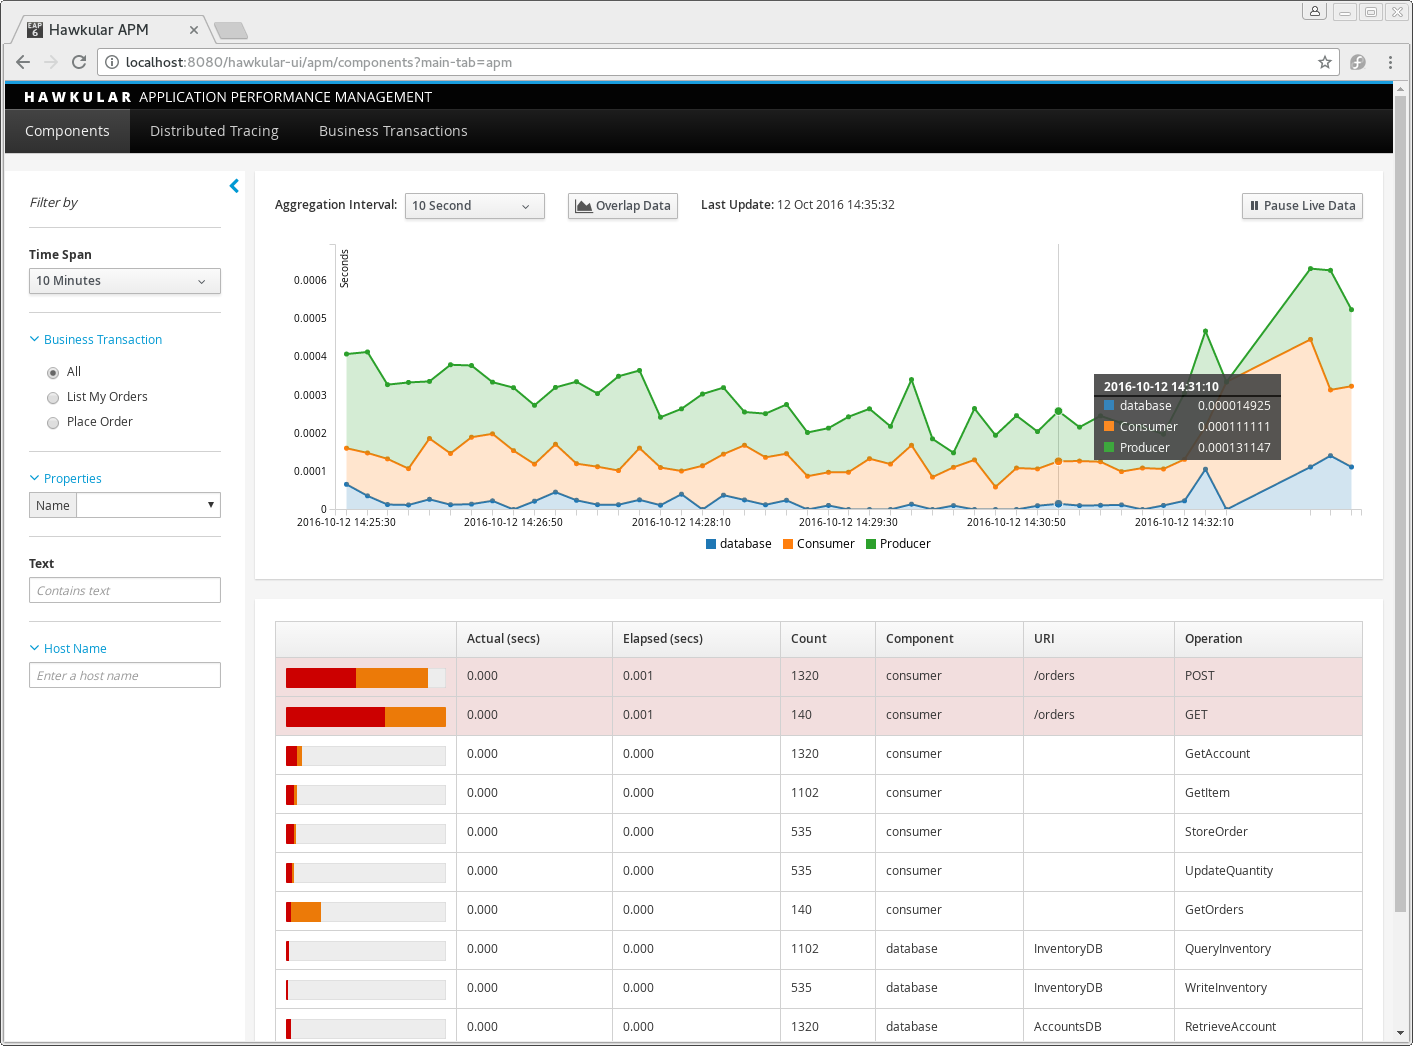
https://www.hawkular.org/hawkular-apm/
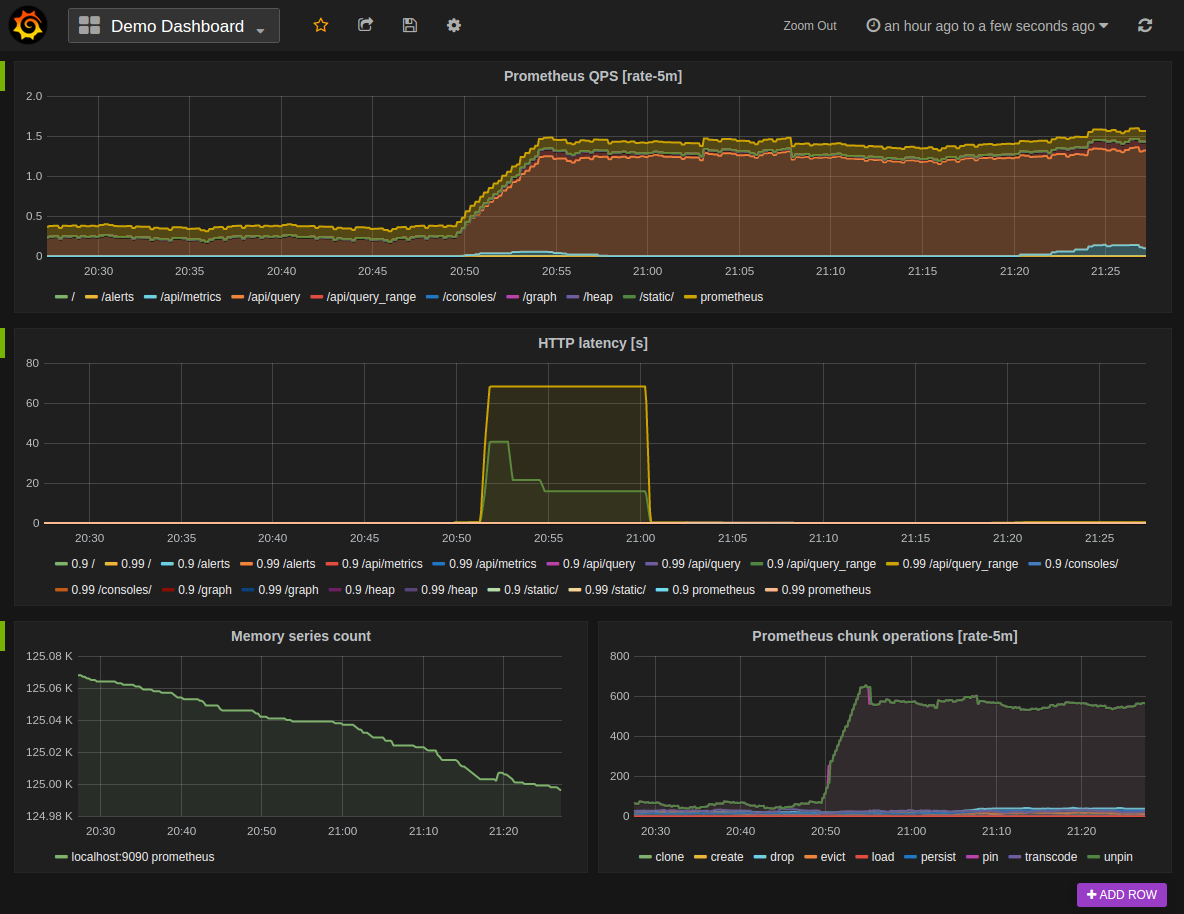
grafana
https://prometheus.io/docs/visualization/grafana/


https://wiredelf.com/wp-content/uploads/2018/10/Selection_074-1080x738.png

[prometheus]( https://www.google.com/search?q=Grafana&tbm=isch&chips=q:grafana ,online_chips:prometheus&bih=644&biw=1364&rlz=1C1GCEU_zh-CNHK824HK828&hl=zh-TW&sa=X&ved=2ahUKEwjcqPidsu3qAhVDyZQKHWFECmUQ4lYoAHoECAEQFA)[gitlab]( https://www.google.com/search?q=Grafana&tbm=isch&chips=q:grafana ,online_chips:gitlab&bih=644&biw=1364&rlz=1C1GCEU_zh-CNHK824HK828&hl=zh-TW&sa=X&ved=2ahUKEwjcqPidsu3qAhVDyZQKHWFECmUQ4lYoAXoECAEQFQ)[influxdb]( https://www.google.com/search?q=Grafana&tbm=isch&chips=q:grafana ,online_chips:influxdb&bih=644&biw=1364&rlz=1C1GCEU_zh-CNHK824HK828&hl=zh-TW&sa=X&ved=2ahUKEwjcqPidsu3qAhVDyZQKHWFECmUQ4lYoAnoECAEQFg)[monitoring]( https://www.google.com/search?q=Grafana&tbm=isch&chips=q:grafana ,online_chips:monitoring&bih=644&biw=1364&rlz=1C1GCEU_zh-CNHK824HK828&hl=zh-TW&sa=X&ved=2ahUKEwjcqPidsu3qAhVDyZQKHWFECmUQ4lYoA3oECAEQFw)[graph]( https://www.google.com/search?q=Grafana&tbm=isch&chips=q:grafana ,online_chips:graph&bih=644&biw=1364&rlz=1C1GCEU_zh-CNHK824HK828&hl=zh-TW&sa=X&ved=2ahUKEwjcqPidsu3qAhVDyZQKHWFECmUQ4lYoBHoECAEQGA)[azure]( https://www.google.com/search?q=Grafana&tbm=isch&chips=q:grafana ,online_chips:azure&bih=644&biw=1364&rlz=1C1GCEU_zh-CNHK824HK828&hl=zh-TW&sa=X&ved=2ahUKEwjcqPidsu3qAhVDyZQKHWFECmUQ4lYoBXoECAEQGQ)[zimbra]( https://www.google.com/search?q=Grafana&tbm=isch&chips=q:grafana ,online_chips:zimbra&bih=644&biw=1364&rlz=1C1GCEU_zh-CNHK824HK828&hl=zh-TW&sa=X&ved=2ahUKEwjcqPidsu3qAhVDyZQKHWFECmUQ4lYoBnoECAEQGg)[grafana dashboards]( https://www.google.com/search?q=Grafana&tbm=isch&chips=q:grafana ,online_chips:grafana+dashboards&bih=644&biw=1364&rlz=1C1GCEU_zh-CNHK824HK828&hl=zh-TW&sa=X&ved=2ahUKEwjcqPidsu3qAhVDyZQKHWFECmUQ4lYoB3oECAEQGw)[grafana labs]( https://www.google.com/search?q=Grafana&tbm=isch&chips=q:grafana ,online_chips:grafana+labs&bih=644&biw=1364&rlz=1C1GCEU_zh-CNHK824HK828&hl=zh-TW&sa=X&ved=2ahUKEwjcqPidsu3qAhVDyZQKHWFECmUQ4lYoCHoECAEQHA)[grafana dashboard]( https://www.google.com/search?q=Grafana&tbm=isch&chips=q:grafana ,online_chips:grafana+dashboard&bih=644&biw=1364&rlz=1C1GCEU_zh-CNHK824HK828&hl=zh-TW&sa=X&ved=2ahUKEwjcqPidsu3qAhVDyZQKHWFECmUQ4lYoCXoECAEQHQ)[elasticsearch]( https://www.google.com/search?q=Grafana&tbm=isch&chips=q:grafana ,online_chips:elasticsearch&bih=644&biw=1364&rlz=1C1GCEU_zh-CNHK824HK828&hl=zh-TW&sa=X&ved=2ahUKEwjcqPidsu3qAhVDyZQKHWFECmUQ4lYoCnoECAEQHg)[graphite]( https://www.google.com/search?q=Grafana&tbm=isch&chips=q:grafana ,online_chips:graphite&bih=644&biw=1364&rlz=1C1GCEU_zh-CNHK824HK828&hl=zh-TW&sa=X&ved=2ahUKEwjcqPidsu3qAhVDyZQKHWFECmUQ4lYoC3oECAEQHw)[telegraf]( https://www.google.com/search?q=Grafana&tbm=isch&chips=q:grafana ,online_chips:telegraf&bih=644&biw=1364&rlz=1C1GCEU_zh-CNHK824HK828&hl=zh-TW&sa=X&ved=2ahUKEwjcqPidsu3qAhVDyZQKHWFECmUQ4lYoDHoECAEQIA)[monitor]( https://www.google.com/search?q=Grafana&tbm=isch&chips=q:grafana ,online_chips:monitor&bih=644&biw=1364&rlz=1C1GCEU_zh-CNHK824HK828&hl=zh-TW&sa=X&ved=2ahUKEwjcqPidsu3qAhVDyZQKHWFECmUQ4lYoDXoECAEQIQ)[data source]( https://www.google.com/search?q=Grafana&tbm=isch&chips=q:grafana ,online_chips:data+source&bih=644&biw=1364&rlz=1C1GCEU_zh-CNHK824HK828&hl=zh-TW&sa=X&ved=2ahUKEwjcqPidsu3qAhVDyZQKHWFECmUQ4lYoDnoECAEQIg)[github]( https://www.google.com/search?q=Grafana&tbm=isch&chips=q:grafana ,online_chips:github&bih=644&biw=1364&rlz=1C1GCEU_zh-CNHK824HK828&hl=zh-TW&sa=X&ved=2ahUKEwjcqPidsu3qAhVDyZQKHWFECmUQ4lYoD3oECAEQIw)
 iT 邦幫忙::一起幫忙解決難題,拯救IT 人的一天ithelp.ithome.com.tw
 一個高顏值監控繪圖工具grafana的部署! - 每日頭條kknews.cc
 Adding Consistency and Automation to Grafana | by Holden Omans ...techblog.commercetools.com
 What's new in Grafana v6.0 | Grafana Labsgrafana.com
 Grafana Features | Grafana Labsgrafana.com
 Strava plugin for Grafana | Grafana Labsgrafana.com
 Create a Prometheus Monitoring Server with a Grafana Dashboard ...levelup.gitconnected.com
 Overview | Grafana Administrator Guidesupport.websoft9.com
 Grafana介紹及安裝. 1. 介紹| by Pizza | Pizza's | Mediummedium.com
 Grafana - bitbox-basebase.shiftcrypto.ch
 A Look Inside GitLab's Public Dashboards | Grafana Labsgrafana.com
 How to create a Grafana metrics dashboard via Influx and PowerShellwragg.io
 使用Grafana 監視Azure 服務與應用程式- Azure Monitor | Microsoft Docsdocs.microsoft.com
 Overview of the Grafana Dashboard with SQLsqlshack.com
 Grafana | Prometheusprometheus.io
 Grafana Dashboards for Prometheus Metrics | by Danuka Praneeth ...medium.com
 JDunphy-Grafana - Zimbra :: Tech Centerwiki.zimbra.com
 Building dashboards with Grafana - Dots and Brackets: Code Blogcodeblog.dotsandbrackets.com
 Azure Service Bus dashboard for Grafana | Grafana Labsgrafana.com
 Pro Tips: Dashboard Navigation Using Links | Grafana Labsgrafana.com
链接
- OpenTracing:http: //opentracing.io
- 带有演示的Github存储库:https : //github.com/objectiser/opentracing-prometheus-example
- OpenTracing Java指标:https : //github.com/opentracing-contrib/java-metrics
- Kubernetes:https 😕/kubernetes.io
- 积家:https : //github.com/uber/jaeger
- 普罗米修斯:https : //prometheus.io
- Hawkular:http: //www.hawkular.org/
学到更多
您可以在即将举行的OpenShift Commons简报中了解有关分布式跟踪和Jaeger的更多信息, 其中
包括Jaeger和Prometheus在Kubernetes上的分布式跟踪以及Yuri Shkuro(Uber)和Gary Brown(红帽)
可以在这里找到所有即将举行的OpenShift Commons简报的时间表:https : //commons.openshift.org/events.html
请注意:本文是由Red Hat的Gary Brown撰写的,最初发布在这里:http: //www.hawkular.org/blog/2017/06/26/opentracing-appmetrics.html


 浙公网安备 33010602011771号