python 三维作图详例
python 作图详例
三维图
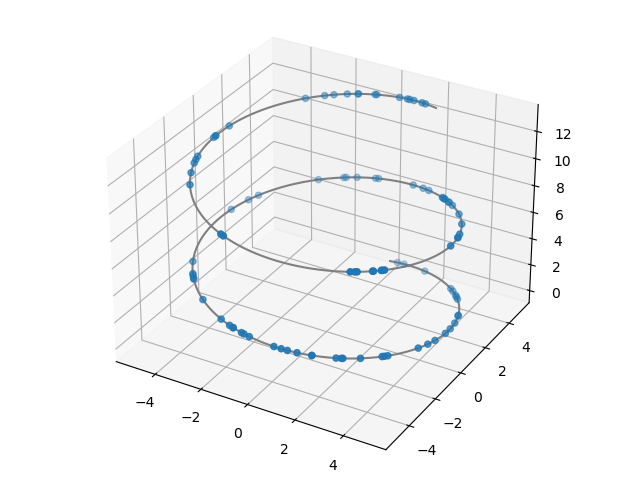
- 散点图
import numpy as np
from matplotlib import pyplot as plt
from mpl_toolkits.mplot3d import Axes3D

# 定义图像和三维格式坐标轴
fig = plt.figure()
ax1 = Axes3D(fig)

z = np.linspace(0,13,1000)
x = 5*np.sin(z)
y = 5*np.cos(z)
zd = 13*np.random.random(100)
xd = 5*np.sin(zd)
yd = 5*np.cos(zd)
ax1.scatter3D(xd,yd,zd, cmap='Blues')  #绘制散点图
ax1.plot3D(x,y,z,'gray')    #绘制空间曲线
plt.show()
- 三维曲面
import numpy as np
from matplotlib import pyplot as plt
from mpl_toolkits.mplot3d import Axes3D

fig = plt.figure()  #定义新的三维坐标轴
ax3 = plt.axes(projection='3d')

#定义三维数据
xx = np.arange(-5,5,0.5)
yy = np.arange(-5,5,0.5)
X, Y = np.meshgrid(xx, yy)
Z = np.sin(X)+np.cos(Y)

#作图
ax3.plot_surface(X, Y, Z, cmap='rainbow')
#设定显示范围
ax3.set_xlabel('X')
ax3.set_xlim(-5, 5)  #拉开坐标轴范围显示投影
ax3.set_ylabel('Y')
ax3.set_ylim(-5, 5)
ax3.set_zlabel('Z')
ax3.set_zlim(-3, 3)

ax3.contour(X, Y, Z, offset=-2, cmap='rainbow')   #等高线图,要设置offset,为Z的最小值
plt.show()

-
如何实现视角的切换
建议使用 matlab查看
文章三维图部分学习了: https://blog.csdn.net/u014636245/article/details/82799573
本文来自博客园,作者:CuriosityWang,转载请注明原文链接:https://www.cnblogs.com/curiositywang/p/14877903.html

 浙公网安备 33010602011771号