MATLAB制作绘图动画/保存视频
MATLAB制作绘图动画/保存视频
命令有哪些:coment 二维彗星图 https://ww2.mathworks.cn/help/matlab/ref/comet.html?s_tid=srchtitle
coment3 三维彗星图 https://ww2.mathworks.cn/help/matlab/ref/comet3.html?s_tid=srchtitle
scattter 二维散点图 https://ww2.mathworks.cn/help/matlab/ref/scatter.html?s_tid=srchtitle
scattter3 三维散点图 https://ww2.mathworks.cn/help/matlab/ref/scatter3.html?s_tid=srchtitle
animatedline 创建动画线条 https://ww2.mathworks.cn/help/matlab/ref/animatedline.html
好文参考:https://blog.csdn.net/zengxiantao1994/article/details/77482852 --比较全面
getframe函数和movie函数详解:getframe函数可以捕捉动画帧,并保存到矩阵中。该函数的主要格式有:
1、f = getframe,从当前图形框中得到动画帧;
2、f = getframe(h),从图形句柄h中得到动画帧;
3、f = getframe(h,rect),从图形句柄h的指定区域rect中得到动画帧。
当创建了一系列动画帧后,可利用movie函数播放这些动画帧。该函数的主要格式有:
1、movie(M),将矩阵M中的动画帧播放一次;
2、movie(M, n),将矩阵M中的动画帧播放n次
3、movie(M, n, fps),将矩阵M中的动画帧以每秒fps帧的速度播放n次。
axis square 当前坐标系图形设置为方形,刻度范围不一定一样,但是一定是方形的。
axis equal 将横轴纵轴的定标系数设成相同值,即单位长度相同,刻度是等长的,但不一定是方形的。
axis manual:将坐标轴的范围锁定为当前范围。如果打开了hold on命令,则后续的图形都使用同样的坐标范围。该函数设置XLimMode、YLimMode和ZLimMode属性为manual值。
一.使用 animatedline
参考:https://ww2.mathworks.cn/help/matlab/ref/animatedline.html
an = animatedlineaddpoints 函数循环向线条中添加点来创建动画。
an = animatedline(x, 创建一根包含由 y)x 和 y 定义的初始数据点的动画线条。
an = animatedline(x,y,z)x、y 和 z 定义的初始数据点的动画线条。
an = animatedline(___,Name,value)'Color','r' 将线条颜色设置为红色。在前面语法中的任何输入参数组合后使用此选项。
an = animatedline(ax,___)ax 指定的坐标区或地理坐标区中,而不是在当前坐标区 (gca) 中创建线条。选项 ax 可以位于前面的语法中的任何输入参数组合之前。
clc;close all;clear;

%%
x = 0:0.05:8*pi;
y = sin(x);
figure(1)
curve = animatedline('color','r','linestyle','-.','linewidth',2,'marker','o');%指定线条特性
set(gca,'XLim',[0,8*pi],'YLim',[-1,1]);
grid on
legend('Anmiated Sine')
for i =1:length(x)
    addpoints(curve,x(i),y(i))
    drawnow
end
加快动画绘制速度的方法:
1.使用命令:drawnow limitrate
2.每次添加点数增多

例1:
clc;close all;clear;

%%
x = 0:0.05:8*pi;
y = sin(x);
figure(1)
curve = animatedline('color','r','linestyle','-.','linewidth',2,'marker','o');%指定线条特性
set(gca,'XLim',[0,8*pi],'YLim',[-1,1]);
grid on
legend('Anmiated Sine')
for i =1:length(x)
    addpoints(curve,x(i),y(i))
    %drawnow
    drawnow limitrate %the command ‘limitrate' is used to speed up the plot speed
    %pause(0.001)  %每执行一次命令就暂停0.001s
end

例2:
clc;close all;clear;

%%
x = 0:0.05:8*pi;
y = sin(x);
figure(1)
curve = animatedline('color','r','linestyle','-.','linewidth',2,'marker','o');
set(gca,'XLim',[0,8*pi],'YLim',[-1,1]);
grid on
legend('Anmiated Sine')
for k =1:11:length(x)-10
    xvec = x(k:k+10);%一次多添加几个点
    yvec = y(k:k+10);
    addpoints(curve,xvec,yvec)
    drawnow
end
控制动画速度
1.使用命令:pause(t)
2.在屏幕上绘制更新之前先运行动画循环的多个迭代,以此来控制动画速度。在drawnow太慢或drawnow limitrate太快时可以使用此技术。
例如,每 1/30 秒更新一次屏幕。使用tic和toc命令可跟踪屏幕更新间经过的时间。注:更小的时间间隔会使屏幕更新更频繁,从而产生更慢的动画。
例如,使用b > (1/1000)可以减慢动画速度。
例1:
clc;close all;clear;

%%
x = 0:0.05:8*pi;
y = sin(x);
figure(1)
curve = animatedline('color','r','linestyle','-.','linewidth',2,'marker','o');%指定线条特性
set(gca,'XLim',[0,8*pi],'YLim',[-1,1]);
grid on
legend('Anmiated Sine')
for i =1:length(x)
    addpoints(curve,x(i),y(i))
    pause(0.001)  %每执行一次命令就暂停0.001s
end
例2:
h = animatedline;
axis([0,4*pi,-1,1])
numpoints = 10000;
x = linspace(0,4*pi,numpoints);
y = sin(x);
a = tic; % start timer
for k = 1:numpoints
    addpoints(h,x(k),y(k))
    b = toc(a); % check timer
    if b > (1/30)
        drawnow % update screen every 1/30 seconds
        a = tic; % reset timer after updating
    end
end
drawnow % draw final frame
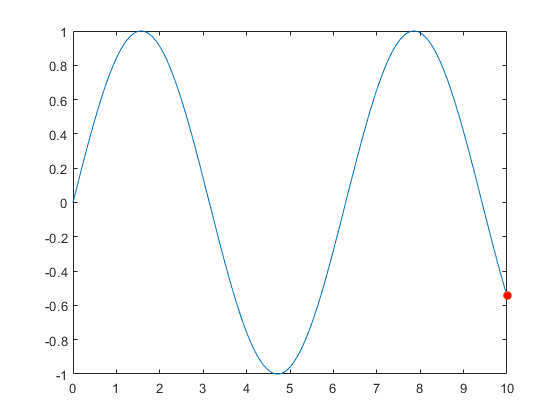
动画演示标记沿着线条移动。
https://ww2.mathworks.cn/help/matlab/creating_plots/trace-marker-along-line.html
使用scatter也可以实现
%动画演示标记沿着线条移动。
figure
x = linspace(0,10,1000);
y = sin(x);
plot(x,y)
hold on
p = plot(x(1),y(1),'o','MarkerFaceColor','red');
hold off
axis manual

for k = 2:length(x)
    p.XData = x(k);
    p.YData = y(k);
    drawnow
end
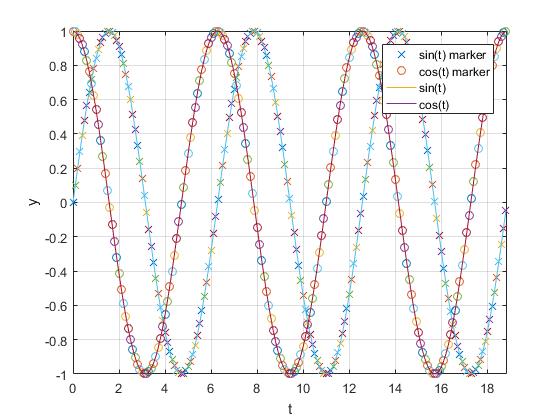
% cherrycheung
clc; close all;
 t = 0:0.1:6*pi;
 y = sin(t);
 y2 = cos(t);
 for k = 1:length(t)
     %% marker plots  画出当前的位置
      plot(t(k),y(k),'x')
      hold on
      plot(t(k),y2(k),'o')
      hold on
     %% line plots  (每次重复画并覆盖以前的线条)
      plot(t(1:k),y(1:k))
      hold on
      plot(t(1:k),y2(1:k))
     %% graph properties
      axis([0 6*pi -1 1])
      grid on
      xlabel('t')
      ylabel('y')
      legend('sin(t) marker', 'cos(t) marker', 'sin(t)', 'cos(t)')
      pause(0.1)
%     if k ~= length(t) %作用删除每次重复画的图保留最后一张图
%      clf
%     end
 end
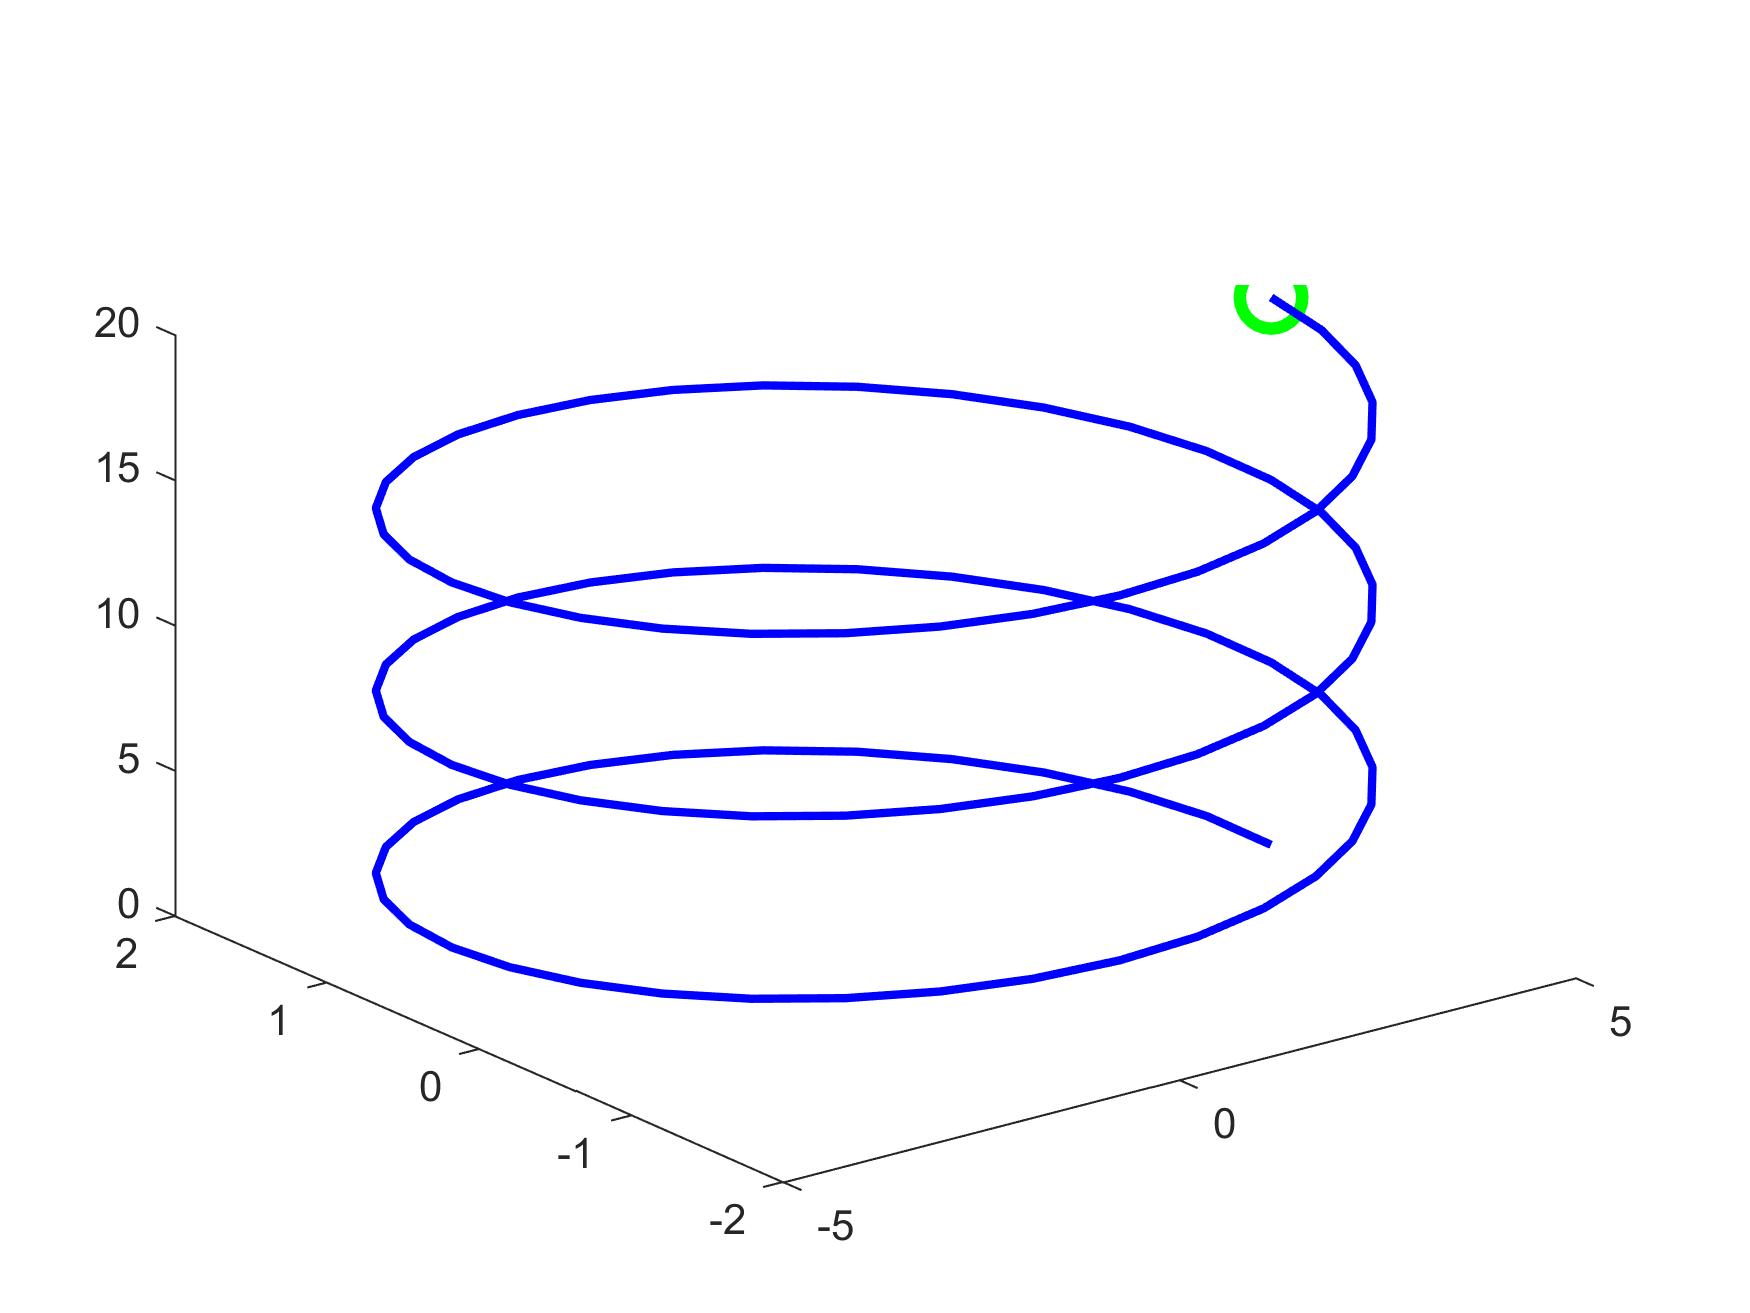
三维的绘图效果
z = 0:0.05:10;
y = sin(2*z);
x = cos(2*z);
figure(2)
curve = animatedline('linewidth',3,'color','b');
set(gca,'XLim',[-1.5,1.5],'YLim',[-1.5,1.5],'ZLim',[0 10]);
grid on
hold on
view(43,24); % viewpiont
for i =1:length(z)
    addpoints(curve,x(i),y(i),z(i))
    head =scatter3(x(i),y(i),z(i),'filled','MarkerFaceColor','g','MarkerEdgeColor','r');
    drawnow
  % pause(0.01)  %reduce the plotspeed
  % delete(head);
end
加上delete head 的效果
z = 0:0.05:10;
y = sin(2*z);
x = cos(2*z);
figure(2)
curve = animatedline('linewidth',3,'color','b');
set(gca,'XLim',[-1.5,1.5],'YLim',[-1.5,1.5],'ZLim',[0 10]);
grid on
hold on
view(43,24); % viewpiont
for i =1:length(z)
    addpoints(curve,x(i),y(i),z(i))
    head =scatter3(x(i),y(i),z(i),'filled','MarkerFaceColor','g','MarkerEdgeColor','r');
    drawnow
   %pause(0.01)  %reduce the plotspeed
    delete(head);
end

二 .创建视频动画
命令:VideoWriter 详细的视频属性参考:https://ww2.mathworks.cn/help/matlab/ref/videowriter.html#d122e1351518
v = VideoWriter(filename) 创建一个 VideoWriter 对象以将视频数据写入采用 Motion JPEG 压缩技术的 AVI 文件。
v = VideoWriter(filename,profile) 还应用一组适合特定文件格式(例如 'MPEG-4' 或 'Uncompressed AVI')的属性。
filename文件名;profile文件类型,默认为‘Motion JPEG AVI’
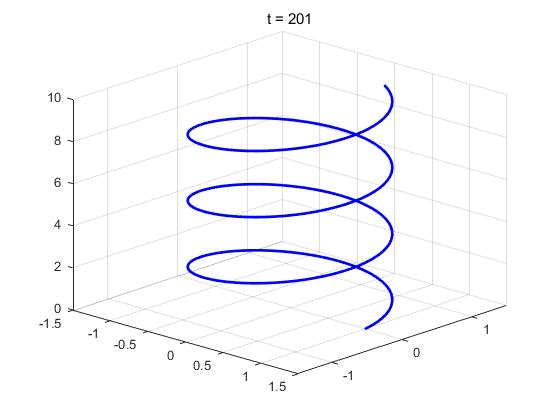
%% creating a video

z = 0:0.05:10;
y = sin(2*z);
x = cos(2*z);
figure(3)
curve = animatedline('linewidth',2,'color','b');
set(gca,'XLim',[-1.5,1.5],'YLim',[-1.5,1.5],'ZLim',[0 10]);
grid on
hold on
view(43,24); % viewpiont
% title('Melix');
% set(gcf,'Units','normalized','OuterPosition',[0 0 1 1]); % 使用更大的页面看图 ,set(gcf) 获的图片
for i =1:length(z)
    addpoints(curve,x(i),y(i),z(i))
    head =scatter3(x(i),y(i),z(i),'MarkerFaceColor','b','MarkerEdgeColor','r');
    % head =scatter3(x(i),y(i),z(i),'filled','MarkerFaceColor','b','MarkerEdgeColor','r');
    drawnow
    F(i) = getframe(gcf);
    % pause(0.01)  %reduce the plotspeed
    delete(head);
    title(['t = ',num2str(i)])
end

video = VideoWriter('helix.avi','Uncompressed AVI'); % 可以选'Uncompressed AVI', 或者内存更小的 'MPEG-4'也就是MP4
video.FrameRate = 60; %视频帧数
video.Quality = 90;   %视频质量,默认75,取值[0,100]
open(video)
writeVideo(video,F);
close(video)
不随时间旋转的情况,
%% Step 1: Generate Data
%Animate a point moving along a 3D parametric curve
t = linspace(0,2*pi,100);
x = 5*cos(t);
y = 2*sin(t);
z = t;

%% Step 2: Draw/Render Scenario
figure;
for k=1:length(t)
    %Clear the figure to start with a blank slate
    clf %clean the figure marker everytime

    %Extract data at the current time step
    t_k = t(k);
    x_k = x(k);
    y_k = y(k);
    z_k = z(k);

    %Where is the current point?
    plot3(x_k, y_k, z_k, 'go', 'LineWidth', 3, 'MarkerSize', 15)

    %Plot the entire curve
    hold on
    plot3(x, y, z, 'b-', 'LineWidth', 2);

    %Add plotting options
    grid on
    xlabel('x')
    ylabel('y')
    zlabel('z')
    title(['t = ',num2str(t_k)])
    view([30 35])

    %% Step 3: Take a Snapshot
    %   force Matlab to Draw the image at this point
%   drawnow
%   pause(0.01)
    %Save the frame
    movieVector(k) = getframe;


    %% Step 4: Advance Time
    %Happens automatically if using a for loop
end

%% Step 5: Save Movie
%Create a VideoWriter object and set properties
myWriter = VideoWriter('curve');              %create an .avi file
% myWriter = VideoWriter('curve','MPEG-4');   %create an .mp4 file
myWriter.FrameRate = 20;

%Open the VideoWriter object, write the movie, and close the file
open(myWriter);
writeVideo(myWriter, movieVector);
close(myWriter);
disp('DONE!')
随时间旋转
要对getframe的捕获图形区域进行限制,否则会出现随着时间发生变话,每张图获得的帧数不一致,为此加了这一行
figh = figure;
movieVector(k) = getframe(figh, [10 10 520 400]); %manually specify getframe region
%Christopher Lum
%lum@uw.edu
%Illustrate animation in Matlab
%This file is designed to accompany the YouTube video at https://youtu.be/3I1_5M7Okqo

clear
clc
close all

%% Step 1: Generate Data
%Animate a point moving along a 3D parametric curve
t = linspace(0,2*pi,100);
x = 5*cos(t);
y = 2*sin(t);
z = t;

%% Step 2: Draw/Render Scenario
figh = figure;
for k=1:length(t)
    %Clear the figure to start with a blank slate
    clf % clean the figure marker everytime

    %Extract data at the current time step
    t_k = t(k);
    x_k = x(k);
    y_k = y(k);
    z_k = z(k);

    %Where is the current point?
    plot3(x_k, y_k, z_k, 'go', 'LineWidth', 3, 'MarkerSize', 15)

    %Plot the entire curve
    hold on
    plot3(x, y, z, 'b-', 'LineWidth', 2);

    %Add plotting options
    grid on
    xlabel('x')
    ylabel('y')
    zlabel('z')
    title(['t = ',num2str(t_k)])
%     view([30 35])
   view([30+20*t_k 35])      %show how viewpoint can be manipulated

    %% Step 3: Take a Snapshot
    % force Matlab to Draw the image at this point
%   drawnow
%   pause(0.01)
    %Save the frame
%   movieVector(k) = getframe;
    movieVector(k) = getframe(figh, [10 10 520 400]);   %manually specify getframe region

    %% Step 4: Advance Time
    %Happens automatically if using a for loop
end

%% Step 5: Save Movie
%Create a VideoWriter object and set properties
myWriter = VideoWriter('curve');              %create an .avi file
% myWriter = VideoWriter('curve','MPEG-4');   %create an .mp4 file
myWriter.FrameRate = 20;

%Open the VideoWriter object, write the movie, and close the file
open(myWriter);
writeVideo(myWriter, movieVector);
close(myWriter);

disp('DONE!')
上述方法虽然可行,但对于大规模数据绘图来说较慢,因为他是每次重新绘图的
采用下面的方式可会绘制较快。
axes --用法参考:https://ww2.mathworks.cn/help/matlab/ref/matlab.graphics.axis.axes-properties.html
https://ww2.mathworks.cn/help/matlab/ref/axes.html?s_tid=srchtitle
https://www.cnblogs.com/stxs/p/8721348.html
%% 这个方法运行更快,因为只是每次刷新数据而已,不再每次重新画图
tic %计时
t = linspace(0,6*pi,100);
x = 5*cos(t);
y = 2*sin(t);
z = t;
figh =figure
ax = axes(figh,'XGrid','on','YGrid','on','Position',[0.1 0.1 0.8 0.8],'Box','on')
plot3(ax,x, y, z, 'b-', 'LineWidth', 2);           %plot the curve outside the loop only once
hold on
Plot1 = plot3(ax, 0, 0, 0,'go', 'LineWidth', 3, 'MarkerSize', 15);                           %initialize empty plot;
for k=1:length(t)

    %Extract data at the current time step
    t_k = t(k);
    x_k = x(k);
    y_k = y(k);
    z_k = z(k);
    Plot1.XData = x_k;  % refresh just the X Y Z data inside the loop (way quicker than reinitializing a whole new plot each time)
    Plot1.YData = y_k;
    Plot1.ZData = z_k;
    drawnow
end
toc
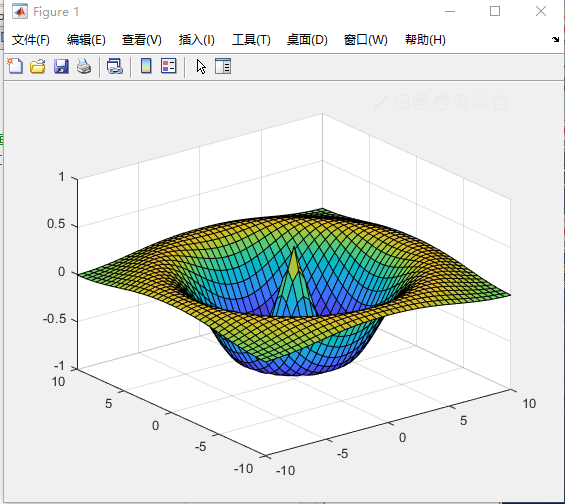
close all;clc;clear;
axis tight equal
%axis equal 沿每个坐标轴使用相同的数据单位长度
%axis tight 将坐标轴范围设置为等同于数据范围,使轴框紧密围绕数据
v = VideoWriter('exp3dVideo.avi'); %先创建一个空文件
open(v);
[x,y] = meshgrid(-10:0.5:10, -10:0.5:10);
r  = sqrt(x.^2+y.^2);
for k = 0:200
    z = cos(r/2+k/10).*exp(-r.^2/50);
    surf(x,y,z);
    xlim([-10,10]);
    ylim([-10,10]);
    zlim([-1,1]);
    frame = getframe(gcf);
    writeVideo(v,frame);
end

close(v);
动态视频--但无法插入
三.创建GIF文件
命令:rgb2ind 将 RGB 图像转换为索引图像 https://ww2.mathworks.cn/help/matlab/ref/rgb2ind.html?s_tid=srchtitle
imwrite 将图像写入图形文件 https://ww2.mathworks.cn/help/matlab/ref/imwrite.html?s_tid=srchtitle#btv3cny-5
z = 0:0.05:10;
y = sin(2*z);
x = cos(2*z);
figure(2)
curve = animatedline('linewidth',3,'color','b');
set(gca,'XLim',[-1.5,1.5],'YLim',[-1.5,1.5],'ZLim',[0 10]);
grid on
hold on
view(43,24); % viewpiont
for i =1:length(z)
    addpoints(curve,x(i),y(i),z(i))
    head =scatter3(x(i),y(i),z(i),'filled','MarkerFaceColor','g','MarkerEdgeColor','r');
    drawnow
  % pause(0.01)  %reduce the plotspeed

     %下面是用来画出GIF动画的
     frame = getframe;
     fm{i} = frame2im(frame);
     filename = 'test8_sin(x).gif'; %文件名称
    [A,map] = rgb2ind(fm{i},256);
    if i == 1
       imwrite(A,map,filename,'gif','LoopCount',Inf,'DelayTime',1);
    else
        imwrite(A,map,filename,'gif','WriteMode','append','DelayTime',1);
        delete(head);
    end
end
参考这个:没有这个语句,注意两个区别,并且用的是花括号引用的
fm{i} = frame2im(frame);
clear;clc;
[x,y]=meshgrid(-8:.1:8);
for j=1:10
f=@(x,y)(sin(sqrt((11-j)*(x.^bai2+y.^2)))./sqrt((11-j)*(x.^2+y.^2)+eps));
z=f(x,y);
surf(x,y,z);shading interp;

M(j) = getframe;
  if j==1
    [I,map]=rgb2ind(M(j).cdata,256);
    imwrite(I,map,'out.gif','DelayTime',.1)
  else
    imwrite(rgb2ind(M(j).cdata,map),map,'out.gif','WriteMode','append','DelayTime',.1)
  end
end
VideoWriter(M,'out.avi')
前面画图的
clc;close all;clear;
%%
x = 0:0.05:20*pi;
y = sin(x);
figure(1)
curve = animatedline('color','r','linestyle','-.','linewidth',2,'marker','o');
set(gca,'XLim',[0,20*pi],'YLim',[-1,1]);
grid on
legend('Anmiated Sine')
for i =1:length(x)

    addpoints(curve,x(i),y(i))
%   drawnow limitrate %the command ‘limitrate' is used to speed up the plot speed
    pause(0.01)  %reduce the plotspeed
end

%% 3D plot
z = 0:0.05:10;
y = sin(2*z);
x = cos(2*z);
figure(2)
curve = animatedline('linewidth',3,'color','b');
set(gca,'XLim',[-1.5,1.5],'YLim',[-1.5,1.5],'ZLim',[0 10]);
grid on
hold on
view(43,24); % viewpiont
for i =1:length(z)
    addpoints(curve,x(i),y(i),z(i))
    head =scatter3(x(i),y(i),z(i),'filled','MarkerFaceColor','g','MarkerEdgeColor','r');
    drawnow
  % pause(0.01)  %reduce the plotspeed
  % delete(head);
end

%%
x = 0:0.05:20*pi;
y = sin(x);
figure
curve = animatedline('color','r','linestyle','-.','linewidth',2,'marker','o');
set(gca,'XLim',[0,20*pi],'YLim',[-1,1]);
grid on
legend('Anmiated Sine')
for k =1:11:length(x)-10
    xvec = x(k:k+10);
    yvec = y(k:k+10);
    addpoints(curve,xvec,yvec)
    drawnow
end
%}
%% creating a video

z = 0:0.05:10;
y = sin(2*z);
x = cos(2*z);
figure
curve = animatedline('linewidth',2,'color','b');
set(gca,'XLim',[-1.5,1.5],'YLim',[-1.5,1.5],'ZLim',[0 10]);
grid on
hold on
view(43,24); % viewpiont
% title('Melix');
% set(gcf,'Units','normalized','OuterPosition',[0 0 1 1]); % using larger view figure ,set(gcf) 获得图片
for i =1:length(z)
    addpoints(curve,x(i),y(i),z(i))
    head =scatter3(x(i),y(i),z(i),'MarkerFaceColor','b','MarkerEdgeColor','r');
    % head =scatter3(x(i),y(i),z(i),'filled','MarkerFaceColor','b','MarkerEdgeColor','r');
    drawnow
    F(i) = getframe(gcf);
    % pause(0.01)  %reduce the plotspeed
    delete(head);
    title(['t = ',num2str(i)])
end
video = VideoWriter('helix.avi');
% video = VideoWriter('helix.avi','Uncompressed AVI'); % 'Uncompressed AVI', you can chose other video type with smaller size such as 'MPEG-4'
video.FrameRate = 60;
video.Quality = 90;%视频质量,默认75,取值[0,100]
open(video)
writeVideo(video,F);
close(video)


%% Creating Movies and Animation in matlab
%Christopher Lum
%lum@uw.edu
%Illustrate animation in Matlab
%This file is designed to accompany the YouTube video at https://youtu.be/3I1_5M7Okqo

clear
clc
close all

%% Step 1: Generate Data
%Animate a point moving along a 3D parametric curve
t = linspace(0,2*pi,100);
x = 5*cos(t);
y = 2*sin(t);
z = t;

%% Step 2: Draw/Render Scenario
figh = figure;
for k=1:length(t)
    %Clear the figure to start with a blank slate
    clf % clean the figure marker everytime

    %Extract data at the current time step
    t_k = t(k);
    x_k = x(k);
    y_k = y(k);
    z_k = z(k);

    %Where is the current point?
    plot3(x_k, y_k, z_k, 'go', 'LineWidth', 3, 'MarkerSize', 15)

    %Plot the entire curve
    hold on
    plot3(x, y, z, 'b-', 'LineWidth', 2);

    %Add plotting options
    grid on
    xlabel('x')
    ylabel('y')
    zlabel('z')
    title(['t = ',num2str(t_k)])
%     view([30 35])
   view([30+20*t_k 35])      %show how viewpoint can be manipulated

    %% Step 3: Take a Snapshot
    %   force Matlab to Draw the image at this point
%   drawnow
%   pause(0.01)
    %Save the frame
%   movieVector(k) = getframe;
    movieVector(k) = getframe(figh, [10 10 520 400]);   %manually specify getframe region

    %% Step 4: Advance Time
    %Happens automatically if using a for loop
end

%% Step 5: Save Movie
%Create a VideoWriter object and set properties
myWriter = VideoWriter('curve');              %create an .avi file
% myWriter = VideoWriter('curve','MPEG-4');   %create an .mp4 file
myWriter.FrameRate = 20;

%Open the VideoWriter object, write the movie, and close the file
open(myWriter);
writeVideo(myWriter, movieVector);
close(myWriter);

disp('DONE!')


%% Step 1: Generate Data  没有旋转的
%Animate a point moving along a 3D parametric curve
t = linspace(0,2*pi,100);
x = 5*cos(t);
y = 2*sin(t);
z = t;

%% Step 2: Draw/Render Scenario
figure;
for k=1:length(t)
    %Clear the figure to start with a blank slate
    clf %clean the figure marker everytime

    %Extract data at the current time step
    t_k = t(k);
    x_k = x(k);
    y_k = y(k);
    z_k = z(k);

    %Where is the current point?
    plot3(x_k, y_k, z_k, 'go', 'LineWidth', 3, 'MarkerSize', 15)

    %Plot the entire curve
    hold on
    plot3(x, y, z, 'b-', 'LineWidth', 2);

    %Add plotting options
    grid on
    xlabel('x')
    ylabel('y')
    zlabel('z')
    title(['t = ',num2str(t_k)])
%   view([30 35])
    view([30 35])

    %% Step 3: Take a Snapshot
    %   force Matlab to Draw the image at this point
%   drawnow
%   pause(0.01)
    %Save the frame
    movieVector(k) = getframe;


    %% Step 4: Advance Time
    %Happens automatically if using a for loop
end

%% Step 5: Save Movie
%Create a VideoWriter object and set properties
myWriter = VideoWriter('curve2');              %create an .avi file
% myWriter = VideoWriter('curve','MPEG-4');   %create an .mp4 file
myWriter.FrameRate = 20;

%Open the VideoWriter object, write the movie, and close the file
open(myWriter);
writeVideo(myWriter, movieVector);
close(myWriter);
disp('DONE!')

%{
clear;clc;
[x,y]=meshgrid(-8:0.1:8);
for j=1:10
f=@(x,y)(sin(sqrt((11-j)*(x.^2+y.^2)))./sqrt((11-j)*(x.^2+y.^2)+eps));
z=f(x,y);
surf(x,y,z);shading interp;
M(j) = getframe;
if j==1
   [I,map]=rgb2ind(M(j).cdata,256);
   imwrite(I,map,'out.gif','DelayTime',0.1)
else
     imwrite(rgb2ind(M(j).cdata,map),map,'out.gif','WriteMode','append','DelayTime',0.1)
  end
end
VideoWriter(M,'out.avi')
%}
上述画GIF的代码:
clc;close all;clear;
%%
x = 0:0.05:8*pi;
y = sin(x);
fig = figure(1)
curve = animatedline('color','r','linestyle','-.','linewidth',2,'marker','o');%指定线条特性
set(gca,'XLim',[0,8*pi],'YLim',[-1,1]);
grid on
legend('Anmiated Sine')
for i =1:length(x)
    addpoints(curve,x(i),y(i))
    drawnow
    %下面是用来画出GIF动画的
     frame = getframe(fig);
     fm{i} = frame2im(frame);
     filename = 'test1_sin(x).gif'; %文件名称
    [A,map] = rgb2ind(fm{i},256);
    if i == 1
        imwrite(A,map,filename,'gif','LoopCount',Inf,'DelayTime',1);
    else
        imwrite(A,map,filename,'gif','WriteMode','append','DelayTime',1);
    end
end


x = 0:0.05:8*pi;
y = sin(x);
figure(2)
curve = animatedline('color','r','linestyle','-.','linewidth',2,'marker','o');%指定线条特性
set(gca,'XLim',[0,8*pi],'YLim',[-1,1]);
grid on
legend('Anmiated Sine')
for i =1:length(x)
    addpoints(curve,x(i),y(i))
    %drawnow
    drawnow limitrate %the command ‘limitrate' is used to speed up the plot speed
    %pause(0.001)  %每执行一次命令就暂停0.001s
    %下面是用来画出GIF动画的
    frame = getframe;
     fm{i} = frame2im(frame);
     filename = 'test2_sin(x).gif'; %文件名称
    [A,map] = rgb2ind(fm{i},256);
    if i == 1
        imwrite(A,map,filename,'gif','LoopCount',Inf,'DelayTime',1);
    else
        imwrite(A,map,filename,'gif','WriteMode','append','DelayTime',1);
    end
end


x = 0:0.05:8*pi;
y = sin(x);
figure(3)
curve = animatedline('color','r','linestyle','-.','linewidth',2,'marker','o');
set(gca,'XLim',[0,8*pi],'YLim',[-1,1]);
grid on
legend('Anmiated Sine')
for k =1:11:length(x)-10
    xvec = x(k:k+10);%一次多添加几个点
    yvec = y(k:k+10);
    addpoints(curve,xvec,yvec)
    drawnow
    %下面是用来画出GIF动画的
     frame = getframe;
     fm{k} = frame2im(frame);
     filename = 'test3_sin(x).gif'; %文件名称
    [A,map] = rgb2ind(fm{k},256);
    if k == 1
        imwrite(A,map,filename,'gif','LoopCount',Inf,'DelayTime',1);
    else
        imwrite(A,map,filename,'gif','WriteMode','append','DelayTime',1);
    end
end


x = 0:0.05:8*pi;
y = sin(x);
figure(4)
curve = animatedline('color','r','linestyle','-.','linewidth',2,'marker','o');%指定线条特性
set(gca,'XLim',[0,8*pi],'YLim',[-1,1]);
grid on
legend('Anmiated Sine')
for i =1:length(x)
    addpoints(curve,x(i),y(i))
    pause(0.001)  %每执行一次命令就暂停0.001s
    %下面是用来画出GIF动画的
      frame = getframe;
     fm{i} = frame2im(frame);
     filename = 'test4_sin(x).gif'; %文件名称
    [A,map] = rgb2ind(fm{i},256);
    if i == 1
        imwrite(A,map,filename,'gif','LoopCount',Inf,'DelayTime',1);
    else
        imwrite(A,map,filename,'gif','WriteMode','append','DelayTime',1);
    end
end


h = animatedline;
axis([0,2*pi,-1,1])
numpoints = 10000;
x = linspace(0,2*pi,numpoints);
y = sin(x);
a = tic; % 启动计时
for k = 1:numpoints
    addpoints(h,x(k),y(k))
    b = toc(a); % 查看时间
    if b > (1/10)
        drawnow  % 每1/10 seconds刷新一次图像,更新时间越短,动画越慢
        a = tic; % 每次更新后重置计时器
    end

    %下面是用来画出GIF动画的
      frame = getframe;
     fm{k} = frame2im(frame);
     filename = 'test5_sin(x).gif'; %文件名称
    [A,map] = rgb2ind(fm{k},256);
    if k == 1
        imwrite(A,map,filename,'gif','LoopCount',Inf,'DelayTime',1);
    else
        imwrite(A,map,filename,'gif','WriteMode','append','DelayTime',1);
    end

end
drawnow % 画出最后一帧图像


%% 3D plot
z = 0:0.05:10;
y = sin(2*z);
x = cos(2*z);
figure(2)
curve = animatedline('linewidth',3,'color','b');
set(gca,'XLim',[-1.5,1.5],'YLim',[-1.5,1.5],'ZLim',[0 10]);
grid on
hold on
view(43,24); % viewpiont
for i =1:length(z)
    addpoints(curve,x(i),y(i),z(i))
    head =scatter3(x(i),y(i),z(i),'filled','MarkerFaceColor','g','MarkerEdgeColor','r');
    drawnow
  % pause(0.01)  %reduce the plotspeed

   %下面是用来画出GIF动画的
      frame = getframe;
     fm{i} = frame2im(frame);
     filename = 'test6_sin(x).gif'; %文件名称
    [A,map] = rgb2ind(fm{i},256);
    if i == 1
        imwrite(A,map,filename,'gif','LoopCount',Inf,'DelayTime',1);
    else
        imwrite(A,map,filename,'gif','WriteMode','append','DelayTime',1);
    end
end

%}

z = 0:0.05:10;
y = sin(2*z);
x = cos(2*z);
figure(2)
curve = animatedline('linewidth',3,'color','b');
set(gca,'XLim',[-1.5,1.5],'YLim',[-1.5,1.5],'ZLim',[0 10]);
grid on
hold on
view(43,24); % viewpiont
for i =1:length(z)
    addpoints(curve,x(i),y(i),z(i))
    head =scatter3(x(i),y(i),z(i),'filled','MarkerFaceColor','g','MarkerEdgeColor','r');
    drawnow
  % pause(0.01)  %reduce the plotspeed

     %下面是用来画出GIF动画的
      frame = getframe;
     fm{i} = frame2im(frame);
     filename = 'test8_sin(x).gif'; %文件名称
    [A,map] = rgb2ind(fm{i},256);
    if i == 1
       imwrite(A,map,filename,'gif','LoopCount',Inf,'DelayTime',1);
    else
        imwrite(A,map,filename,'gif','WriteMode','append','DelayTime',1);
        delete(head);
    end
end


x = 0:0.01:1;
n = 3;
y = x.^n;
plot(x,y,'LineWidth',3)
title(['y = x^n,  n = ' num2str(n) ])

n = 1:0.5:5;
nImages = length(n);

fig = figure;
for idx = 1:nImages
    y = x.^n(idx);
    plot(x,y,'LineWidth',3)
    title(['y = x^n,  n = ' num2str( n(idx)) ])
    drawnow
    frame = getframe(fig);
    im{idx} = frame2im(frame);
    pause(0.4)
end
close;

figure;
for idx = 1:nImages
    subplot(3,3,idx)
    imshow(im{idx});
end

filename = 'testAnimated.gif'; % Specify the output file name
for idx = 1:nImages
    [A,map] = rgb2ind(im{idx},256);
    if idx == 1
        imwrite(A,map,filename,'gif','LoopCount',Inf,'DelayTime',1);
    else
        imwrite(A,map,filename,'gif','WriteMode','append','DelayTime',1);
    end
end
未完待续~~~
没办法好像插入的视频,不显示哎!

 浙公网安备 33010602011771号