uniapp-调用echarts
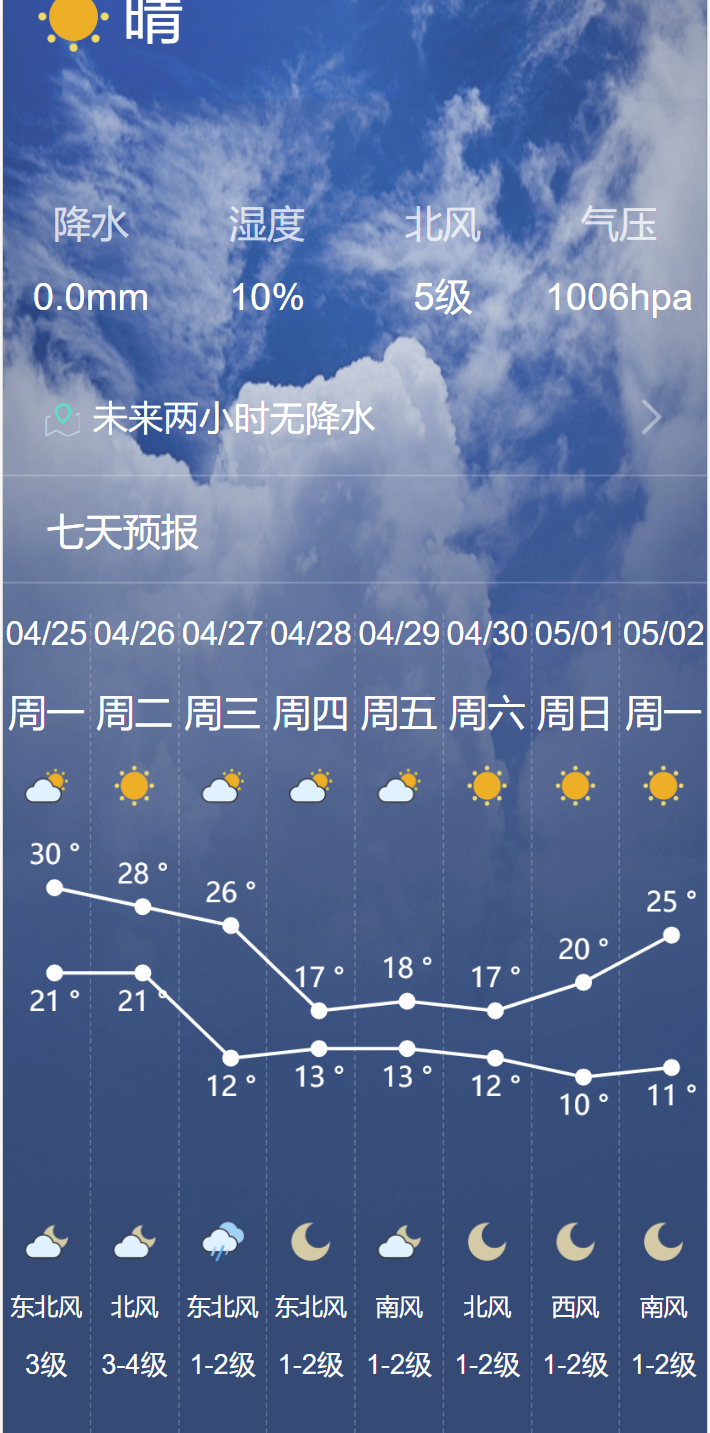
最近再弄的一个小程序项目,需要把天气预测数据可视化,最终的效果如下:
试过几个方案,都不是很好。然后再HBuilder 插件市场找到了echarts-uniapp,这个写起来和原生的echarts差别不大,简单好用。
安装插件 -- 直接通过插件市场安装即可
引入插件 pages.json - esaycom引用 也可以通过main.js去全局引入
"easycom": {
  "echarts": "@/components/echarts-uniapp/echarts-uniapp.vue"
},
页面代码: 这里放的是插件自带的demo代码
<template>
  <view class="container">
    <view class="container-wrap">
      <echarts ref="echarts" :option="option" canvasId="day"></echarts>
    </view>
  </view>
</template>

<script>
export default {
  data() {
    return {
      option: {}
    }
  },
  onReady() {
    this.option = {
      title: {
        text: '测试下面legend的红色区域不应被裁剪',
        left: 'center'
      },
    legend: {
      data: ['A', 'B', 'C'],
      top: 50,
      left: 'center',
      backgroundColor: 'red',
      z: 100
    },
    grid: {
      containLabel: true
    },
    xAxis: {
      type: 'category',
      boundaryGap: false,
      data: ['周一', '周二', '周三', '周四', '周五', '周六', '周日'],
      // show: false
    },
     yAxis: {
      type: 'value',
      splitLine: {
        lineStyle: {
          type: 'dashed'
        }
      }
      // show: false
    },
    series: [{
      name: 'A',
      type: 'line',
      smooth: true,
      data: [18, 36, 65, 30, 78, 40, 33]
    }, {
      name: 'B',
      type: 'line',
      smooth: true,
      data: [12, 50, 51, 35, 70, 30, 20]
    }, {
      name: 'C',
      type: 'line',
      smooth: true,
      data: [10, 30, 31, 50, 40, 20, 10]
    }]
  };
  }
}
</script>
如果图片显示空白,又不报错,请检查下包裹图片的父元素的宽高设置了没有。这个很重要。

 浙公网安备 33010602011771号