使用Promethues和Grafana监控Flink
之前使用Influxdb储存Metrics经常会出现数据写不进去的问题,当Influxdb重启之后又能写进去,遂将数据存储部分换成Promethues,因为Flink采用PutGateway的方式,需要先将PutGateway安装好
flink1.10.0使用prometheus版本是0.3.0,我们在这里使用0.9.1的版本,如果使用最新版1.2.0会出现不兼容的问题
第一步:安装PutGateway
cd /usr/local/
wget https://github.com/prometheus/pushgateway/releases/download/v0.9.1/pushgateway-0.9.1.linux-amd64.tar.gz
tar -zxvf pushgateway-0.9.1.linux-amd64.tar.gz
nohup ./pushgateway &
第二步:配置prometheus
vi /usr/local/prometheus-2.1.0.linux-amd64/prometheus.yml 增加以下配置
  - job_name: 'flink'
    scrape_interval: 10s
    scrape_timeout: 10s
    static_configs:
      - targets: ['localhost:9091']
        labels:
          instance: 'pushgateway'
第三步:配置Flink
nohup /usr/local/prometheus-2.1.0.linux-amd64/prometheus --config.file=/usr/local/prometheus-2.1.0.linux-amd64/prometheus.yml & 启动prometheus
metrics.reporter.promgateway.class: org.apache.flink.metrics.prometheus.PrometheusPushGatewayReporter
metrics.reporter.promgateway.host: xx.xx.xx.xx
metrics.reporter.promgateway.port: 9091
metrics.reporter.promgateway.jobName: flink
metrics.reporter.promgateway.randomJobNameSuffix: true
metrics.reporter.promgateway.deleteOnShutdown: true
cd flink
cp opt/flink-metrics-prometheus-1.10.0.jar lib/
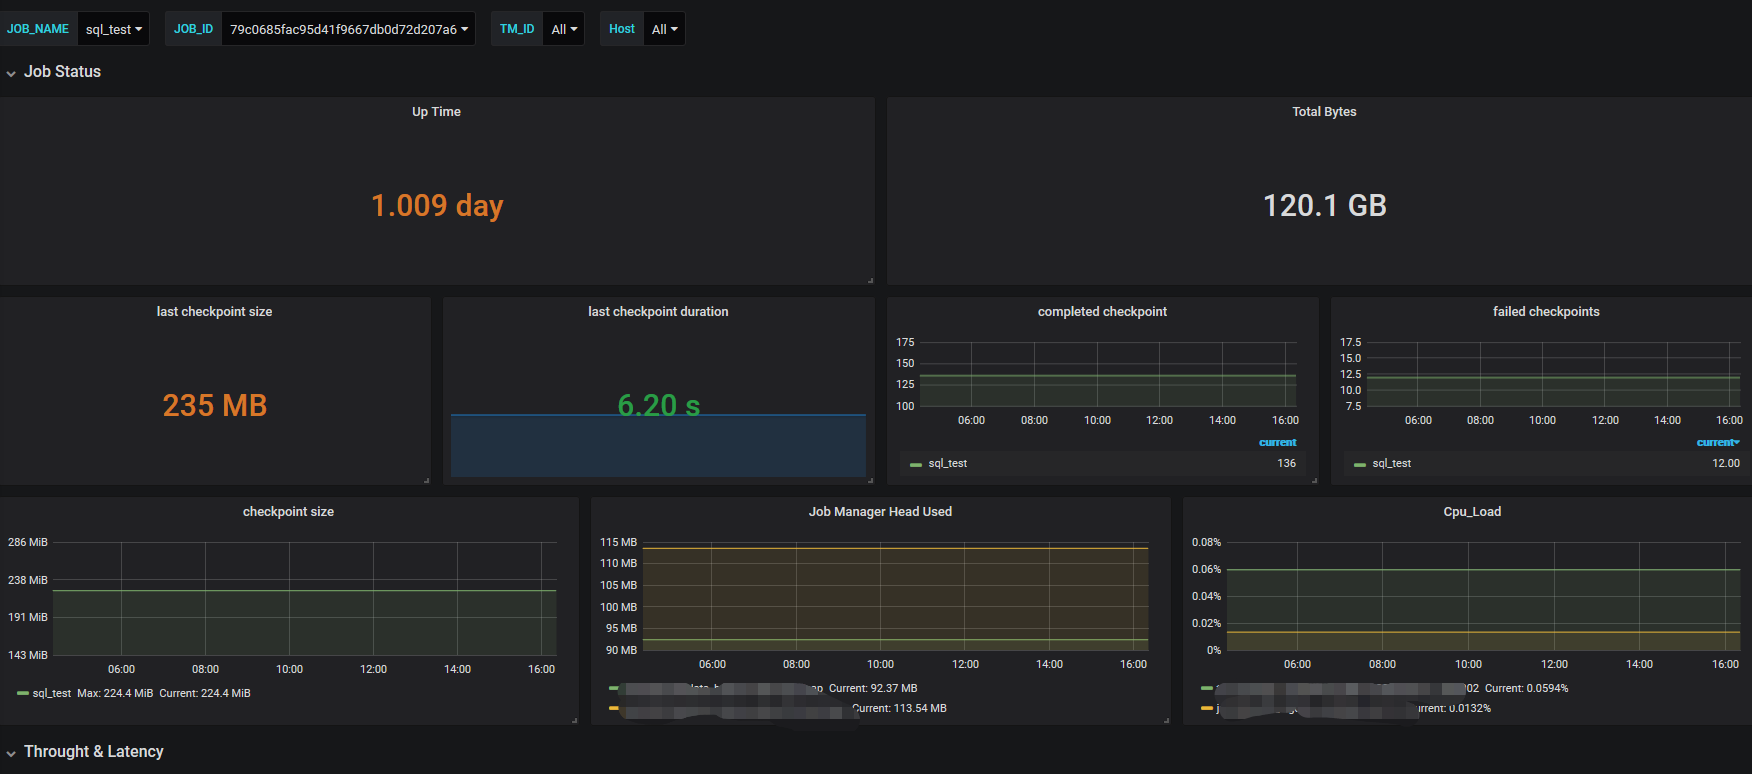
第四步:配置Grafana
配置grafana过程比较痛苦,根据需要监控的指标进行配置,最后展示的页面和之前配置的一样
参考
https://ci.apache.org/projects/flink/flink-docs-release-1.8/monitoring/metrics.html#prometheus-orgapacheflinkmetricsprometheusprometheusreporter
https://github.com/prometheus/pushgateway/releases
https://www.cnblogs.com/huandada/p/10932953.html

 浙公网安备 33010602011771号