python使用curve_fit拟合任意分布
import matplotlib.pyplot as plt
from scipy.optimize import curve_fit
import numpy as np
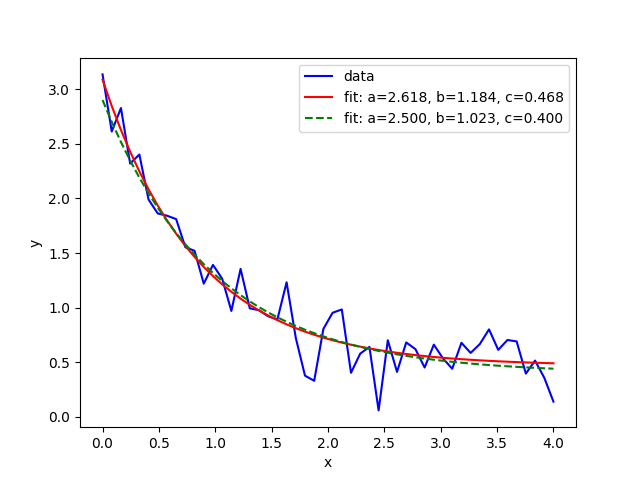
def func(x, a, b, c): # 拟合的方程
return a * np.exp(-b * x) + c
def get_data():
xdata: np.ndarray = np.linspace(0, 4, 50) # x值
y = func(xdata, 2.5, 1.3, 0.5)
rng = np.random.default_rng()
y_noise = 0.2 * rng.normal(size=xdata.size)
ydata: np.ndarray = y + y_noise # y值
return xdata, ydata
if __name__ == '__main__':
x_value, y_value = get_data()
popt, pcov = curve_fit(func, x_value, y_value)
# 绘图
plt.plot(x_value, y_value, 'b-', label='data')
plt.plot(x_value, func(x_value, *popt), 'r-',
label='fit: a=%5.3f, b=%5.3f, c=%5.3f' % tuple(popt))
# 给拟合参数加一个限定范围:0 <= a <= 2.5, 0 <= b <= 1 and 0 <= c <= 0.4
popt_2, pcov_2 = curve_fit(func, x_value, y_value, bounds=([0, 0, 0], [2.5, 1., 0.4]))
plt.plot(x_value, func(x_value, *popt_2), 'g--',
label='fit: a=%5.3f, b=%5.3f, c=%5.3f' % tuple(popt_2))
plt.xlabel('x')
plt.ylabel('y')
plt.legend()
plt.show()
2.
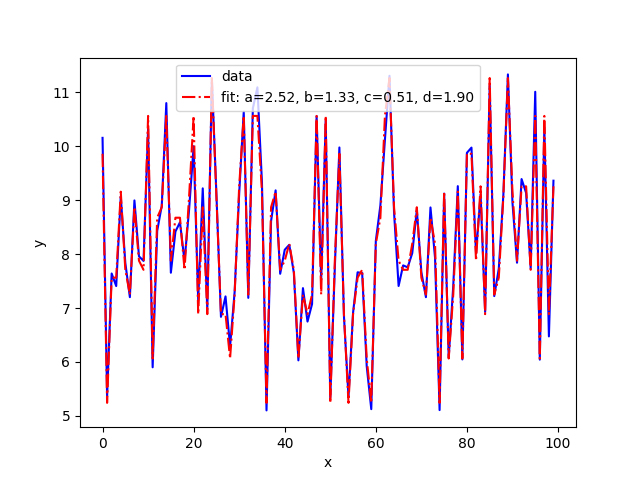
def func(x, a, b, c, d):  # 拟合的方程
    return a*x[:,0]+b*x[:,1]-c*x[:,0]*x[:,1]+d


def get_data():
    xdata: np.ndarray = np.random.randint(1,5,size=(100,2))  # x值
    y = func(xdata, 2.5, 1.3, 0.5,2)
    y_noise = 0.2 * np.random.normal(size=xdata.shape[0])
    ydata = y + y_noise  #  y值
    return xdata, ydata


if __name__ == '__main__':
    x_value, y_value = get_data()
    popt, pcov = curve_fit(func, x_value, y_value)
    # 绘图
    plt.plot(y_value, 'b-', label='data')
    plt.plot(func(x_value, *popt), 'r-.',
             label='fit: a=%4.2f, b=%4.2f, c=%4.2f, d=%4.2f' % tuple(popt))
    plt.xlabel('x')
    plt.ylabel('y')
    plt.legend()
    plt.show()

 浙公网安备 33010602011771号