使用PyQtGraph绘制图形(2)
采用addplot()方法将多个图形添加到一个窗口。
首先利用numpy模块创建两个随机数组,用来作为图形绘制的数据:
from pyqtgraph.Qt import QtCore
import pyqtgraph as pg
import numpy as np

x = np.random.random(50)
y = np.random.random(10)
def pg_addplot():
	win = pg.GraphicsLayoutWidget(show=True)
    # win.resize(800,400)
        # win.setWindowTitle('pyqtgraph example: Plotting')
        win.setBackground('w')
        # Enable antialiasing for prettier plots
        pg.setConfigOptions(antialias=True)

        p1 = win.addPlot()
        p1.addLegend()
        p1.plot(x,pen = 'r',name = 'red curve')
        #win.nextRow()
        p2 = win.addPlot(title = 'y curve')
        p2.plot(y,pen='b',name = 'blue curve')

        pg.exec()
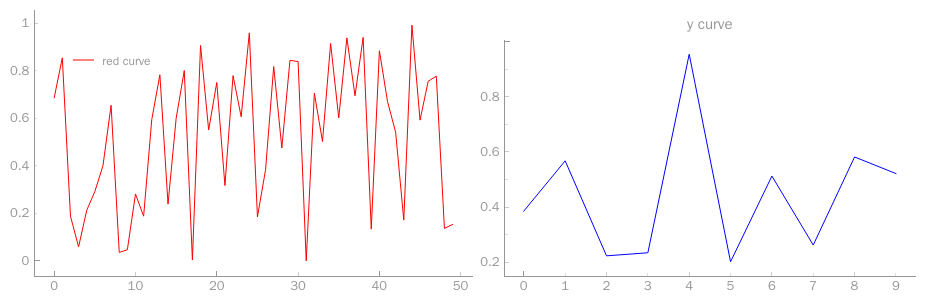
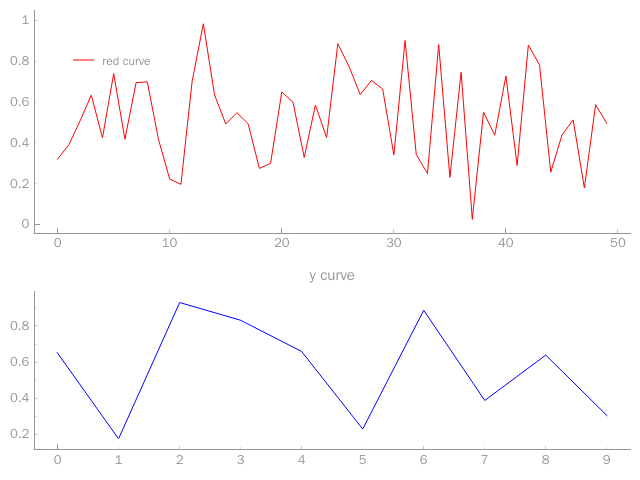
上图为1行2列布置,通过nextRow()更改为2行1列
def pg_addplot():
	app = pg.QtGui.QApplication([])
	win = pg.GraphicsWindow(title="PyQtGraph Tutorial")
	p1 = win.addPlot(title='x曲线')
	p1.plot(x)
        win.nextRow()
	p2 = win.addPlot(title='y曲线')
	p2.plot(y)
	app.exec_()
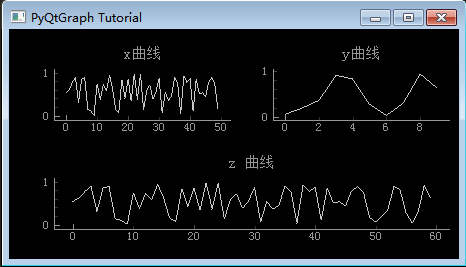
将多个图形放置在一个窗口内,并且占用不同列数
def pg_addplot():
	app = pg.QtGui.QApplication([])
	win = pg.GraphicsWindow(title="PyQtGraph Tutorial")
	p1 = win.addPlot(title='x曲线')
	p1.plot(x)
	p2 = win.addPlot(title='y曲线')
	p2.plot(y)
	win.nextRow()
	p3 = win.addPlot(colspan=2,title='z 曲线')
	p3.plot(z)
	app.exec_()

 浙公网安备 33010602011771号