vue2 antv x6 入门 (二)画布适应、节点、边
1、画布大小
画布自适应当前窗体大小
在实例化 Graph 对象的时候,可以通过设置 width 和 height 固定画布大小,如果不设置,就会以画布容器大小初始化画布。
在项目实践中,经常会遇到下面两种场景:
- 画布容器还没有渲染完成(此时尺寸为 0),就实例化画布对象,导致画布元素显示异常。
- 页面的
resize导致画布容器大小改变,导致画布元素显示异常。
我们可以使用 autoResize 配置来解决上述问题。
<!-- 注意,使用 autoResize 配置时,需要在画布容器外面再套一层宽高都是 100% 的外层容器,在外层容器上监听尺寸改变,当外层容器大小改变时,画布自动重新计算宽高以及元素位置。 -->
<div style="width:100%; height:100%">
  <div id="container"></div>
</div>
const graph = new Graph({
  container: document.getElementById('container'),
  autoResize: true,
})
内容居中 fromJSON 加载数据
this.graph.fromJSON(dataJSON) // 渲染元素
      this.graph.on('render:done', () => {
        console.log('渲染完毕')
        setTimeout(() => {
          this.graph.centerContent() // 居中显示
        }, 10)
      })
窗体大小改变 内容居中:
window.addEventListener('resize', this.handleResize)

handleResize() {
  this.graph.centerContent() // 居中显示
},
示例代码: 监听窗体大小 、 防抖
    //首先写一个获取窗口宽高的方法
    const getWindowInfo = () => {
        const windowInfo = {
            width: window.innerWidth,
            hight: window.innerHeight
        }
        console.log(windowInfo);
    };


    //需要防抖,无论我们怎么拖动窗口大小,只执行一次获取浏览器宽高的方法
    //方法只会在窗口停止变化的 500 毫秒后触发一次
    const debounce = (fn, delay) => {
        let timer;
        return function () {
            if (timer) {
                clearTimeout(timer);
            }
            timer = setTimeout(() => {
                fn();
            }, delay);
        }
    };
    const cancalDebounce = debounce(getWindowInfo, 500);

    //然后监听 resize 事件
    window.addEventListener('resize', cancalDebounce);
2、画布背景与网格
background: 'red'
grid: true
--------------
background: {
        color: '#F2F7FA',
      },
      grid: {
        visible: true,
        type: 'doubleMesh',
        args: [
          {
            color: '#eee', // 主网格线颜色
            thickness: 1, // 主网格线宽度
          },
          {
            color: '#ddd', // 次网格线颜色
            thickness: 1, // 次网格线宽度
            factor: 4, // 主次网格线间隔
          },
        ],
      }
3、缩放与平移
Graph 中通过 panning 和 mousewheel 配置来实现这两个功能,鼠标按下画布后移动时会拖拽画布,滚动鼠标滚轮会缩放画布
 panning: true,
 mousewheel: true,
常用API
graph.resize(800, 600) // resize 画布大小
graph.translate(20, 20) // 在 x、y 方向上平移画布
graph.zoom(0.2) // 将画布缩放级别增加 0.2(默认为1)
graph.zoom(-0.2) // 将画布缩放级别减少 0.2
graph.zoomTo(1.2) // 将画布缩放级别设置为 1.2
// 将画布中元素缩小或者放大一定级别,让画布正好容纳所有元素,可以通过 maxScale 配置最大缩放级别
graph.zoomToFit({ maxScale: 1 })
graph.centerContent() // 将画布中元素居中展示
节点渲染方式
X6 是基于 SVG 的渲染引擎,可以使用不同的 SVG 元素渲染节点和边,非常适合节点内容比较简单的场景。面对复杂的节点, SVG 中有一个特殊的 foreignObject 元素,在该元素中可以内嵌任何 XHTML 元素,可以借助该元素来渲染 HTML、React/Vue/Angular 组件到需要位置,这会给项目开发带来非常大的便利。
在选择渲染方式时我们推荐:
- 如果节点内容比较简单,而且需求比较固定,使用
SVG节点 - 其他场景,都推荐使用当前项目所使用的框架来渲染节点
添加节点
节点和边都有共同的基类 Cell,除了从 Cell 继承属性外,还支持以下选项。
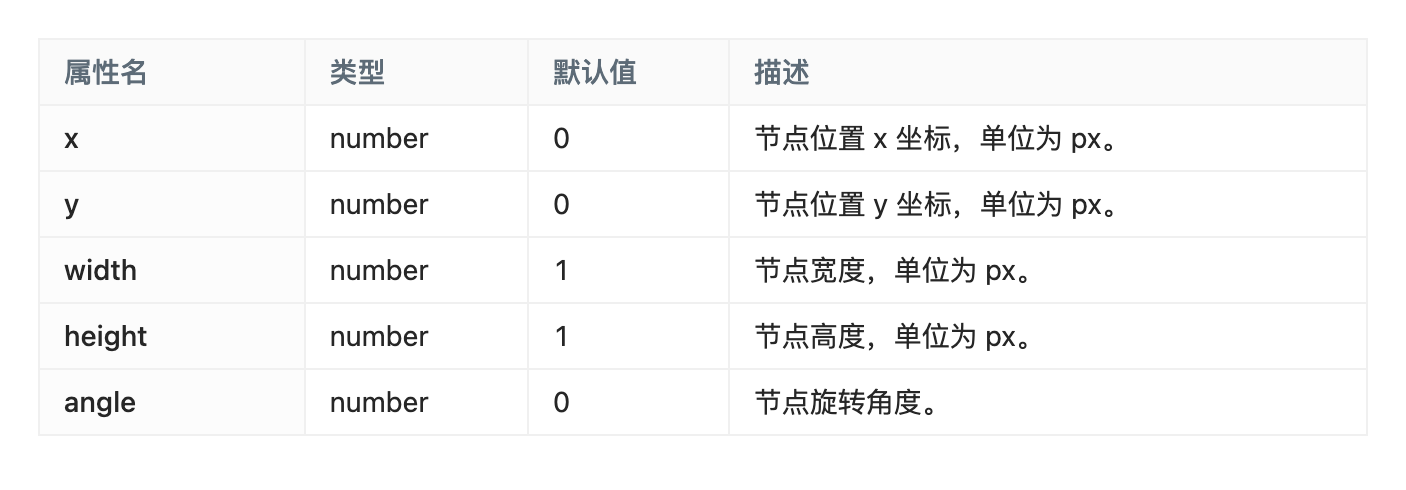
graph.addNode({
  shape: 'rect',
  x: 100,
  y: 40,
  width: 100,
  height: 40,
})
内置节点
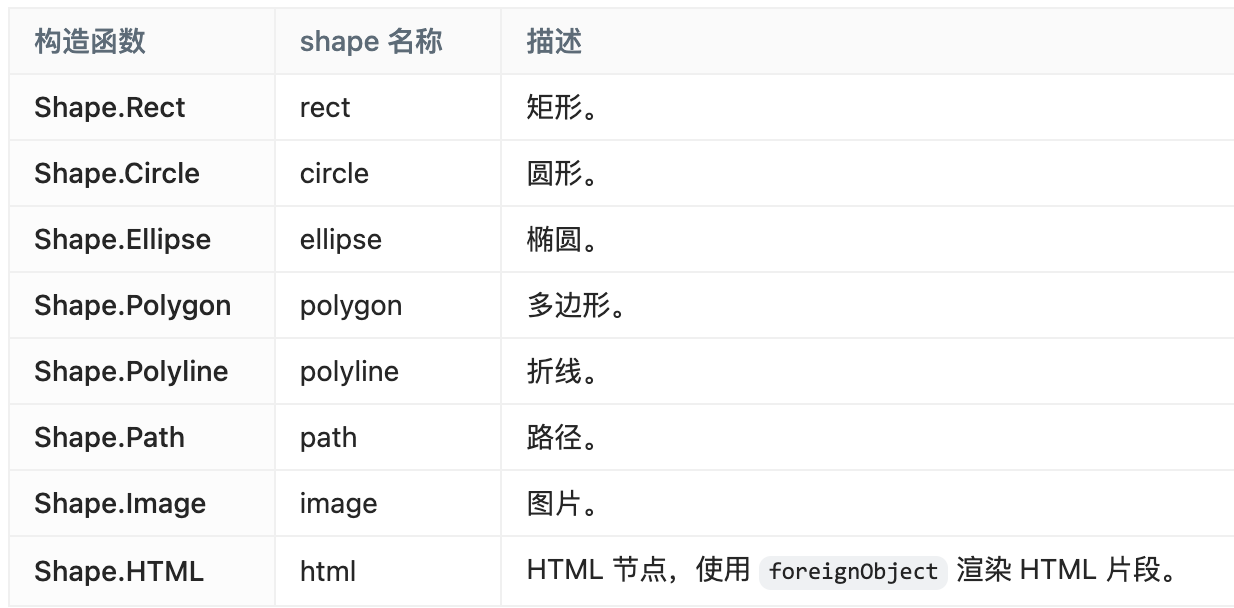
graph.addNode({
      shape: 'image',
      x: 290,
      y: 150,
      width: 60,
      height: 40,
      imageUrl:
        'https://gw.alipayobjects.com/os/s/prod/antv/assets/image/logo-with-text-73b8a.svg',
      label: 'image',
      attrs: commonAttrs,
    })
定制节点
我们可以通过 markup 和 attrs 来定制节点的形状和样式,markup 可以类比 HTML,attrs 类比 CSS。强烈建议仔细阅读 markup 和 attrs 文档。
Graph.registerNode(
  'custom-node',
  {
    inherit: 'rect', // 继承于 rect 节点
    width: 100,
    height: 40,
    markup: [
      {
        tagName: 'rect', // 标签名称
        selector: 'body', // 选择器
      },
      {
        tagName: 'image',
        selector: 'img',
      },
      {
        tagName: 'text',
        selector: 'label',
      },
    ],
    attrs: {
      body: {
        stroke: '#8f8f8f',
        strokeWidth: 1,
        fill: '#fff',
        rx: 6,
        ry: 6,
      },
      img: {
        'xlink:href':
          'https://gw.alipayobjects.com/zos/antfincdn/FLrTNDvlna/antv.png',
        width: 16,
        height: 16,
        x: 12,
        y: 12,
      },
    },
  },
  true,
)
  this.graph.addNode({
        shape: 'custom-node', // 可以直接使用上面注册过的 shape
        x: 40,
        y: 40,
        label: 'hello'
      })
修改节点
source.prop('size', { width: 120, height: 50 }) // 修改 x 坐标
source.attr('rect/fill', '#ccc') // 修改填充色,等价于 source.prop('attrs/rect/fill', '#ccc')
添加边
节点和边都有共同的基类 Cell,
graph.addEdge({
  shape: 'edge',
  source: 'node1',
  target: 'node2',
})


 浙公网安备 33010602011771号