
vue中添加echarts
方法一:全局引入echarts
步骤:
1、全局安装 echarts依赖。 cnpm install echarts -- save
2、引入echarts模块,在Vue项目的main.js中引入echarts模块,即是写入如下代码:
import echarts from 'echarts'
Vue.prototype.$echarts = echarts
3、在需要的组件,如index.vue中
<template>
<div class="echart-box" id="E_zkcl" style="width: 380px;
height:330px"></div>
</template>
<script>
export default {
data(){
return(){
}
},
methods: {
drawLine(){
let myChart1 = this.$echarts.init(document.getElementById('E_zkcl'))
}
myChart1.setOption({
color:['#4ED8DA'],
title : {
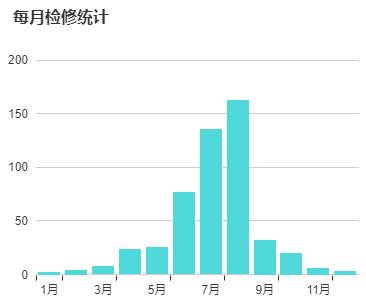
text: '每月检修统计',
x:15,
y:15,
textStyle:{
fontSize: 16,
fontWeight: 'bolder',
color: '#333'
}
},
tooltip : {
trigger: 'axis'
},
grid:{
borderWidth:0,
x:'10%',
y:'20%',
x2:'5%',
y2:'15%',
},
calculable : true,
xAxis : [
{
type : 'category',
axisLine:{
show:false,
},
splitLine:{
show:false, //不显示分割线
},
data: ['1月', '2月', '3月', '4月', '5月', '6月', '7月', '8月', '9月', '10月', '11月', '12月']
}
],
yAxis : [
{
type : 'value',
axisLine:{
show:false,
}
}
],
series : [
{
name:'数量',
type:'bar',
data:[2, 4, 7, 23, 25, 76, 135, 162, 32, 20, 6, 3],
}
]
});
//根据窗口的大小变动图表 --- 重点
window.onresize = function(){
myChart.resize();
//myChart1.resize(); //若有多个图表变动,可多写
}
},
         mounted(){
           this.drawLine();
            }

}
</script>
方法二:按需引入

 浙公网安备 33010602011771号