
matlab Plotting
linwidth
plot(t_nor,m60,'-o','LineWidth',2);
greek letter in plot label
ylabel ('\it \omega_x','fontsize' ,20,'fontname','Symbol');
side by side
code
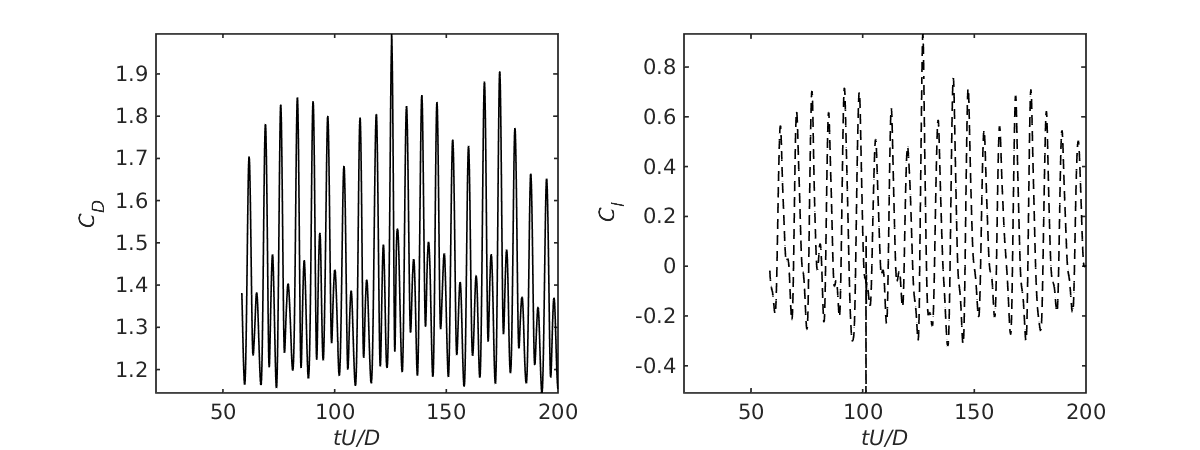
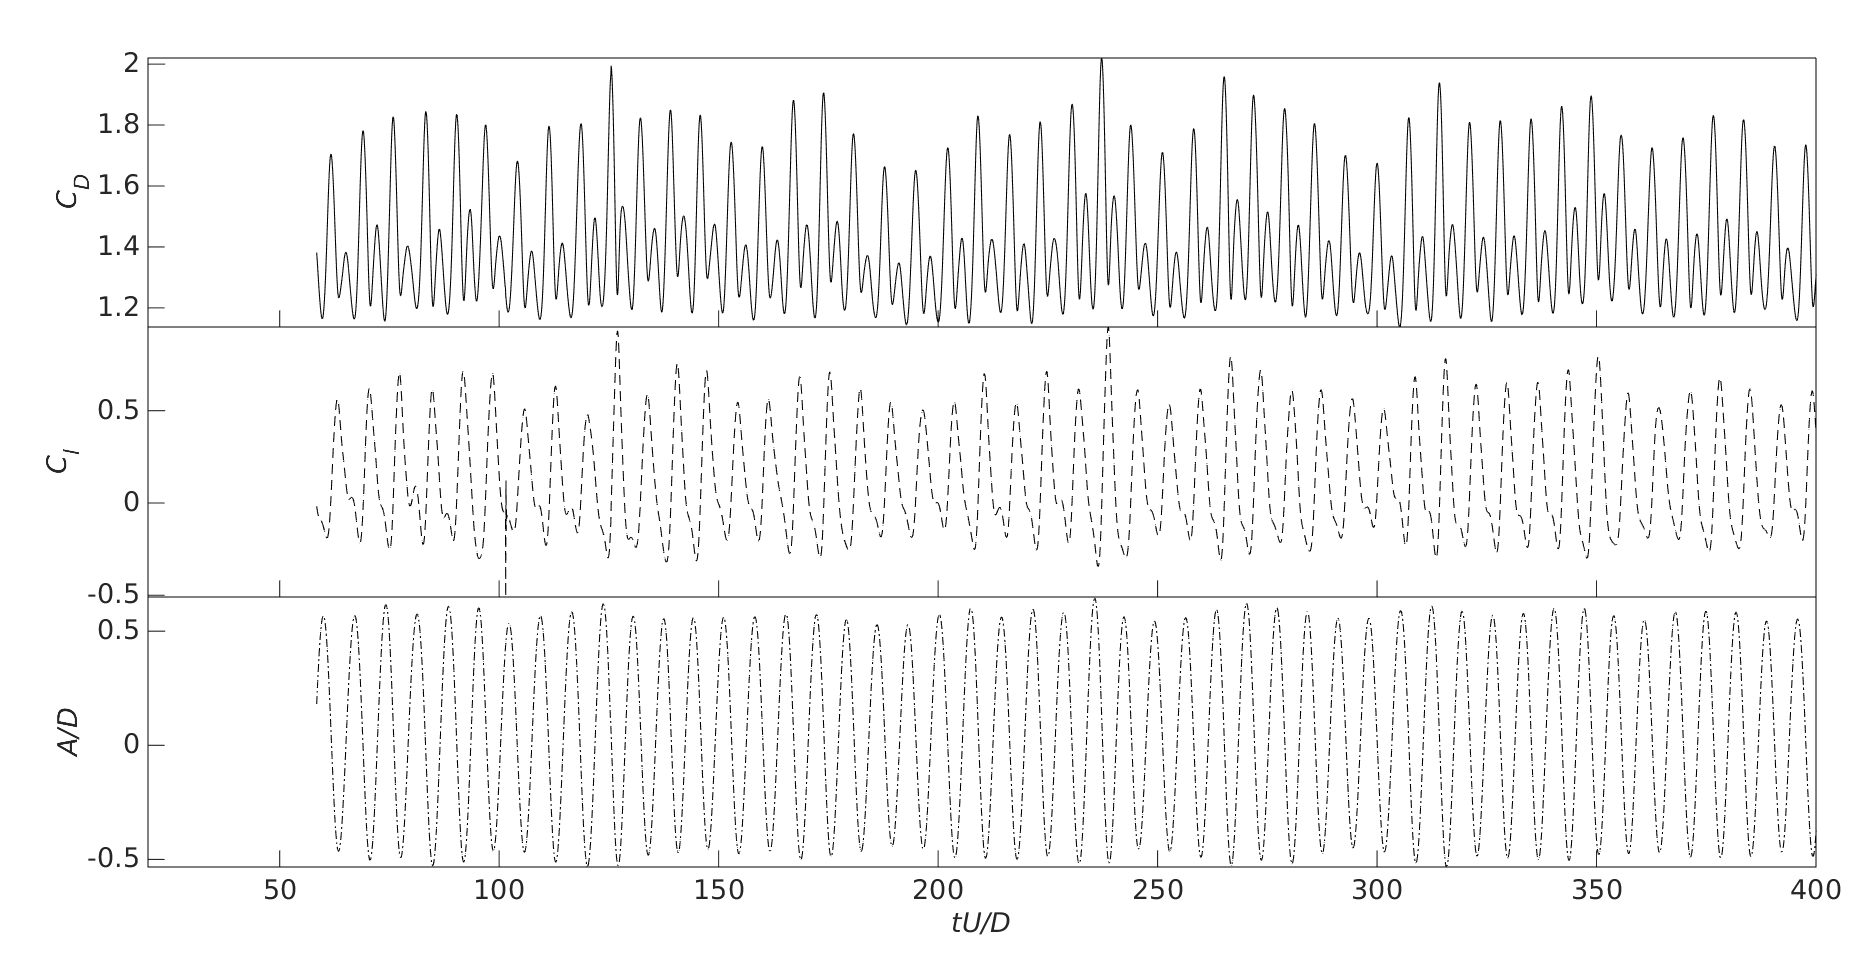
%%%%%%%%%%
% author: guiofei , kaiming HIT
%%%%%%%%%%%

clear;
clc;
%% read xls data
data=xlsread('gap1Ur8.xlsx');
A1=data(1000:10000,1);    % assign 1st column data to A1, time
A2=data(1000:10000,2);
A3=data(1000:10000,3);
A4=data(1000:10000,4);


U=1.1686;

%%%%%%%%%%%%%%%%%%%%%%%%%%%%%%%%%%%%%%%%%%%%%%%%
%% 1st figure-- C_D
%%%%%%%%%%%%%%%%%%%%%%%%%%%%%%%%%%%%%%%%%%%%%%%%
subplot(1,2,1)
% subplot(1,2,1, 'position', [0.08,0.1 0.4,0.85]) %     subplot('position',[left bottom width height]), normalized position
plot(A1*U/0.1,A4,'k-');  % black color, solid line
xlabel('\ittU/D','fontsize',10,'fontname','Times New Roman');
ylabel('\itC_{D}','fontsize',10,'fontname','Times New Roman');
axis([20,200,-inf,inf])

%%%%%%%%%%%%%%%%%%%%%%%%%%%%%%%%%%%%%%%%%%%%%%%%
%% 2st figure --% cl, lift coefficient
%%%%%%%%%%%%%%%%%%%%%%%%%%%%%%%%%%%%%%%%%%%%%%%%
subplot(1,2,2)
% subplot(1,2,2,'position', [0.53,0.1, 0.4,0.85])
plot(A1*U/0.1,A3,'k --');  % dashed line
xlabel('\ittU/D','fontsize',10,'fontname','Times New Roman');
ylabel('\itC_{l}','fontsize',10,'fontname','Times New Roman');
axis([20,200,-inf,inf])
%%%%%%%%%%%%%% -- save as .eps %%%%%%%%%%%%%%%%%
%% figure size
fig = gcf;
fig.PaperUnits = 'inches';
fig.PaperPosition = [0 0 8 3];
saveas(gcf, 'sidebyside','epsc') % current window, file-name, format
saveas(gcf, 'sidebyside','png')
saveas(gcf, 'sidebyside','svg')
Upper and Lower Subplots
input: gap1Ur8.xlsx
t	dis	cl 	cd
0.005	0	-0.05781	0
0.01	-3.00E-06	-0.03478	0.37145
0.015	-9.00E-06	-0.04407	0.28399
0.02	-2.00E-05	-0.03909	0.25275
0.025	-3.40E-05	-0.04029	0.24478
0.03	-5.20E-05	-0.03861	0.25036
0.035	-7.30E-05	-0.03803	0.26657
0.04	-9.70E-05	-0.0367	0.29228
output:
code:
%%%%%%%%%%
% author: guiofei HIT
%%%%%%%%%%%

clear;
clc;
%% read xls data
data=xlsread('gap1Ur8.xlsx');
A1=data(1000:10000,1);    % 1st column; rows(1e3, 1e4)
A2=data(1000:10000,2);
A3=data(1000:10000,3);
A4=data(1000:10000,4);
%%%%%%%%%%%%%%%%%%%%%%%%%%%%%%%%%%%%%%%%%%%%%%%%
%% 1st figure
%%%%%%%%%%%%%%%%%%%%%%%%%%%%%%%%%%%%%%%%%%%%%%%%

figure(1);
U=1.1686;
%%
fig_hei=0.28;  % height
fig_wei=0.9;   %  width
lef_cor_x=0.08;
lef_cor_y=0.1;
%% plot data
%cd, drag coeffcient
subplot(3,1,1,'position', [lef_cor_x lef_cor_y+fig_hei+fig_hei fig_wei fig_hei])
% 3 rows, 1 column,  1st subfigure [left bottom width height]
plot(A1*U/0.1,A4,'k-');  % black color, solid line
ylabel('\itC_{D}','fontsize',20,'fontname','Times New Roman');
set(gca,'fontsize',20,'fontname','Times New Roman')
axis([20,400,-inf,inf])
set(gca,'xticklabel',[])
box off
ax2 = axes('Position',get(gca,'Position'),...
           'XAxisLocation','top',...
           'YAxisLocation','right',...
           'Color','none',...
           'XColor','k','YColor','k');
set(ax2,'YTick', []);
set(ax2,'XTick', []);
box on
% cl, lift coefficient
subplot(3,1,2,'position', [lef_cor_x lef_cor_y+fig_hei fig_wei fig_hei])     % 2nd subfigure
plot(A1*U/0.1,A3,'k --');  % dashed line
ylabel('\itC_{l}','fontsize',20,'fontname','Times New Roman');
set(gca,'fontsize',20,'fontname','Times New Roman')
axis([20,400,-inf,inf])
set(gca,'xticklabel',[])
box off
ax2 = axes('Position',get(gca,'Position'),...
           'XAxisLocation','top',...
           'YAxisLocation','right',...
           'Color','none',...
           'XColor','k','YColor','k');
set(ax2,'YTick', []);
set(ax2,'XTick', []);
box on
%A/D
subplot(3,1,3,'position', [lef_cor_x lef_cor_y fig_wei fig_hei])   % 3rd subfigure
plot(A1*U/0.1,A2/0.1,'k -.');  % dashdot line
ylabel('\itA/D','fontsize',20,'fontname','Times New Roman');
xlabel('\ittU/D','fontsize',20,'fontname','Times New Roman');
set(gca,'fontsize',20,'fontname','Times New Roman')
axis([20,400,-inf,inf])
box off
ax2 = axes('Position',get(gca,'Position'),...
           'XAxisLocation','top',...
           'YAxisLocation','right',...
           'Color','none',...
           'XColor','k','YColor','k');
set(ax2,'YTick', []);
set(ax2,'XTick', []);
box on
4 figures side by side
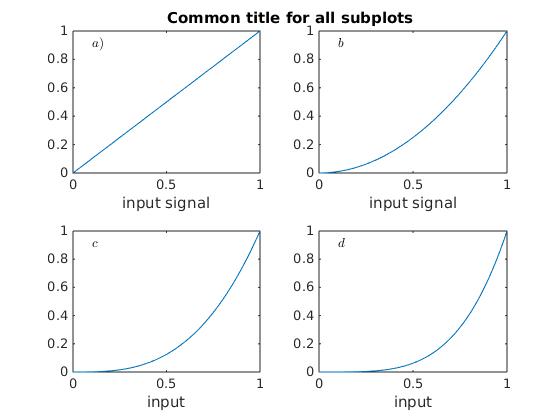
% 4 figures
x=linspace(0,1);
%%%%% subplot-1 %%%%%
subplot(2,2,1)
plot(x,x)
xlabel('input signal');
text(0.1,0.90,'$a)$', 'Interpreter', 'latex'); % x-position, y-position, 'text'
%%%%% subplot-2 %%%%%
subplot(2,2,2);
plot(x,x.^2);
xlabel('input signal');
text(0.1,0.90,'$b$', 'Interpreter', 'latex');
%%%%% subplot-3 %%%%%
subplot(2,2,3)
plot(x,x.^3);
xlabel('input');
text(0.1,0.90,'$c$', 'Interpreter', 'latex');
%%%%% subplot-4 %%%%%
subplot(2,2,4);
plot(x,x.^4);
xlabel('input');
text(0.1,0.90,'$d$', 'Interpreter', 'latex');
% Create a common title for all the subplots
set(gcf,'NextPlot','add');
axes;
set(gca,'Visible','off');
h = title('Common title for all subplots','fontweight','b');
set(h,'Visible','on');
3*3 plot with images as background
% 3*3 figures
clc;
clear;
img1 = imread('a.jpg');
img2 = imread('b.jpg');
img3 = imread('c.jpg');
img4 = imread('d.jpg');
img5 = imread('e.jpg');
img6 = imread('f.jpg');
img7 = imread('g.jpg');
img8 = imread('h.jpg');
x=linspace(0,10);
%%%%% subplot-1 %%%%%
subplot(3,3,1)
image([0 10], [0 4], flipud(img1));
%hold on;
%plot(x,x)
set(gca,'ydir','normal');
xlabel('input signal');
text(0.1,0.5,'$a)$', 'Interpreter', 'latex'); % 0.1 >> normalized position
%%%%% subplot-2 %%%%%
subplot(3,3,2);
imagesc([0 10], [0 4], flipud(img2));  % add image
%hold on;
%plot(x,x.^2);
% % set the y-axis back to normal.
set(gca,'ydir','normal');
xlabel('input signal');
text(0.1,0.5,'$b)$', 'Interpreter', 'latex');
%%%%% subplot-3 %%%%%
subplot(3,3,3)
imagesc([0 10], [0 4], flipud(img3));
%hold on;
%plot(x,x)
set(gca,'ydir','normal');
xlabel('input');
text(0.1,0.5,'$c)$', 'Interpreter', 'latex');
%%%%% subplot-4 %%%%%
subplot(3,3,4);
imagesc([0 10], [0 4], flipud(img4));
%hold on;
%plot(x,x)
set(gca,'ydir','normal');
%plot(x,x.^4);
xlabel('input');
text(0.1,0.5,'$d)$', 'Interpreter', 'latex');
%%%%% subplot-5 %%%%%
subplot(3,3,5);
imagesc([0 10], [0 4], flipud(img5));
%hold on;
%plot(x,x)
set(gca,'ydir','normal');
%plot(x,x.^5);
xlabel('input');
text(0.1,0.5,'$e)$', 'Interpreter', 'latex');
%%%%% subplot-6 %%%%%
subplot(3,3,6);
imagesc([0 10], [0 4], flipud(img6));
%hold on;
%plot(x,x)
set(gca,'ydir','normal');
%plot(x,x.^6);
xlabel('input');
text(0.1,0.5,'$f)$', 'Interpreter', 'latex');
%%%%% subplot-7 %%%%%
subplot(3,3,7);
imagesc([0 10], [0 4], flipud(img7));
%hold on;
%plot(x,x)
set(gca,'ydir','normal');
%plot(x,x.^7);
xlabel('input');
text(0.1,0.5,'$g)$', 'Interpreter', 'latex');
%%%%% subplot-8 %%%%%
subplot(3,3,8);
imagesc([0 10], [0 4], flipud(img8));
%hold on;
%plot(x,x)
set(gca,'ydir','normal');
%plot(x,3*x);
xlabel('input');
text(0.1,0.5,'$h)$', 'Interpreter', 'latex');
%%%%% subplot-9 %%%%%
subplot(3,3,9);
plot(x,2*x);
xlabel('input');
text(0.1, 0.5,'$i)$', 'Interpreter', 'latex');
% Create a common title for all the subplots
set(gcf,'NextPlot','add');
axes;
set(gca,'Visible','off');
h = title('Common title for all subplots','fontweight','b');
set(h,'Visible','on');
saveas(gcf, 'figure9','epsc');
saveas(gcf, 'figure9','png');
saveas(gcf, 'figure9','svg')

 浙公网安备 33010602011771号