
fit in gnuplot
Table of Contents
1 fit-gnuplot
syntax
>> fit [xrange][yrange] function 'datafile' using modifier via paprameterfile
example:
input: house_price.dat
###	'house_price.dat'
##	X-Axis:	House	price	(in	$1000)	-	Y-Axis:	Square	meters	(m^2)
245	426.72
312	601.68
279	518.16
308	571.5
199	335.28
219	472.44
405	716.28
324	546.76
319	534.34
255	518.16
gnuplot> # m, q will be our fitting parameters
gnuplot> f(x) = m*x + q
gnuplot> fit f(x) 'house_price.dat' using 1:2 via m, q
iter      chisq       delta/lim  lambda   m             q
   0 5.8376960560e+05   0.00e+00  2.07e+02    1.000000e+00   1.000000e+00
   1 1.6488461223e+04  -3.44e+06  2.07e+01    1.777346e+00   1.003262e+00
   2 1.5195558950e+04  -8.51e+03  2.07e+00    1.815976e+00   1.068562e+00
   3 1.4876544660e+04  -2.14e+03  2.07e-01    1.795915e+00   7.050054e+00
   4 1.3188280257e+04  -1.28e+04  2.07e-02    1.594141e+00   6.715403e+01
   5 1.3171060201e+04  -1.31e+02  2.07e-03    1.571627e+00   7.386063e+01
   6 1.3171060179e+04  -1.63e-04  2.07e-04    1.571602e+00   7.386812e+01
iter      chisq       delta/lim  lambda   m             q

After 6 iterations the fit converged.
final sum of squares of residuals : 13171.1
rel. change during last iteration : -1.62785e-09

degrees of freedom    (FIT_NDF)                        : 8
rms of residuals      (FIT_STDFIT) = sqrt(WSSR/ndf)    : 40.5756
variance of residuals (reduced chisquare) = WSSR/ndf   : 1646.38

Final set of parameters            Asymptotic Standard Error
=======================            ==========================
m               = 1.5716           +/- 0.2247       (14.3%)
q               = 73.8681          +/- 65.65        (88.87%)

correlation matrix of the fit parameters:
                m      q
m               1.000
q              -0.981  1.000
To save m, and q values in a string and plotting
set terminal postscript eps font 24
set out 'house_price_fit.eps'
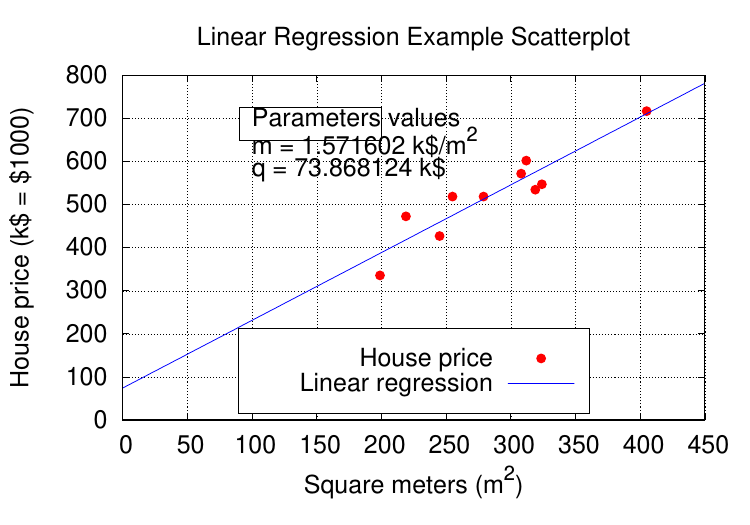
mq_value = sprintf("Parameters values\nm = %f k$/m^2\nq = %f k$", m, q)
# \n -->> next line
set title 'Linear Regression Example Scatterplot'
set ylabel 'House price (k$ = $1000)'
set xlabel 'Square meters (m^2)'
set style line 1 ps 1.5 pt 7 lc 'red'
set style line 2 lw 1.5 lc 'blue'
set grid
set key bottom center box height 1.4
set xrange [0:450]
set yrange [0:]
set object 1 rect from 90,725 to 200, 650 fc rgb "white"
set label 1 at 100,700 mq_value
print 'house_price.dat' ls 1 title 'House price', f(x) ls 2 title 'Linear regression'
set out
figures/gnuplot/fit/house_price_fit.pdf

 浙公网安备 33010602011771号