
1). 扑克牌手动演练k均值聚类过程:>30张牌,3类
2). *自主编写K-means算法 ,以鸢尾花花瓣长度数据做聚类,并用散点图显示。(加分题)
3). 用sklearn.cluster.KMeans,鸢尾花花瓣长度数据做聚类,并用散点图显示.
4). 鸢尾花完整数据做聚类并用散点图显示.
5).想想k均值算法中以用来做什么?
2、自主编写K-means算法 ,以鸢尾花花瓣长度数据做聚类,并用散点图显示
显示结果:
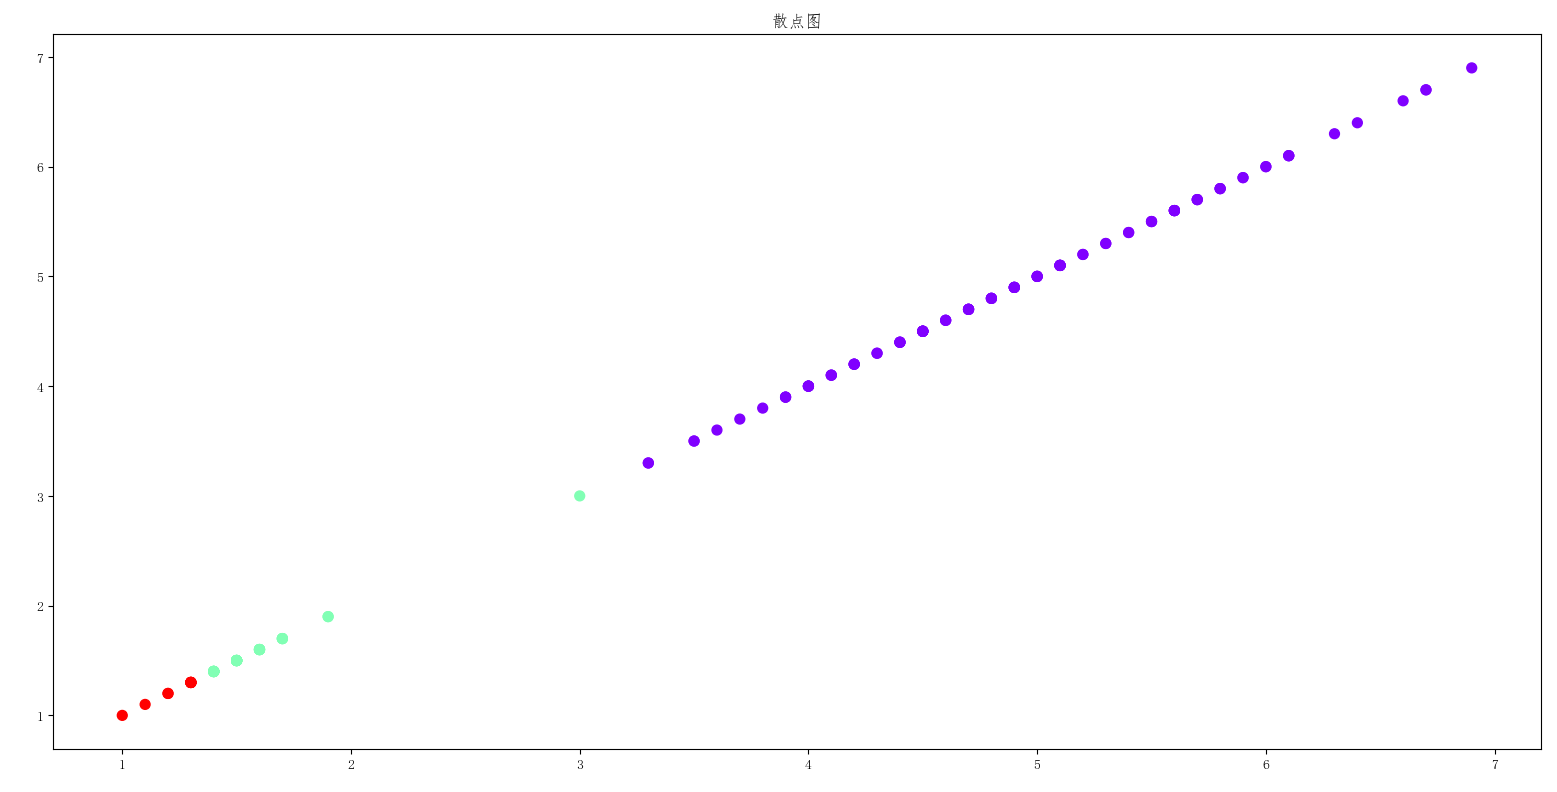
代码如下:
from sklearn.datasets import load_iris
import numpy as np
iris = load_iris()
x = iris.data[:, 2]  # 获取鸢尾花花瓣长度
n = len(x)
y=np.zeros(n)# 获取每个点到样本中心的距离
k=3
#初始聚类中心数组
def initcenter(x,k):
    return x[:k].reshape(k)
#数组中的值,与聚类中心最新距离所在类别的索引号
def nearest(kc,i):
    d = (abs(kc - i))
    w = np.where(d == np.min(d))
    return w[0][0]
#对数组的每个组分类
def xclassify(x,y,kc):
    for i in range(x.shape[0]):
        y[i]=nearest(kc,x[i])
    return y
kc=initcenter(x,k)
y=xclassify(x,y,kc)
print(kc,y)
#计算各聚类新均值
def kcmean(x,y,kc,k):
    l = list(kc)
    flag = False
    for c in range(k):
        m = np.where(y == c)
        n=np.mean(x[m])
        if m[0].shape != (0,):
            n = np.mean(x[m])
        if l[c] != n:
            l[c] = n
            flag = True
        return (np.array(l),flag)

k = 3
kc = initcenter(x,k)
flag = True
print(x,y,kc,flag)
while flag:
    y = xclassify(x,y,kc)
    kc,flag = kcmean(x, y, kc, k)
print(y,kc)
print(x,y)
import matplotlib.pyplot as plt
from pylab import mpl
mpl.rcParams['font.sans-serif'] = ['FangSong'] # 指定默认字体
plt.scatter(x,x,c=y,s=50,cmap='rainbow')
plt.title("散点图")
plt.show()
3、用sklearn.cluster.KMeans,鸢尾花花瓣长度数据做聚类,并用散点图显示.
显示结果:
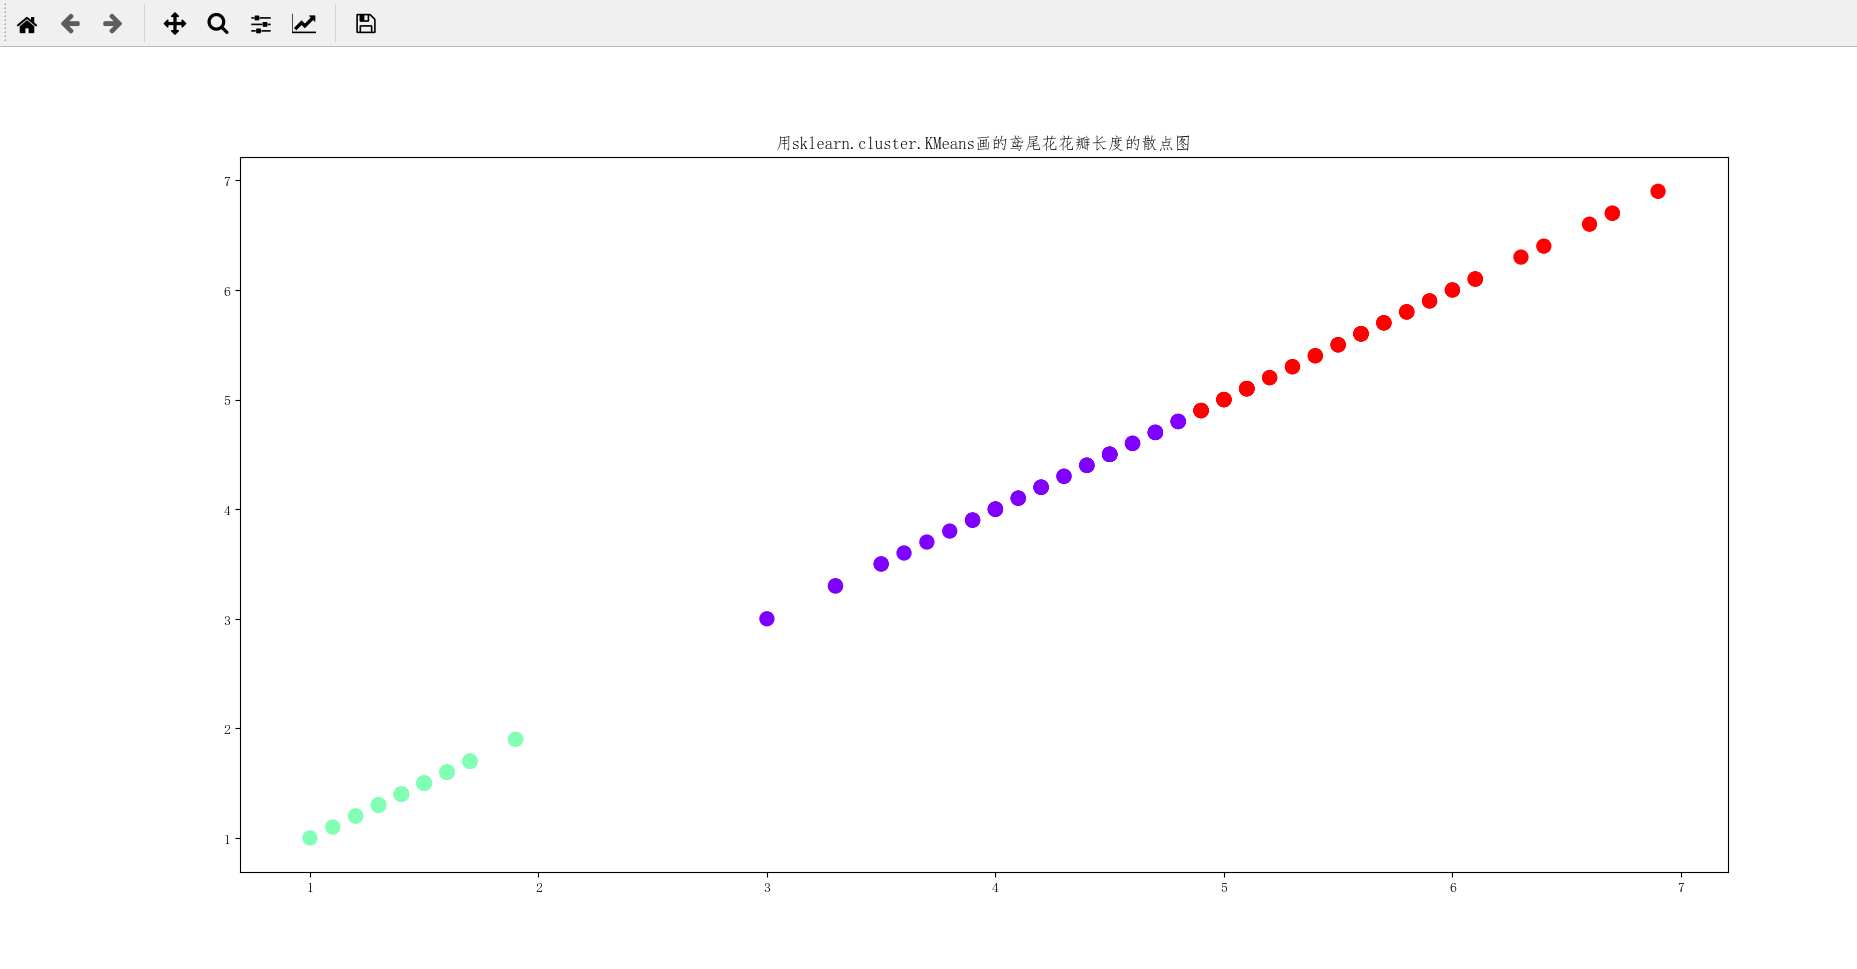
代码如下:
from sklearn.datasets import load_iris

iris=load_iris()
S1=iris.data[:,2]
X=S1.reshape(-1,1)

import matplotlib.pyplot as plt
from sklearn.cluster import KMeans
from pylab import mpl
import numpy as np
mpl.rcParams['font.sans-serif'] = ['FangSong'] # 指定默认字体
est=KMeans(n_clusters=3)#将其类别分为3类
est.fit(X)
kc=est.cluster_centers_
y_kmeans=est.predict(X)#预测每个样本的聚类索引

plt.scatter(X[:,0],X[:,0],c=y_kmeans,s=50,cmap='rainbow')
plt.title("用sklearn.cluster.KMeans画的鸢尾花花瓣长度的散点图")
plt.show()
4、鸢尾花完整数据做聚类并用散点图显示.
显示结果:
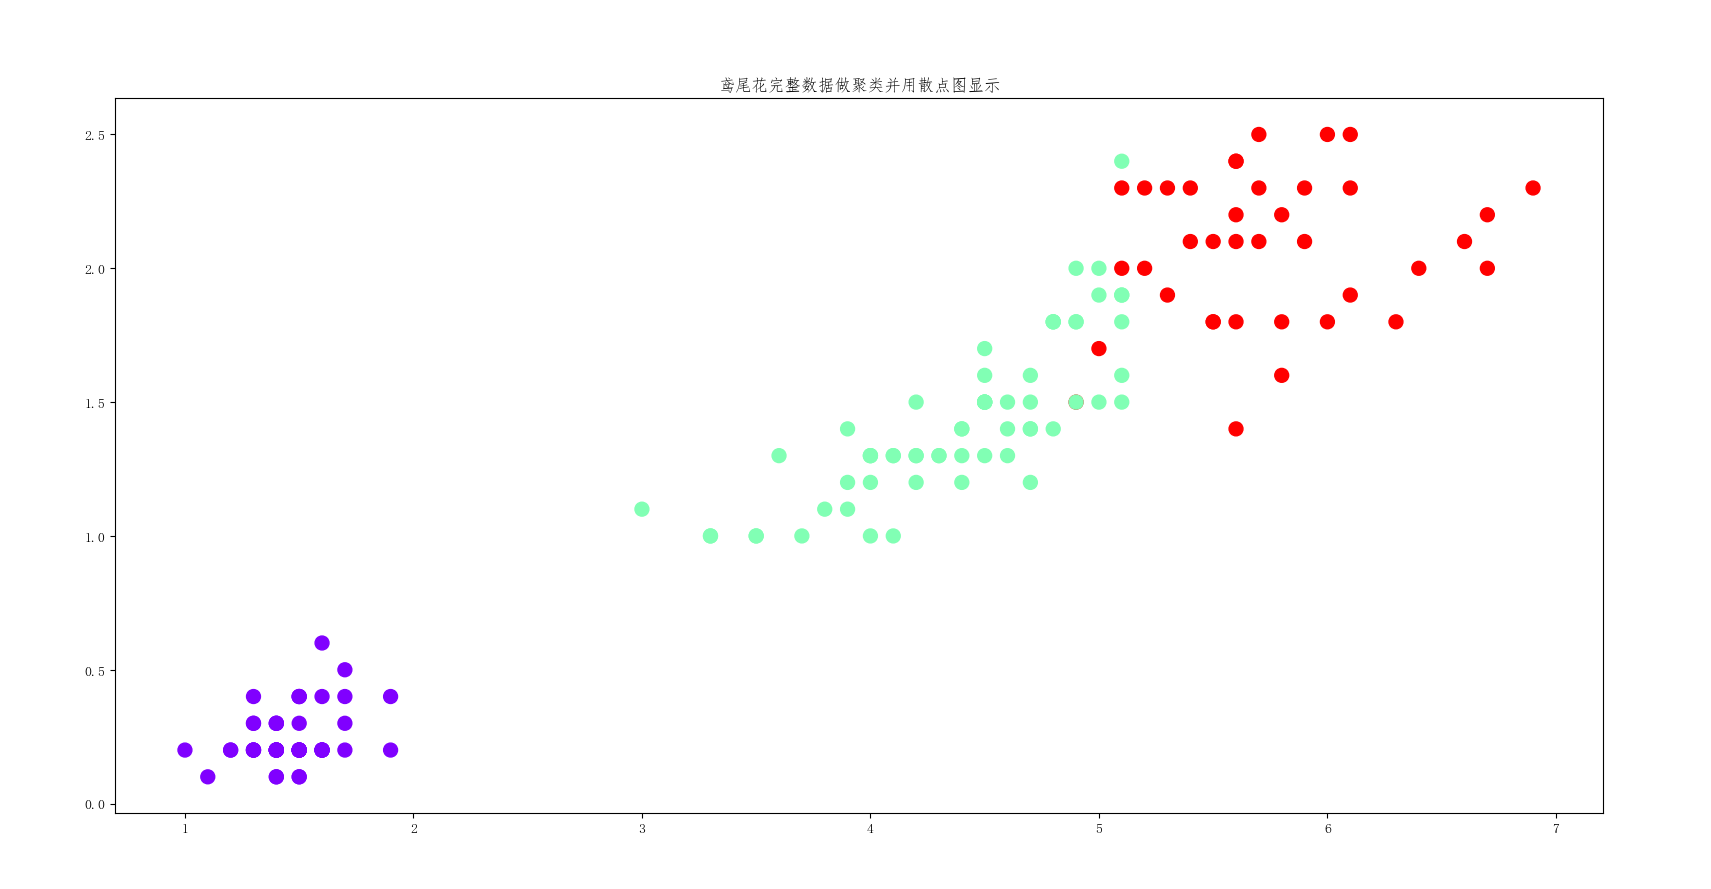
代码如下:
from sklearn.datasets import load_iris

iris=load_iris()
X=iris.data


import matplotlib.pyplot as plt
from sklearn.cluster import KMeans
from pylab import mpl
import numpy as np
mpl.rcParams['font.sans-serif'] = ['FangSong'] # 指定默认字体
est=KMeans(n_clusters=3)#将其类别分为3类
est.fit(X)
kc=est.cluster_centers_
y_kmeans=est.predict(X)#预测每个样本的聚类索引

plt.scatter(X[:,2],X[:,3],c=y_kmeans,s=100,cmap='rainbow')
plt.title("鸢尾花完整数据做聚类并用散点图显示")
plt.show()
5、想想k均值算法中以用来做什么?
我觉得可以为医学做贡献,分类病毒类型等等,在很多的行业都可以用上。

 浙公网安备 33010602011771号