一、Hystrix的监控平台
除了实现容错功能,Hystrix还提供了近乎实时的监控,HystrixCommand和HystrixObservableCommand在执行时,会生成执行结果和运行指标。比如每秒的请求数量,成功数量等。这些状态会暴露在Actuator提供的/health端点中。只需为项目添加spring-boot-actuator 依赖,重启项目,访问http://localhost:9003/actuator/hystrix.stream ,即可看到实时的监控数据。
1、引入actuator
2、启动类添加@EnableCircuitBreaker
3、添加配置暴漏所有监控断点
management:
  endpoints:
    web:
      exposure:
        include: '*'
效果图:
二、搭建Hystrix DashBoard监控
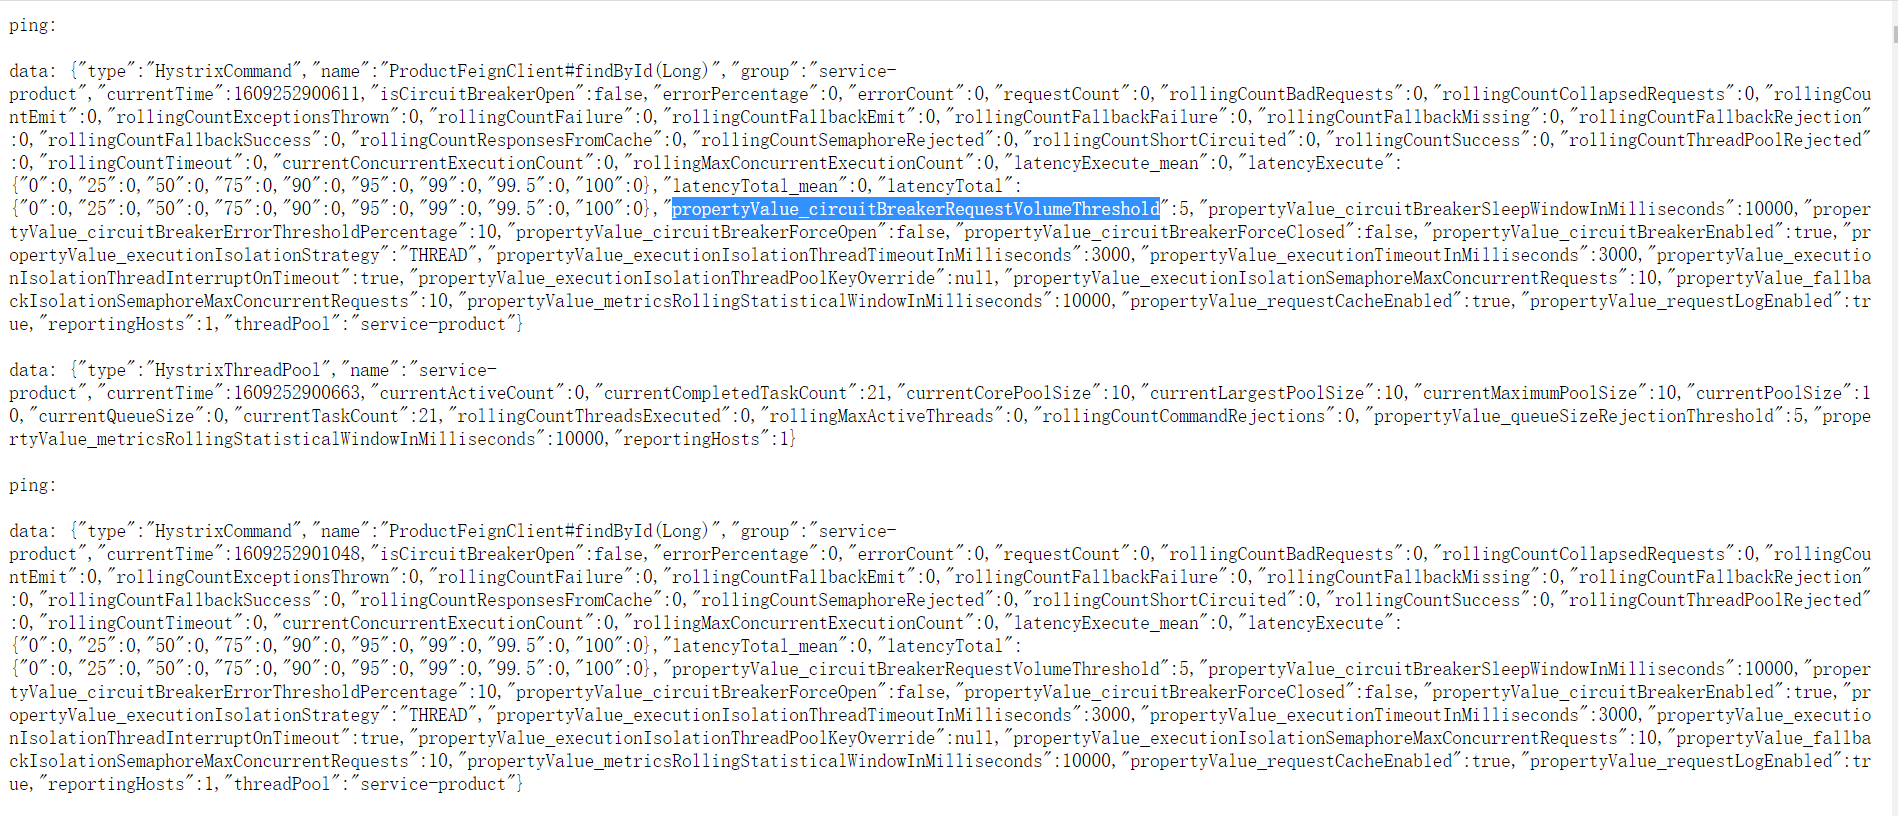
访问/hystrix.stream接口获取的都是已文字形式展示的信息。很难通过文字直观的展示系统的运行状态,所以Hystrix官方还提供了基于图形化的DashBoard(仪表板)监控平台。Hystrix仪表板可以显示每个断路器(被@HystrixCommand注解的方法)的状态。
1、导入依赖
        <dependency>
            <groupId>org.springframework.boot</groupId>
            <artifactId>spring-boot-starter-actuator</artifactId>
        </dependency>
        <dependency>
            <groupId>org.springframework.cloud</groupId>
            <artifactId>spring-cloud-starter-netflix-hystrix</artifactId>
        </dependency>
        <dependency>
            <groupId>org.springframework.cloud</groupId>
            <artifactId>spring-cloud-starter-netflix-hystrix-dashboard</artifactId>
        </dependency>
2、添加@EnableHystrixDashboard
在启动类使用@EnableHystrixDashboard注解激活仪表盘项目
3、访问测试
http://192.168.1.101:9003/hystrix
输入stream:http://localhost:9003/actuator/hystrix.stream,点击monitor stream即可看到监控结果

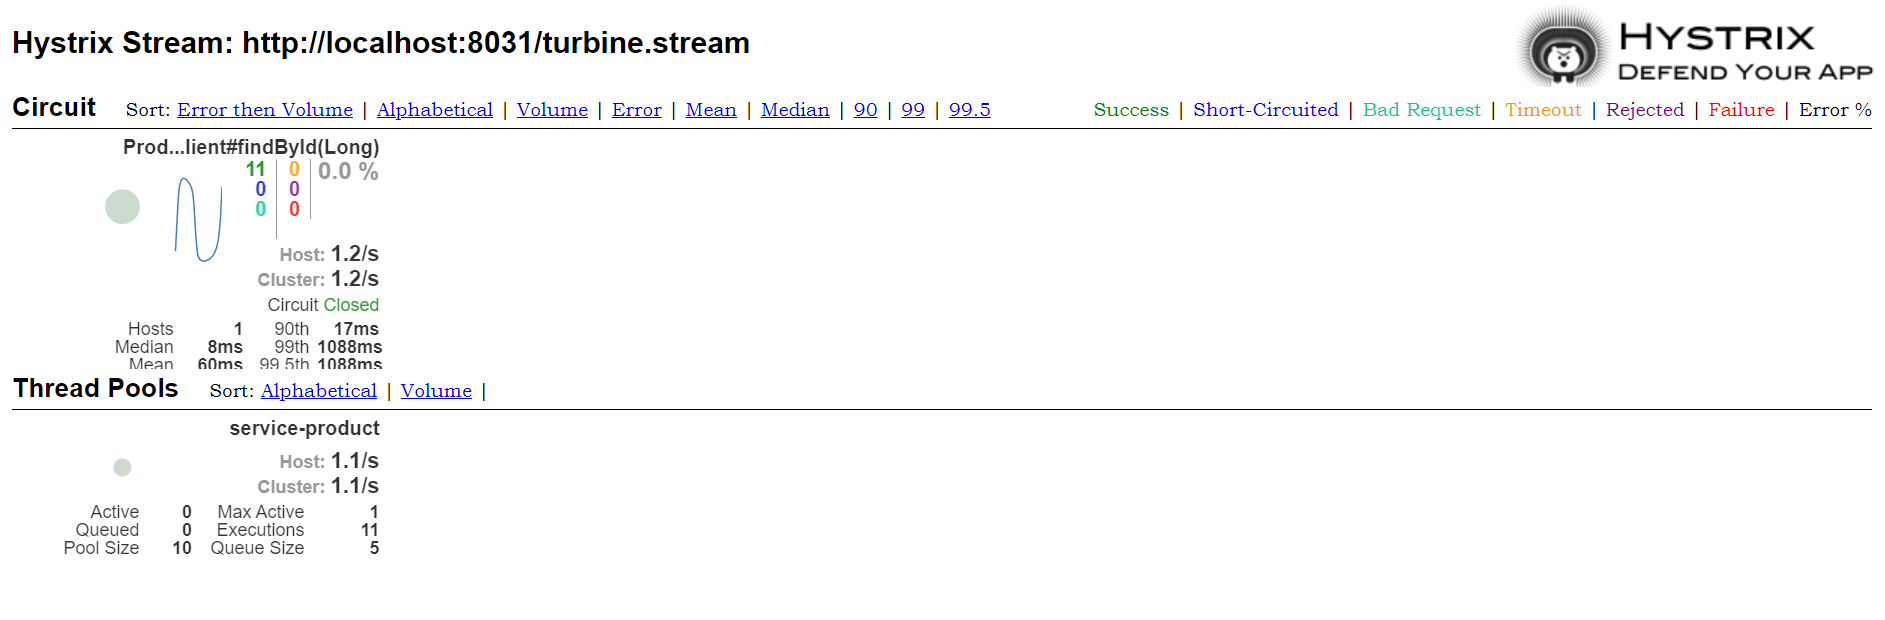
4.0%代表失败率,host:2.4/s代表请求频率,circuit:closed代表熔断器状态
三、断路器聚合监控Turbine
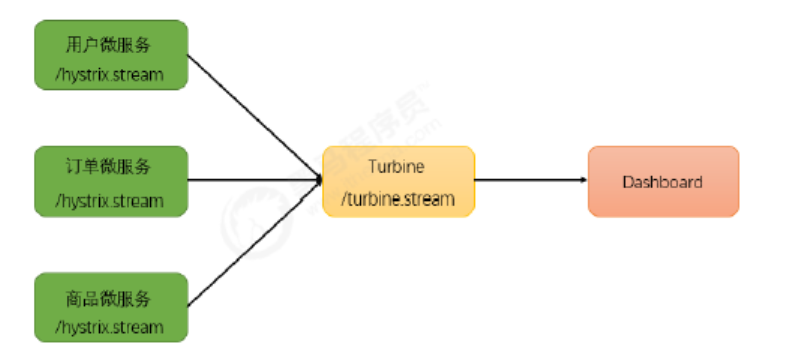
在微服务架构体系中,每个服务都需要配置Hystrix DashBoard监控。如果每次只能查看单个实例的监控数据,就需要不断切换监控地址,这显然很不方便。要想看这个系统的Hystrix Dashboard数据就需要用到Hystrix Turbine。Turbine是一个聚合Hystrix 监控数据的工具,他可以将所有相关微服务的Hystrix 监控数据聚合到一起,方便使用。引入Turbine后,整个监控系统架构如下:
搭建TurbineServer
1、引入相关坐标
        <dependency>
            <groupId>org.springframework.cloud</groupId>
            <artifactId>spring-cloud-starter-netflix-turbine</artifactId>
        </dependency>
        <dependency>
            <groupId>org.springframework.cloud</groupId>
            <artifactId>spring-cloud-starter-netflix-hystrix</artifactId>
        </dependency>
        <dependency>
            <groupId>org.springframework.cloud</groupId>
            <artifactId>spring-cloud-starter-netflix-hystrix-dashboard</artifactId>
        </dependency>
2、配置多个微服务的hystrix监控
在application.yml的配置文件中开启turbine并进行相关配置
turbine:
  # 要监控的微服务列表,多个用,分隔
  appConfig: service-order
  clusterNameExpression: "'default'"
turbine会自动的从注册中心中获取需要监控的微服务,并聚合所有微服务中的/hystrix.stream 数据
3、配置启动类
@SpringBootApplication
//trubin配置
@EnableTurbine
@EnableHystrixDashboard
public class TurbinAppliation {
    public static void main(String[] args) {
        SpringApplication.run(TurbinAppliation.class,args);
    }
}
作为一个独立的监控项目,需要配置启动类,开启HystrixDashboard监控平台,并激活Turbine
4、测试
浏览器访问http://localhost:8031/hystrix 展示HystrixDashboard。并在url位置输入 http://localhost:8031/turbine.stream,动态根据turbine.stream数据展示多个微服务的监控数据