
实用指南:多粒子模型--交通堵塞2
目录
书接上回
新增功能说明:
红绿灯参数设置:
light_pos:红绿灯在道路上的位置(元胞编号)green_duration:绿灯持续时间(单位:时间步)red_duration:红灯持续时间(单位:时间步)- 红绿灯按周期(绿 + 红)自动切换
红绿灯对车辆的影响:
- 绿灯时:车辆可正常利用红绿灯位置
- 红灯时:
- 禁止车辆进入红绿灯所在元胞
- 已凭借红绿灯的车辆可继续行驶
- 未通过的车辆需在红绿灯前等待(强制减速至停止)
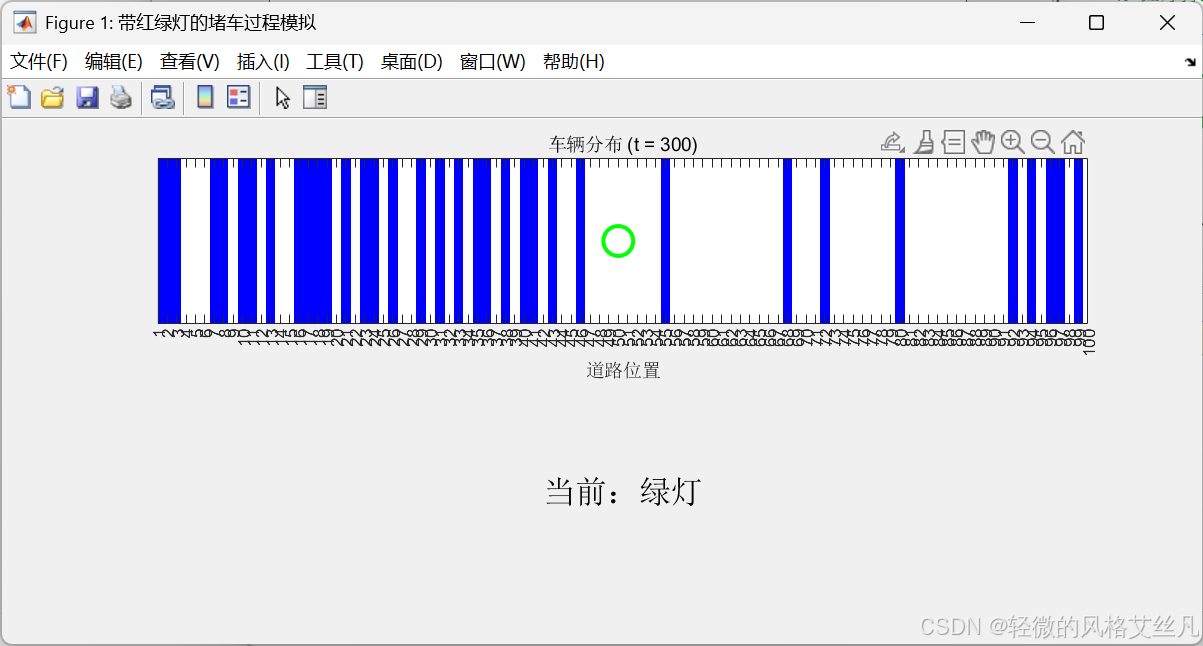
可视化增强:
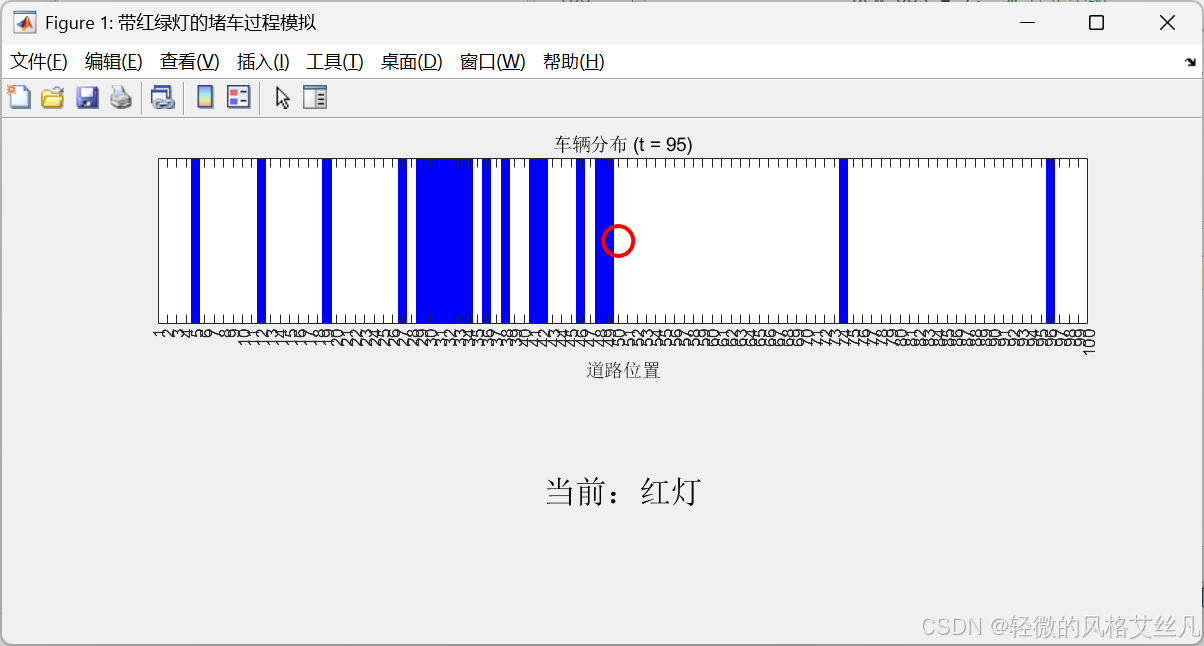
- 动画中用绿色圆圈标记绿灯,红色圆圈标记红灯位置
- 新增红绿灯状态显示区域(浅绿色背景 = 绿灯,浅红色 = 红灯)
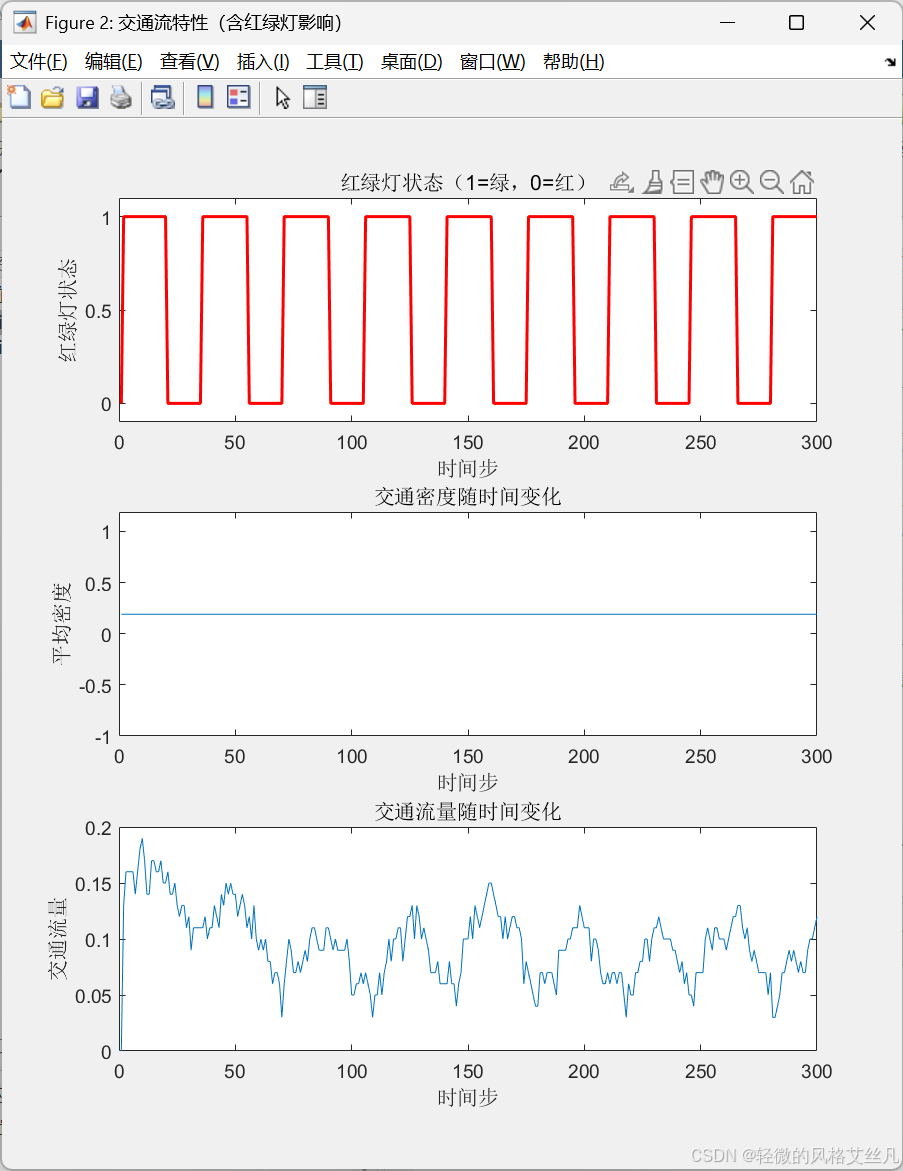
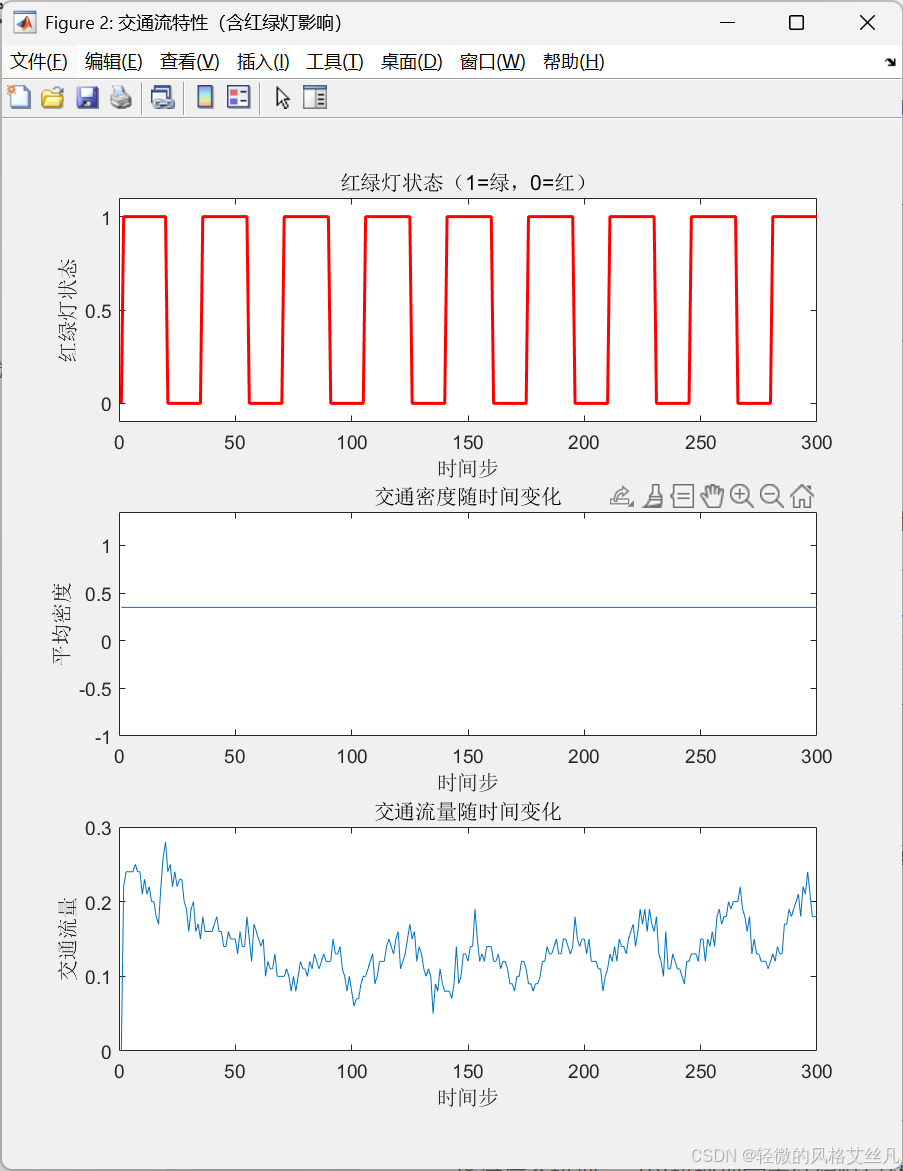
- 分析图中增加红绿灯状态曲线,可直观观察红绿灯与交通流的关联
交通流特性变化:
- 红灯时会导致红绿灯前车辆聚集(密度升高)
- 绿灯亮起后会形成 “释放波”,流量短暂激增
- 整体交通流呈现周期性波动(与红绿灯周期同步)
可调整的参数实验:
对照
实验1
改变green_duration和red_duration,观察不同配时对拥堵的影响.
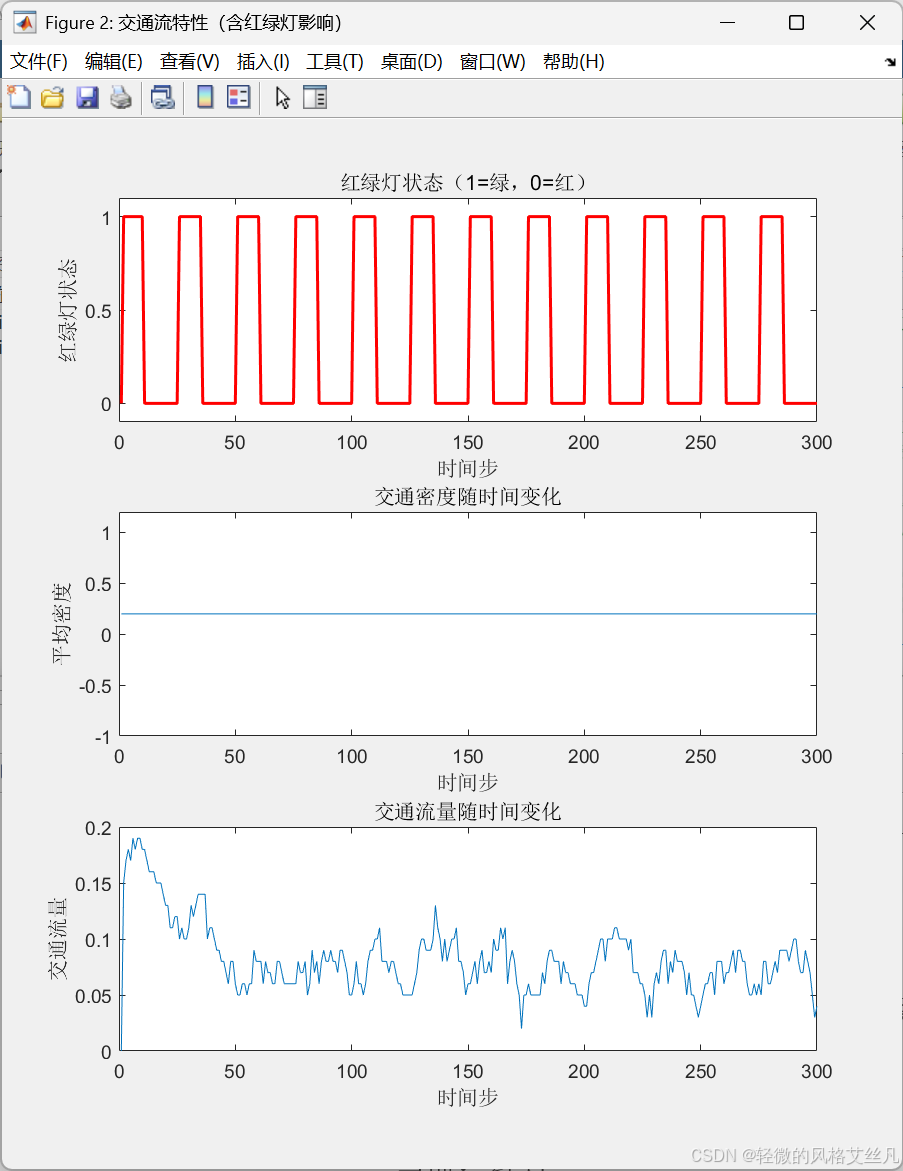
减少绿灯时间后,交通流量变少。
实验2
调整light_pos,测试红绿灯位置对整体交通流的影响
除最开始有些许区别,其他与对照组一致。
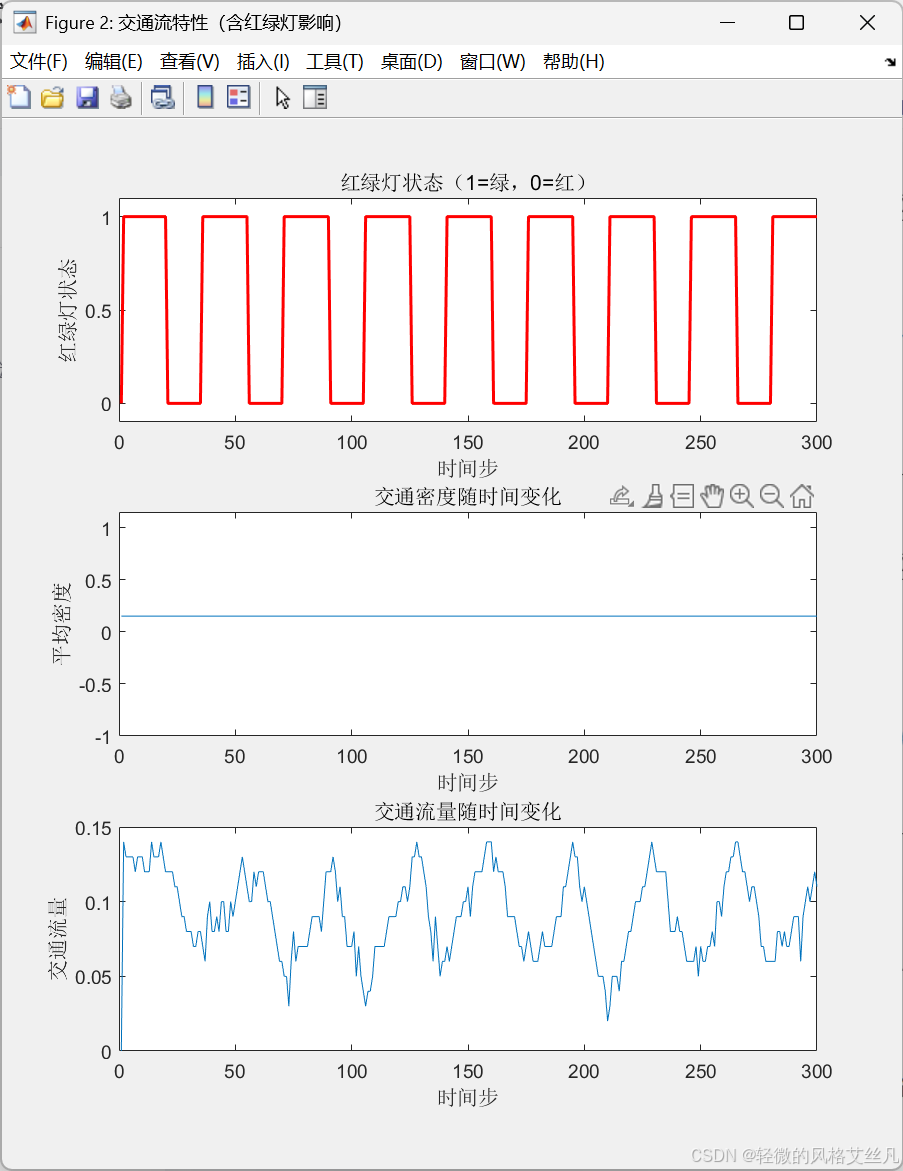
实验3
增大rho(初始密度),观察红绿灯前的拥堵程度变化
增大密度后行发现红灯前持续有拥堵现象。
通过依据这个模型,能够模拟现实中红绿灯导致的 “周期性拥堵” 现象,以及绿灯亮起后车辆逐步疏散的过程。
源码
% 带红绿灯的堵车过程模拟(基于元胞自动机模型)
clear; clc; close all;
%% 参数设置
L = 100; % 道路长度(元胞数)
T = 300; % 模拟时间步数
v_max = 5; % 最大车速
p_slow = 0.3; % 随机减速概率
rho = 0.3; % 初始车辆密度
light_pos = 50; % 红绿灯位置(道路上的元胞编号)
green_duration = 20; % 绿灯持续时间(时间步)
red_duration = 15; % 红灯持续时间(时间步)
%% 初始化
% 随机生成初始车辆位置(1表示有车,0表示无车)
road = rand(L, 1) < rho;
% 初始化车辆速度(0到v_max之间随机)
velocity = zeros(L, 1);
for i = 1:L
if road(i)
velocity(i) = randi(v_max);
end
end
% 存储每一步的道路状态和红绿灯状态
history = zeros(L, T);
history(:, 1) = road;
light_history = zeros(1, T); % 1=绿灯,0=红灯
%% 模拟主循环
for t = 2:T
% 1. 确定当前红绿灯状态(周期性切换)
cycle = green_duration + red_duration; % 红绿灯周期
t_in_cycle = mod(t-1, cycle); % 当前在周期中的位置(从0开始)
if t_in_cycle < green_duration
light_state = 1; % 绿灯
else
light_state = 0; % 红灯
end
light_history(t) = light_state;
% 2. 计算每辆车前方的空元胞数(与前车的距离,考虑红绿灯)
distance = zeros(L, 1);
for i = 1:L
if road(i)
d = 0;
j = i + 1;
while true
if j > L
j = 1; % 周期性边界条件
end
% 遇到红灯时,需在红绿灯前停车
red_light_stop = (light_state == 0) && (j == light_pos);
if road(j) || red_light_stop
break; % 遇到前车或红灯,停止计数
end
d = d + 1;
j = j + 1;
if d >= v_max % 超过最大车速时无需继续计算
break;
end
end
distance(i) = d;
end
end
% 3. 加速
for i = 1:L
if road(i)
velocity(i) = min(velocity(i) + 1, v_max);
end
end
% 4. 避免碰撞(根据前车距离减速)
for i = 1:L
if road(i)
velocity(i) = min(velocity(i), distance(i));
end
end
% 5. 随机减速
for i = 1:L
if road(i) && velocity(i) > 0
if rand < p_slow
velocity(i) = velocity(i) - 1;
end
end
end
% 6. 车辆移动(考虑红绿灯限制:红灯时不能进入红绿灯位置)
new_road = zeros(L, 1);
new_velocity = zeros(L, 1);
for i = 1:L
if road(i)
% 计算新位置(考虑周期性边界)
new_pos = i + velocity(i);
while new_pos > L
new_pos = new_pos - L;
end
% 红灯时,禁止进入红绿灯位置(允许离开)
if light_state == 0 && new_pos == light_pos
% 红灯时若要进入红绿灯位置,强制停在当前位置前
new_pos = i; % 停止不动
new_velocity(new_pos) = 0; % 速度归零
else
new_velocity(new_pos) = velocity(i);
end
new_road(new_pos) = 1;
end
end
% 更新状态
road = new_road;
velocity = new_velocity;
history(:, t) = road;
end
%% 动画展示(含红绿灯状态)
figure('Name', '带红绿灯的堵车过程模拟', 'Position', [100, 100, 800, 350]);
for t = 1:T
clf;
% 绘制道路和车辆
subplot(2,1,1);
imagesc(history(:, t)', [0, 1]);
colormap([1 1 1; 0 0 1]); % 白色=无车,蓝色=有车
axis xy;
xlim([1, L]);
ylim([0.5, 1.5]);
set(gca, 'YTick', [], 'XTick', 1:L);
xlabel('道路位置');
title(['车辆分布 (t = ', num2str(t), ')']);
% 标记红绿灯位置
hold on;
if light_history(t) == 1
plot(light_pos, 1, 'og', 'MarkerSize', 15, 'LineWidth', 2); % 绿灯
else
plot(light_pos, 1, 'or', 'MarkerSize', 15, 'LineWidth', 2); % 红灯
end
hold off;
% 显示当前红绿灯状态
subplot(2,1,2);
if light_history(t) == 1
text(0.5, 0.5, '当前:绿灯', 'FontSize', 16, 'HorizontalAlignment', 'center');
set(gca, 'Color', [0.9 1 0.9]); % 浅绿色背景
else
text(0.5, 0.5, '当前:红灯', 'FontSize', 16, 'HorizontalAlignment', 'center');
set(gca, 'Color', [1 0.9 0.9]); % 浅红色背景
end
axis off;
drawnow;
pause(0.05);
end
%% 交通流参数分析
flow = zeros(1, T);
for t = 2:T
moved = sum(history(:, t) & ~history(:, t-1));
flow(t) = moved / L;
end
figure('Name', '交通流特性(含红绿灯影响)');
subplot(3,1,1);
plot(1:T, light_history, 'r-', 'LineWidth', 1.5);
ylim([-0.1, 1.1]);
xlabel('时间步');
ylabel('红绿灯状态');
title('红绿灯状态(1=绿,0=红)');
subplot(3,1,2);
plot(1:T, mean(history, 1));
xlabel('时间步');
ylabel('平均密度');
title('交通密度随时间变化');
subplot(3,1,3);
plot(1:T, flow);
xlabel('时间步');
ylabel('交通流量');
title('交通流量随时间变化');
set(gcf, 'Position', [200, 200, 600, 700]);
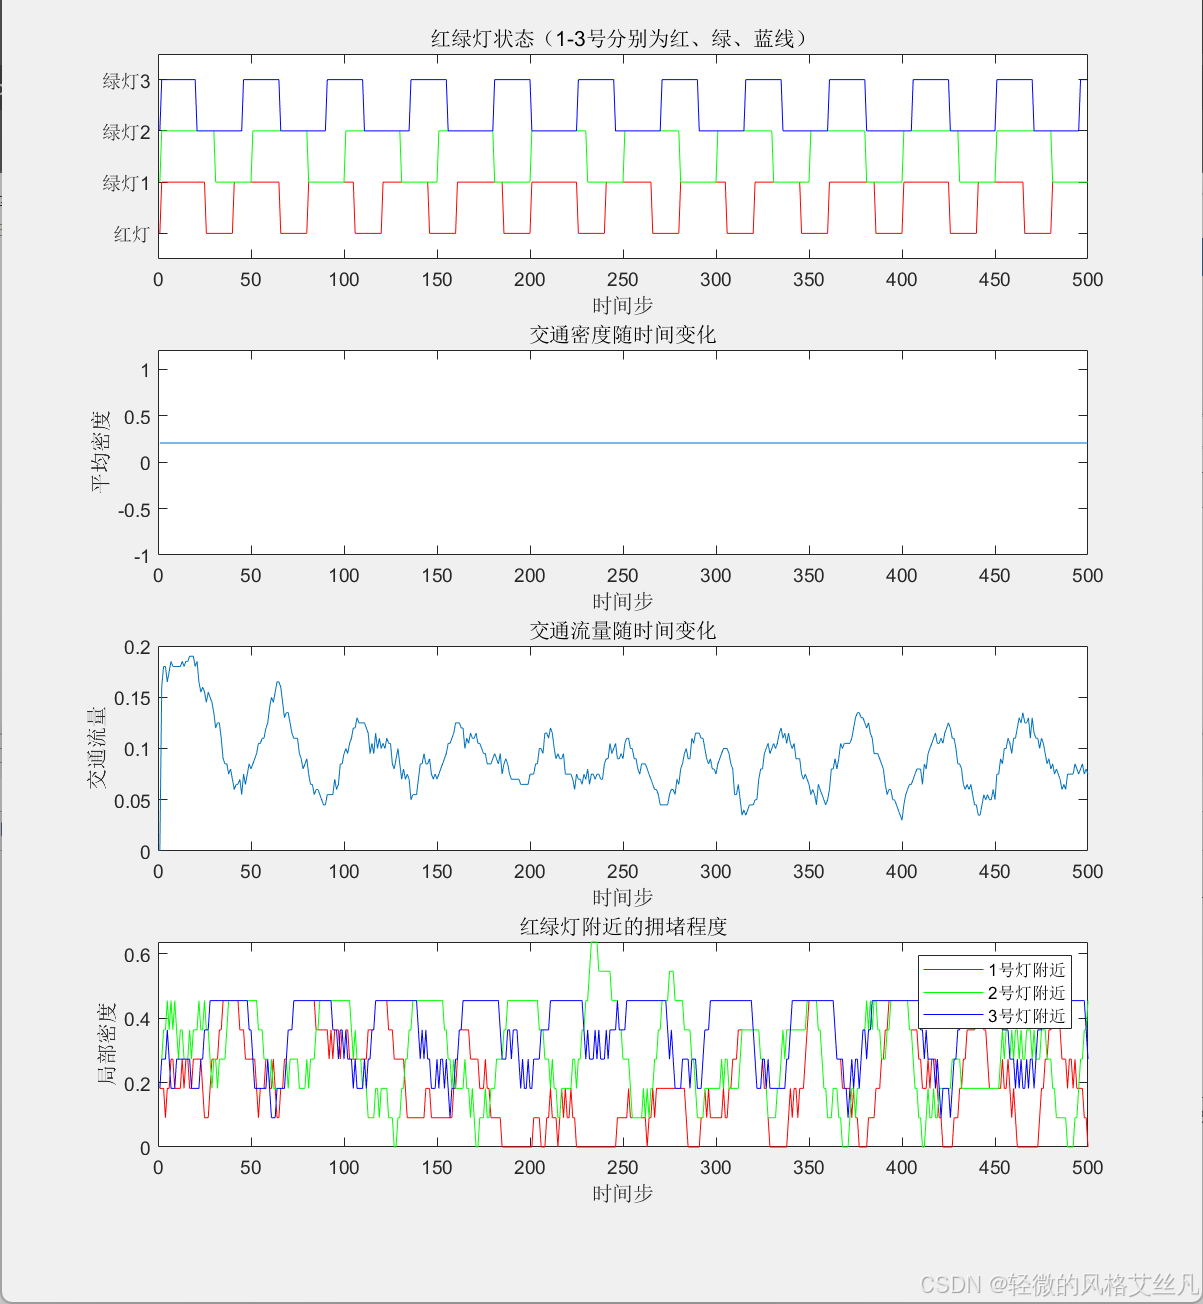
drawnow;扩展
长路段多红绿灯的模型。模型

 浙公网安备 33010602011771号