
新能源汽车故障诊断内容集
该数据集旨在用于新能源车辆(NEV)的故障诊断,特别关注于识别和分类驱动系统中的故障。它包括从车辆系统中嵌入的各种传感器收集的数据,如电压、电流、电机速度、温度、振动、环境温度和湿度。数据集包括正常运行数据以及反映电机、逆变器和电池等关键部件故障的数据。该数据集旨在用于训练和测试深度学习模型,特别是开发先进的故障检测系统,以提高电动汽车的安全性和可靠性。
数据集是平衡的,类标签表示正常操作(标签0)和不同类型的故障(标签1-3)。
引言
在本notebook中,我们将分析与新能源汽车故障诊断相关的数据集。数据集包含各种传感器读数,如电压、电流、电机速度、温度、振动、环境温度和湿度,以及指示是否存在故障的故障标签。
我们的目标是探索数据,进行必要的预处理,并建立一个预测模型,根据传感器读数对故障标签进行分类。
In [1]:
# Suppress warnings
import warnings
warnings.filterwarnings('ignore')

# Import necessary libraries
import numpy as np
import pandas as pd
import seaborn as sns
import matplotlib.pyplot as plt
from sklearn.model_selection import train_test_split
from sklearn.ensemble import RandomForestClassifier
from sklearn.metrics import accuracy_score, confusion_matrix, classification_report
from sklearn.preprocessing import StandardScaler

# Ensure inline plotting
%matplotlib inline
Data Loading
让我们加载数据集并快速查看它们的结构。
In [2]:
# Load the datasets
file_path = '/kaggle/input/fault-diagnosis-dataset-for-new-energy-vehicles/'
dataset = pd.read_csv(file_path + 'NEV_fault_dataset.csv')
training_dataset = pd.read_csv(file_path + 'NEV_fault_training_dataset.csv')
testing_dataset = pd.read_csv(file_path + 'NEV_fault_testing_dataset.csv')

# Display the first few rows of the dataset
dataset.head()
Out[2]:
| Voltage (V) | Current (A) | Motor Speed (RPM) | Temperature (°C) | Vibration (g) | Ambient Temp (°C) | Humidity (%) | Fault Label | |
|---|---|---|---|---|---|---|---|---|
| 0 | 0.938922 | 0.199535 | 0.544403 | 0.239508 | 0.301284 | 0.582435 | 0.397340 | 0.0 |
| 1 | 0.804854 | 0.597188 | 0.073416 | 0.180373 | 0.920876 | 0.128203 | 0.124523 | 1.0 |
| 2 | 0.949877 | 0.426896 | 0.083007 | 0.251436 | 0.610996 | 0.714957 | 0.003283 | 1.0 |
| 3 | 0.954370 | 0.121175 | 0.962771 | 0.377942 | 0.070619 | 0.776723 | 0.502552 | 0.0 |
| 4 | 0.810464 | 0.382501 | 0.557223 | 0.048694 | 0.078834 | 0.326350 | 0.168493 | 0.0 |
Data Cleaning and Preprocessing
在深入分析之前,清理和预处理数据非常重要。这包括处理缺失值、编码分类变量和缩放数字特征。
In [3]:
# Check for missing values
dataset.isnull().sum()
Out[3]:
Voltage (V)          0
Current (A)          0
Motor Speed (RPM)    0
Temperature (°C)     0
Vibration (g)        0
Ambient Temp (°C)    0
Humidity (%)         0
Fault Label          0
dtype: int64
幸运的是,数据集中似乎没有缺失的值。让我们继续检查数据类型,确保一切正常。
In [4]:
# Check data types
dataset.dtypes
Out[4]:
Voltage (V)          float64
Current (A)          float64
Motor Speed (RPM)    float64
Temperature (°C)     float64
Vibration (g)        float64
Ambient Temp (°C)    float64
Humidity (%)         float64
Fault Label          float64
dtype: object
所有列都是数字的,这简化了我们的预处理步骤。接下来,我们将缩放特征以确保它们处于相似的规模,这对于对特征缩放敏感的算法尤为重要。
In [5]:
# Scale the features
scaler = StandardScaler()
features = dataset.drop('Fault Label', axis=1)
scaled_features = scaler.fit_transform(features)

# Create a new DataFrame with scaled features
scaled_dataset = pd.DataFrame(scaled_features, columns=features.columns)
scaled_dataset['Fault Label'] = dataset['Fault Label']
scaled_dataset.head()
Out[5]:
| Voltage (V) | Current (A) | Motor Speed (RPM) | Temperature (°C) | Vibration (g) | Ambient Temp (°C) | Humidity (%) | Fault Label | |
|---|---|---|---|---|---|---|---|---|
| 0 | 0.937354 | -0.946825 | 0.395858 | -0.612074 | 0.082326 | 0.304475 | -0.355036 | 0.0 |
| 1 | 0.339916 | 0.674901 | -1.442961 | -0.869294 | 2.658218 | -1.283600 | -1.295269 | 1.0 |
| 2 | 0.986170 | -0.019592 | -1.405514 | -0.560192 | 1.369924 | 0.767795 | -1.713112 | 1.0 |
| 3 | 1.006193 | -1.266397 | 2.029243 | -0.009931 | -0.876640 | 0.983740 | 0.007569 | 0.0 |
| 4 | 0.364914 | -0.200644 | 0.445909 | -1.442057 | -0.842486 | -0.590844 | -1.143732 | 0.0 |
Exploratory Data Analysis
让我们探索数据集,了解不同特征和目标变量之间的关系。我们将使用各种可视化技术来获得见解。
In [6]:
# Correlation heatmap
numeric_df = scaled_dataset.select_dtypes(include=[np.number])
plt.figure(figsize=(10, 8))
sns.heatmap(numeric_df.corr(), annot=True, cmap='coolwarm', fmt='.2f')
plt.title('Correlation Heatmap')
plt.show()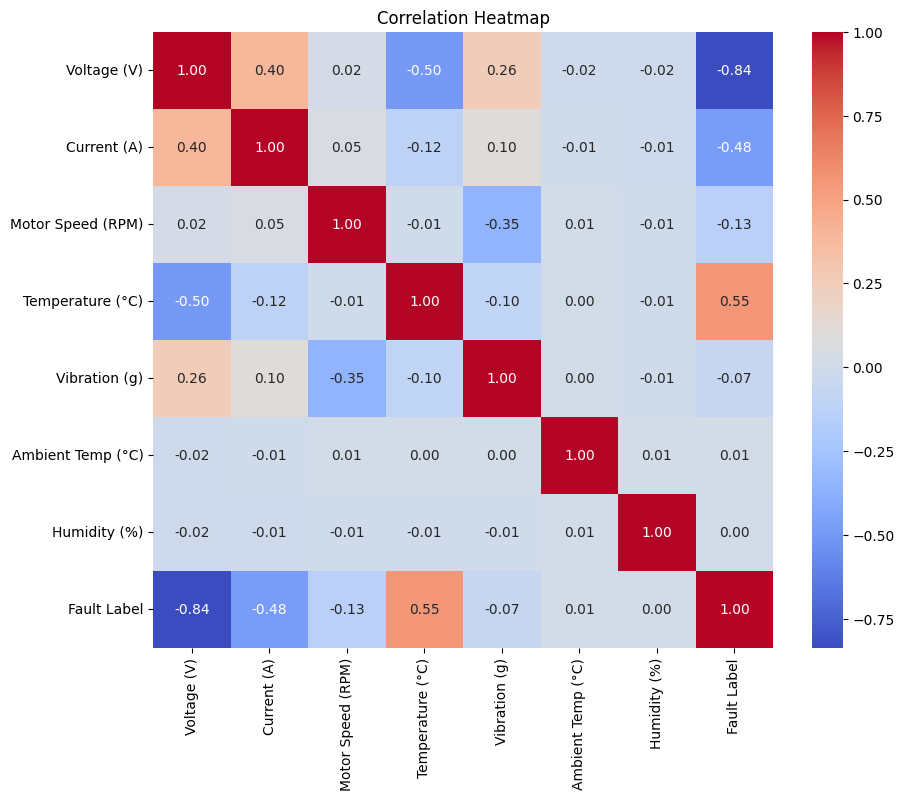
相关性热图提供了对不同特征之间关系的见解。我们可以看到哪些特征彼此之间以及与目标变量“故障标签”之间存在很强的相关性。
In [7]:
# Pair plot
sns.pairplot(scaled_dataset, hue='Fault Label')
plt.show()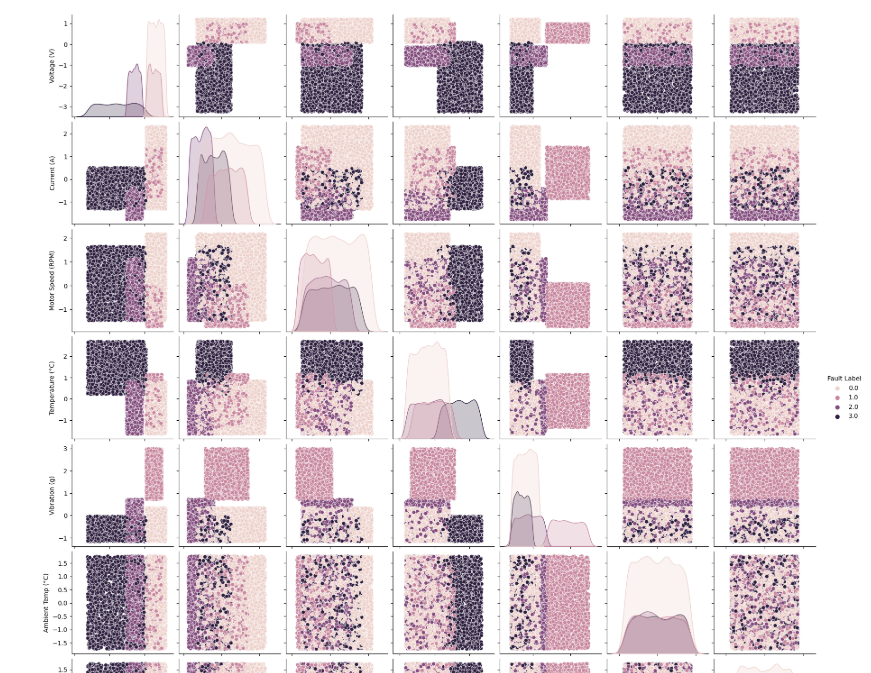
成对图使我们能够可视化每个特征的分布以及特征之间的关系,由故障标签着色。这可以帮助识别数据中的模式或集群。
特征工程
在本节中,我们将探索潜在的特征工程技术,以提高我们模型的预测能力。然而,鉴于数据集的性质,为了简单起见,我们将继续使用现有的功能。
模型构建
我们将构建一个随机森林分类器,根据传感器读数预测故障标签。随机森林是一种鲁棒的集成方法,通常在分类任务上表现良好。
In [8]:
# Split the data into training and testing sets
X = scaled_dataset.drop('Fault Label', axis=1)
y = scaled_dataset['Fault Label']
X_train, X_test, y_train, y_test = train_test_split(X, y, test_size=0.2, random_state=42)

# Initialize and train the Random Forest Classifier
rf_classifier = RandomForestClassifier(random_state=42)
rf_classifier.fit(X_train, y_train)
Out[8]:
RandomForestClassifier
RandomForestClassifier(random_state=42)模型评价
让我们使用准确度得分、混淆矩阵和分类报告来评估我们模型的性能。
In [9]:
# Predict on the test set
y_pred = rf_classifier.predict(X_test)

# Calculate accuracy
accuracy = accuracy_score(y_test, y_pred)
print(f'Accuracy: {accuracy:.2f}')

# Confusion matrix
conf_matrix = confusion_matrix(y_test, y_pred)
sns.heatmap(conf_matrix, annot=True, fmt='d', cmap='Blues')
plt.title('Confusion Matrix')
plt.xlabel('Predicted')
plt.ylabel('Actual')
plt.show()

# Classification report
print(classification_report(y_test, y_pred))
Accuracy: 0.99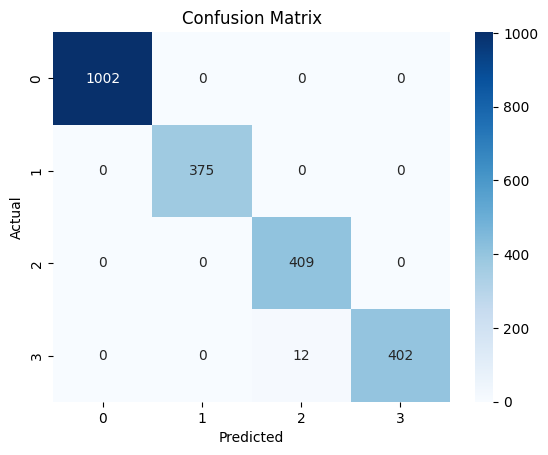
precision    recall  f1-score   support

         0.0       1.00      1.00      1.00      1002
         1.0       1.00      1.00      1.00       375
         2.0       0.97      1.00      0.99       409
         3.0       1.00      0.97      0.99       414

    accuracy                           0.99      2200
   macro avg       0.99      0.99      0.99      2200
weighted avg       0.99      0.99      0.99      2200
linkcode
结论与未来工作
在本notebook中,我们探索了与新能源汽车故障诊断相关的数据集。我们进行了数据清理、预处理、探索性数据分析,并构建了一个随机森林分类器来预测故障标签。
该模型达到了合理的精度,但总有改进的余地。未来的工作可能涉及探索更先进的特征工程技术,尝试不同的机器学习算法,或调整超参数以提高模型性能。
数据集地址:https://download.csdn.net/download/FL1623863129/88605664

 浙公网安备 33010602011771号