
react+百度地图添加大量点标记如何减缓首次加载压力
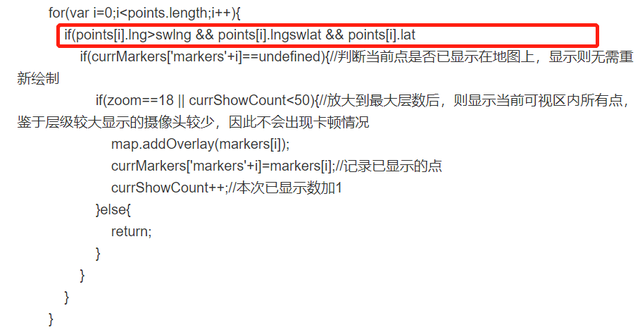
在百度地图添加大量的点标记的时候,页面会非常的卡顿,翻阅了很多文档,发现原创作者代码有缺失,导致照搬文章都一样是不完整的。如图,缺失在一个for循环里(queryInRect()函数中,下面进行了补全),然后自己便研究了一下缺失的到底是什么。
首先我是在react项目中结合echarts,和百度地图去实现一个带标注的热力地图。之前写过一篇博客,有兴趣可以直接在百度搜索 https://www.cnblogs.com/class1/p/13691867.html,下面的代码就是在上一次的基础上改动的。后来因为加的标注太多,改成首次加载200个标注。后续在地图发生变化的时候再加载出全部的标注。
先看热力地图 的代码:
// heatMap.js

import React, { Component } from 'react';

import echarts from 'echarts/lib/echarts';
// 引入热力图
import 'echarts/lib/chart/heatmap';
// 引入提示框和标题组件
import 'echarts/lib/component/tooltip';
import 'echarts/lib/component/title';
import 'echarts/extension/bmap/bmap';
import 'echarts/lib/component/visualMap';

class EchartsTest extends Component {
  constructor(props) {
    super(props);
    this.state = {
      data: props.data,
    };
  }

  componentDidMount() {
    this.getCharts();
  }

  // 保证再次请求数据时候,地图重新加载
  // eslint-disable-next-line no-unused-vars
  componentWillReceiveProps(nextProps, nextContext) {
    this.setState({
      data: nextProps.data,
    });
    setTimeout(() => {
      if(!nextProps.data.length===0){
        this.getCharts();
      }
    }, 500);
  }

   getCharts = () => {
    const { data } = this.state;
    const maxdata = data
      .map(item => item[2])
      .sort()
      .reverse()[0];
    const myChart = echarts.init(document.getElementById('container'));
    const option = {
      animation: false,
      bmap: {
        center: [data[0][0], data[0][1]],
        zoom: this.getMapGrade(data),
        roam: true,
      },
      visualMap: {
        show: true,
        bottom: 50,
        left: 0,
        min: 0,
        max: maxdata,
        seriesIndex: 0,
        calculable: true,
        inRange: {
          color: ['blue', 'green', 'yellow', 'red'],
        },
      },
      series: [
        {
          name: 'gid热力值',
          type: 'heatmap',
          coordinateSystem: 'bmap',
          data,
          pointSize: 8,
          blurSize: 8,
        },
      ],
    };
    myChart.setOption(option); // 设置的option是使用echarts的一些配置
    // 添加百度地图插件
    const bmap = myChart
      .getModel()
      .getComponent('bmap')
      .getBMap();

    bmap.addControl(new BMap.NavigationControl()); // 地图平移缩放控件

    bmap.addControl(new BMap.ScaleControl()); // 地图比例尺控件

    const points = [];
    const markers = [];
    const currMarkers = {};

    const lengths = data.length;

    for (let i = 0; i < lengths; i += 1) {
      const point = new BMap.Point(data[i][0], data[i][1]);
      points.push({ ...point, num: data[i][2] });
      markers.push(new BMap.Marker(point));
      if (i < 200) {
        // 初始显示200个点(可自定义自己能容忍卡顿时间的极限点数)
        bmap.addOverlay(markers[i]); // 绘制到地图上
        const infoWindow = new BMap.InfoWindow(`
            <div style="margin:0;line-height:20px;padding:2px;">
              标题:热点详细信息
              <br/>地理位置:${markers[i].point.lng}, ${markers[i].point.lat}
              <br/>最近三个月热力值:${points[i].num}
            </div>`);
        markers[i].infoWindow = infoWindow; // 给当前标注新增一个属性以便保存窗口信息infoWindow
        markers[i].addEventListener('click', function(e) {
          this.openInfoWindow(e.target.infoWindow); // 点击标注时,打开改标注对打开改标注对应的回调信息
        });

        currMarkers[`markers${i}`] = markers[i]; // 添加到已显示的点内
      }
    }

    // eslint-disable-next-line no-undef
    bmap.addControl(
      // eslint-disable-next-line no-undef
      new BMap.MapTypeControl({
        mapTypes: [
          // eslint-disable-next-line no-undef
          BMAP_NORMAL_MAP,
          // BMAP_HYBRID_MAP
        ],
      })
    );
    // 去掉上面的{mapTypes:[...]}  就会显示地图,卫星,三维三个图层

    function queryInRect() {
      const cp = bmap.getBounds(); // 返回map可视区域,以地理坐标表示
      const swn = cp.getSouthWest(); // 返回矩形区域的西南角
      const nen = cp.getNorthEast(); // 返回矩形区域的东北角
      const zoom = bmap.getZoom(); // 当前缩放级别

      const swlng = swn.lng;
      const swlat = swn.lat;
      const nelng = nen.lng;
      const nelat = nen.lat;
      let currShowCount = 0; // 本次拖动或缩放已显示的点数
      const allLength = points.length;
      for (let i = 0; i < allLength; i += 1) {
        if (
          points[i].lng > swlng &&
          points[i].lng < nelng &&
          points[i].lat > swlat &&
          points[i].lat < nelat
        ) {
          if (currMarkers[`markers${i}`] === undefined) {
            // 判断当前点是否已显示在地图上,显示则无需重新绘制
            if (zoom === 18 || currShowCount < 50) {
              // 放大到最大层数后,则显示当前可视区内所有点,鉴于层级较大显示的摄像头较少,因此不会出现卡顿情况
              bmap.addOverlay(markers[i]);
              //  console.log(allLength,i,markers[i].point)
              // eslint-disable-next-line no-undef
              const infoWindow = new BMap.InfoWindow(`
            <div style="margin:0;line-height:20px;padding:2px;">
              标题:热点详细信息
              <br/>地理位置:${markers[i].point.lng}, ${markers[i].point.lat}
              <br/>最近三个月热力值:${points[i].num}
            </div>`);
              markers[i].infoWindow = infoWindow; // 给当前标注新增一个属性以便保存窗口信息infoWindow
              markers[i].addEventListener('click', function(e) {
                this.openInfoWindow(e.target.infoWindow); // 点击标注时,打开改标注对打开改标注对应的回调信息
              });

              currMarkers[`markers${i}`] = markers[i]; // 记录已显示的点
              // eslint-disable-next-line no-const-assign,no-plusplus
              currShowCount += 1; // 本次已显示数加1
            } else {
              return;
            }
          }
        }
      }
    }
    bmap.addEventListener('moveend', queryInRect);  // 地图在移动的时候,继续加载标注点
    bmap.addEventListener('zoomend', queryInRect);// 地图在缩放的时候,继续加载标注点
  };

  // 计算经纬度距离(千米),四个参数分别是点A的纬度,经度,点B的纬度,经度(位置不要搞错了,我就弄错了,搞了好久)
  getDistance =(lat1, lng1, lat2, lng2)=>{
    const radLat1 = lat1*Math.PI / 180.0;
    const radLat2 = lat2*Math.PI / 180.0;
    const a = radLat1 - radLat2;
    const b = lng1*Math.PI / 180.0 - lng2*Math.PI / 180.0;
    // eslint-disable-next-line no-restricted-properties
    let s = 2 * Math.asin(Math.sqrt(Math.pow(Math.sin(a/2),2) +
      // eslint-disable-next-line no-restricted-properties
      Math.cos(radLat1)*Math.cos(radLat2)*Math.pow(Math.sin(b/2),2)));
    s *=6378.137 ;
    s = Math.round(s * 10000) / 10000;
    return s;
  };

 // 计算地图初始化所有点中最远的距离
  getZooms = val => {
    const arr = [];
    if (val.length === 1) {
      arr.push(1);
    } else {
      const xLeng = val.map(item => item[0]);
      const yLeng = val.map(item => item[1]);
      const xmin = Math.min(...xLeng);
      const xmax = Math.max(...xLeng);
      const ymin = Math.min(...yLeng);
      const ymax = Math.max(...yLeng);
      arr.push(this.getDistance(ymin, xmin, ymax, xmax));
    }
    return Math.max(...arr);
  };

  // 计算比例尺对应的百度地图等级
  getMapGrade=(val)=>{
  // console.log("数据 ",val);
    const num=this.getZoom(val);
  //   console.log("最大距离",num);
    let zoom=0;
   if(num<=1){
     zoom=15
   }else if(num>1&&num<=50){
     zoom=10
    }else if(num>50&&num<=100){
     zoom=9
   }else if(num>100&&num<=500){
     zoom=7
   }else if(num>500&&num<=1000){
     zoom=6
   }else{
     zoom=4
   }
   return zoom
  };


  render() {
    return (
      <div id="main" style={{ width: '100%', height: 600 }}></div>
    );
  }
}

export default EchartsTest;
虽说首次加载减缓了压力,后续加载页面依旧卡顿。研究了一下高德地图,非常的好用。下次重点说说如何使用高德地图的海量点标记。

 浙公网安备 33010602011771号