概率论与数理统计错题集
概率论与数理统计错题集
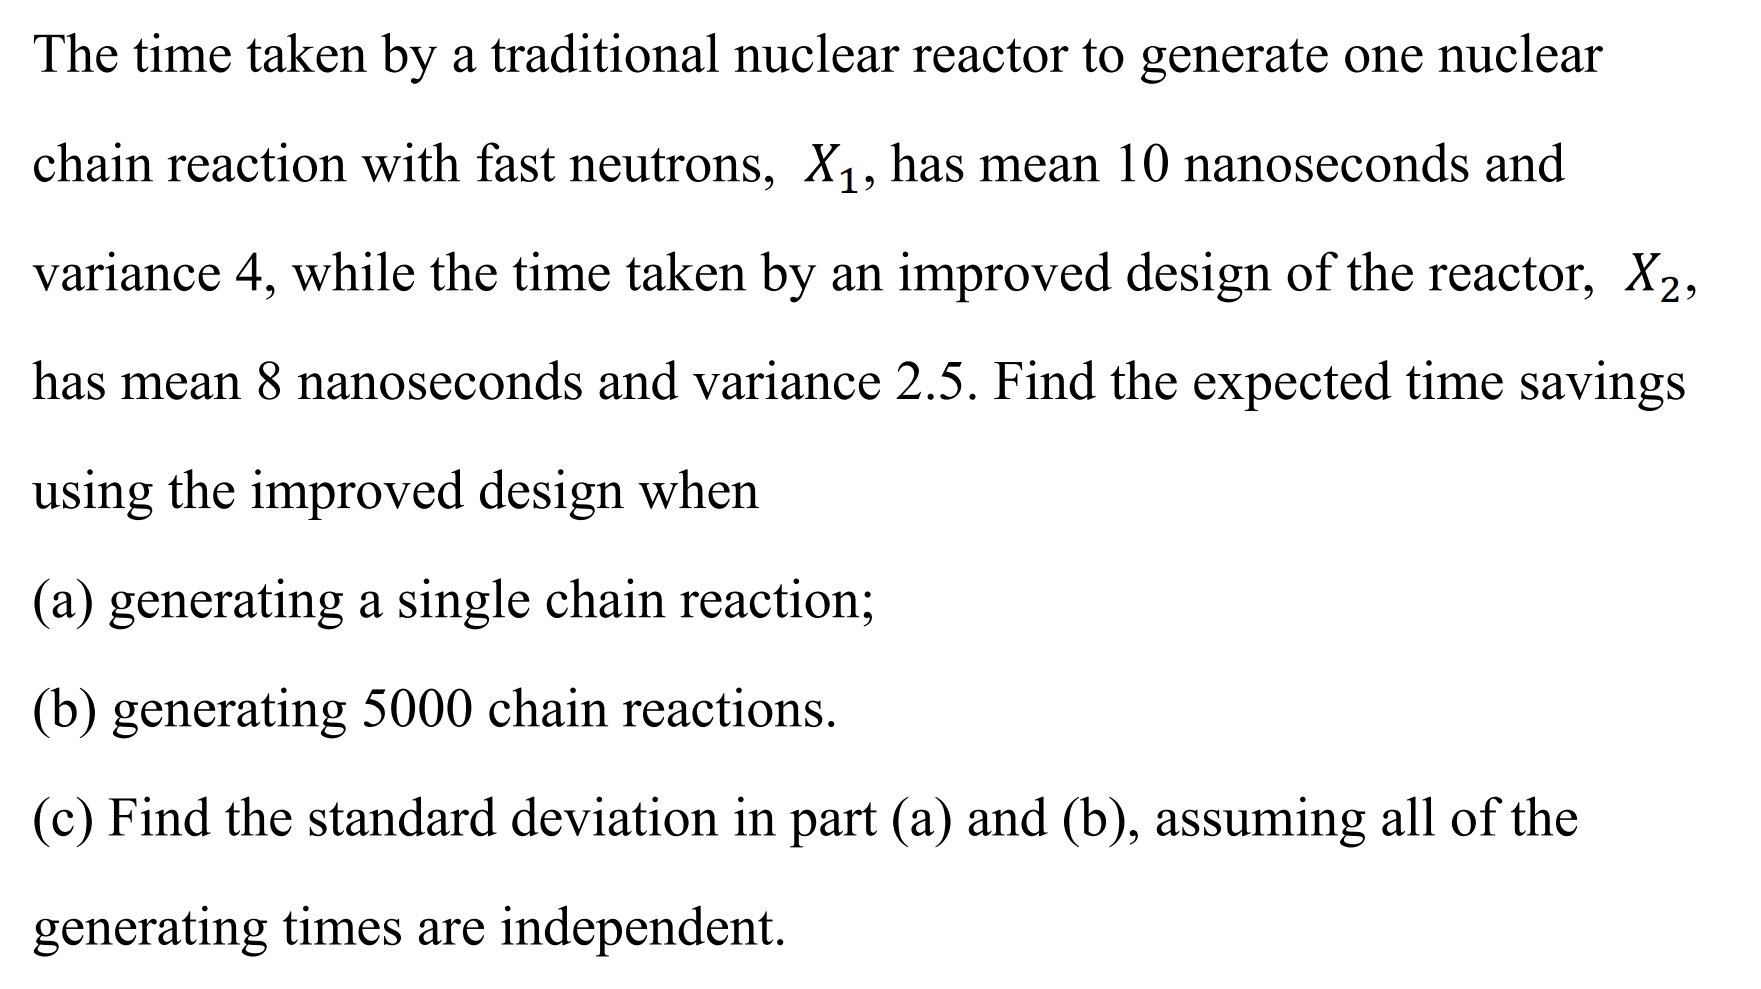
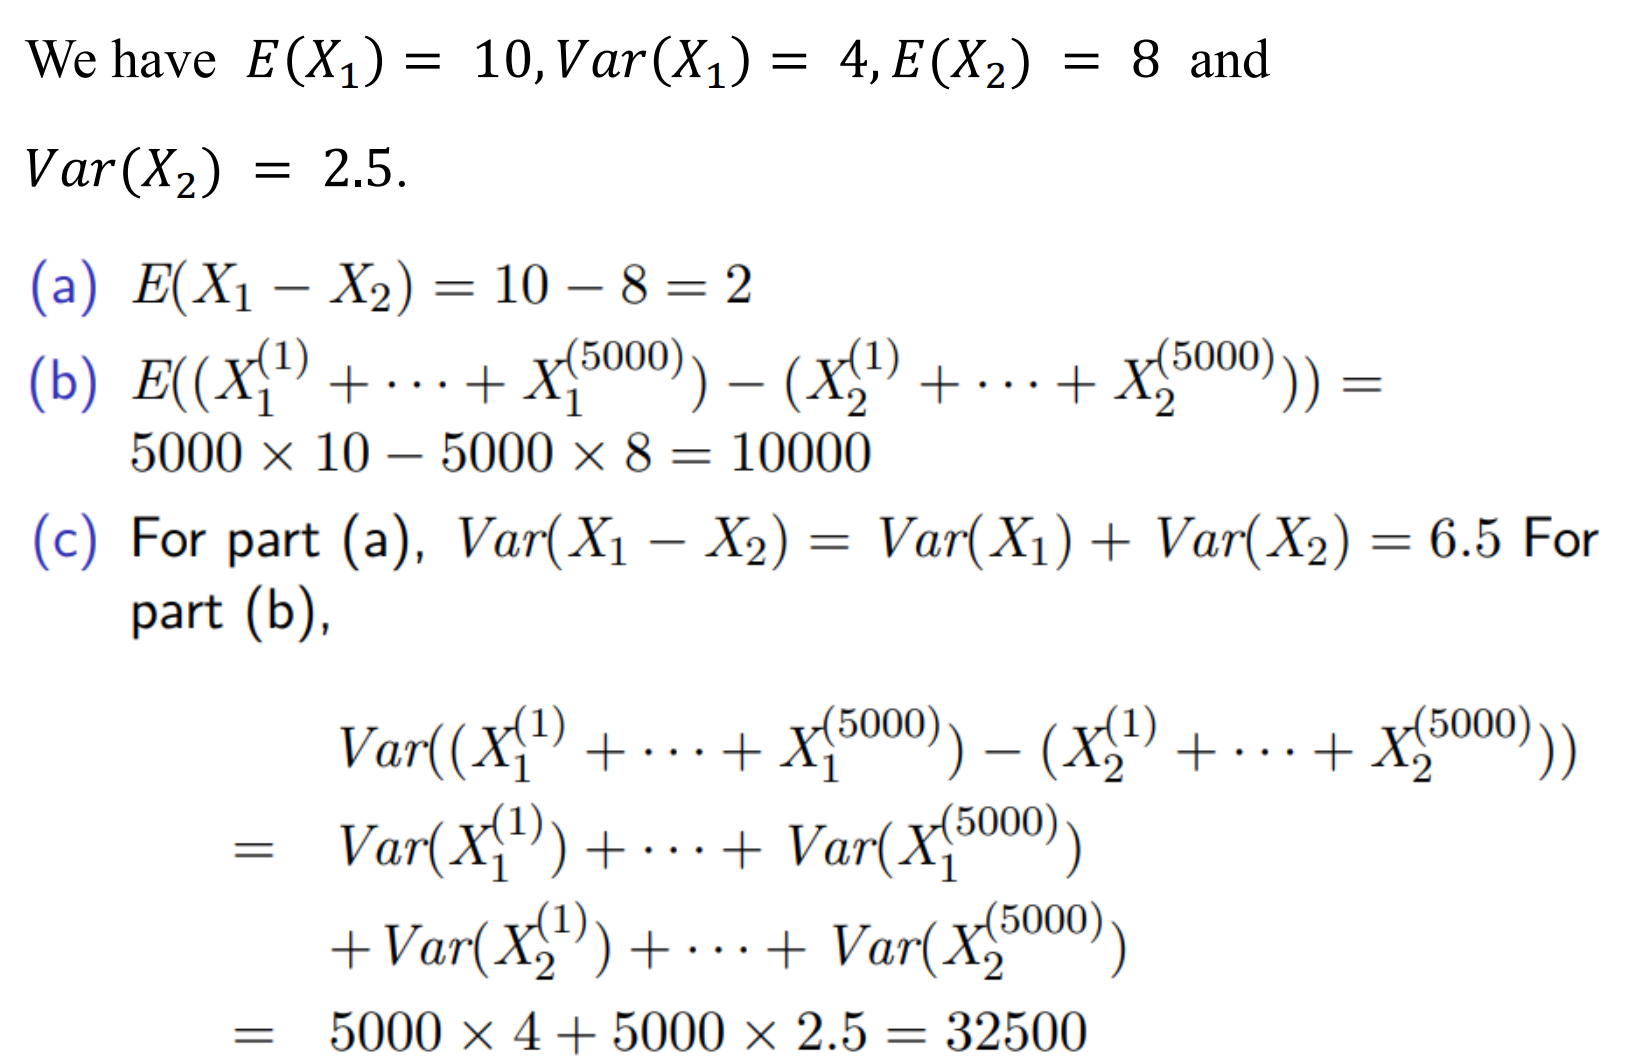
均值方差变换
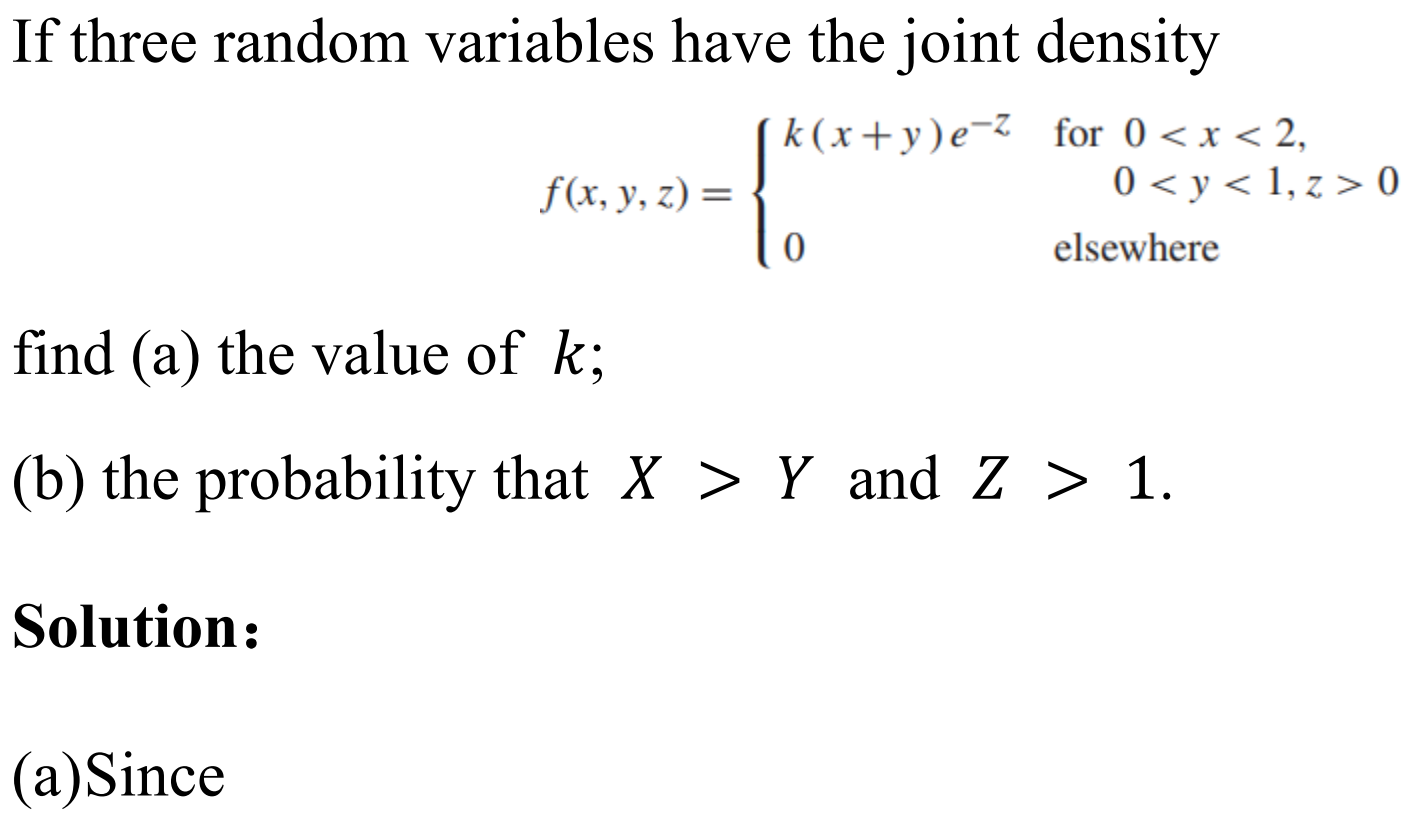
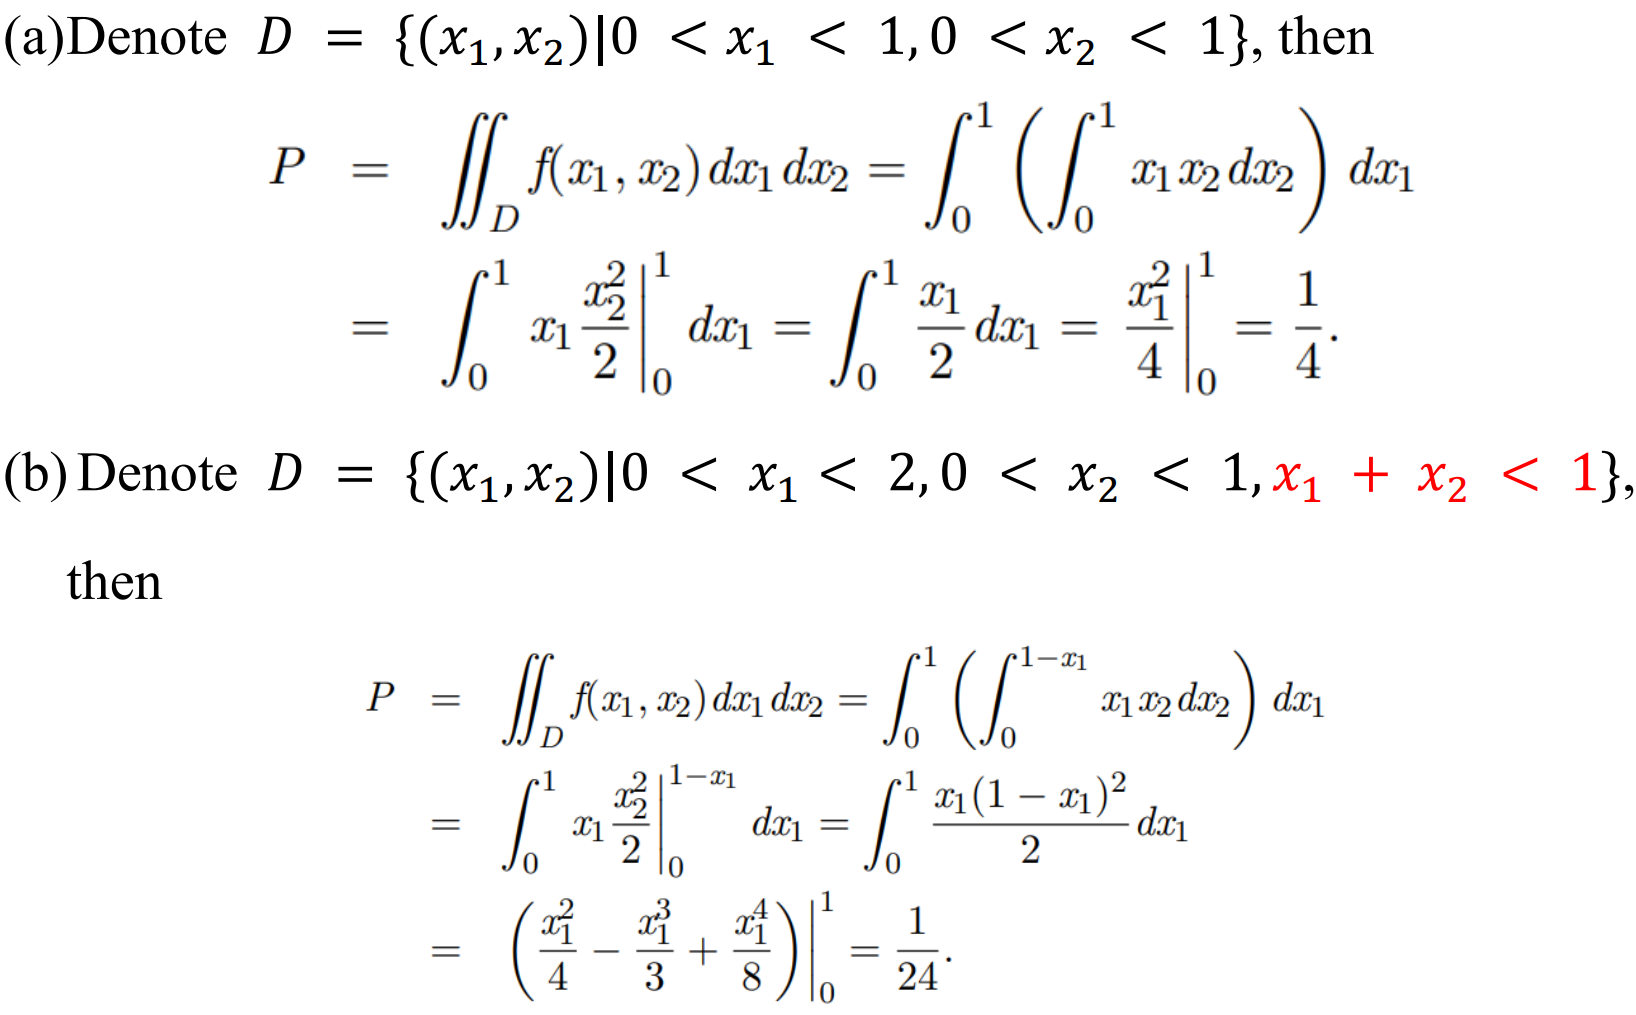
概率密度函数+定积分定义域
1

2

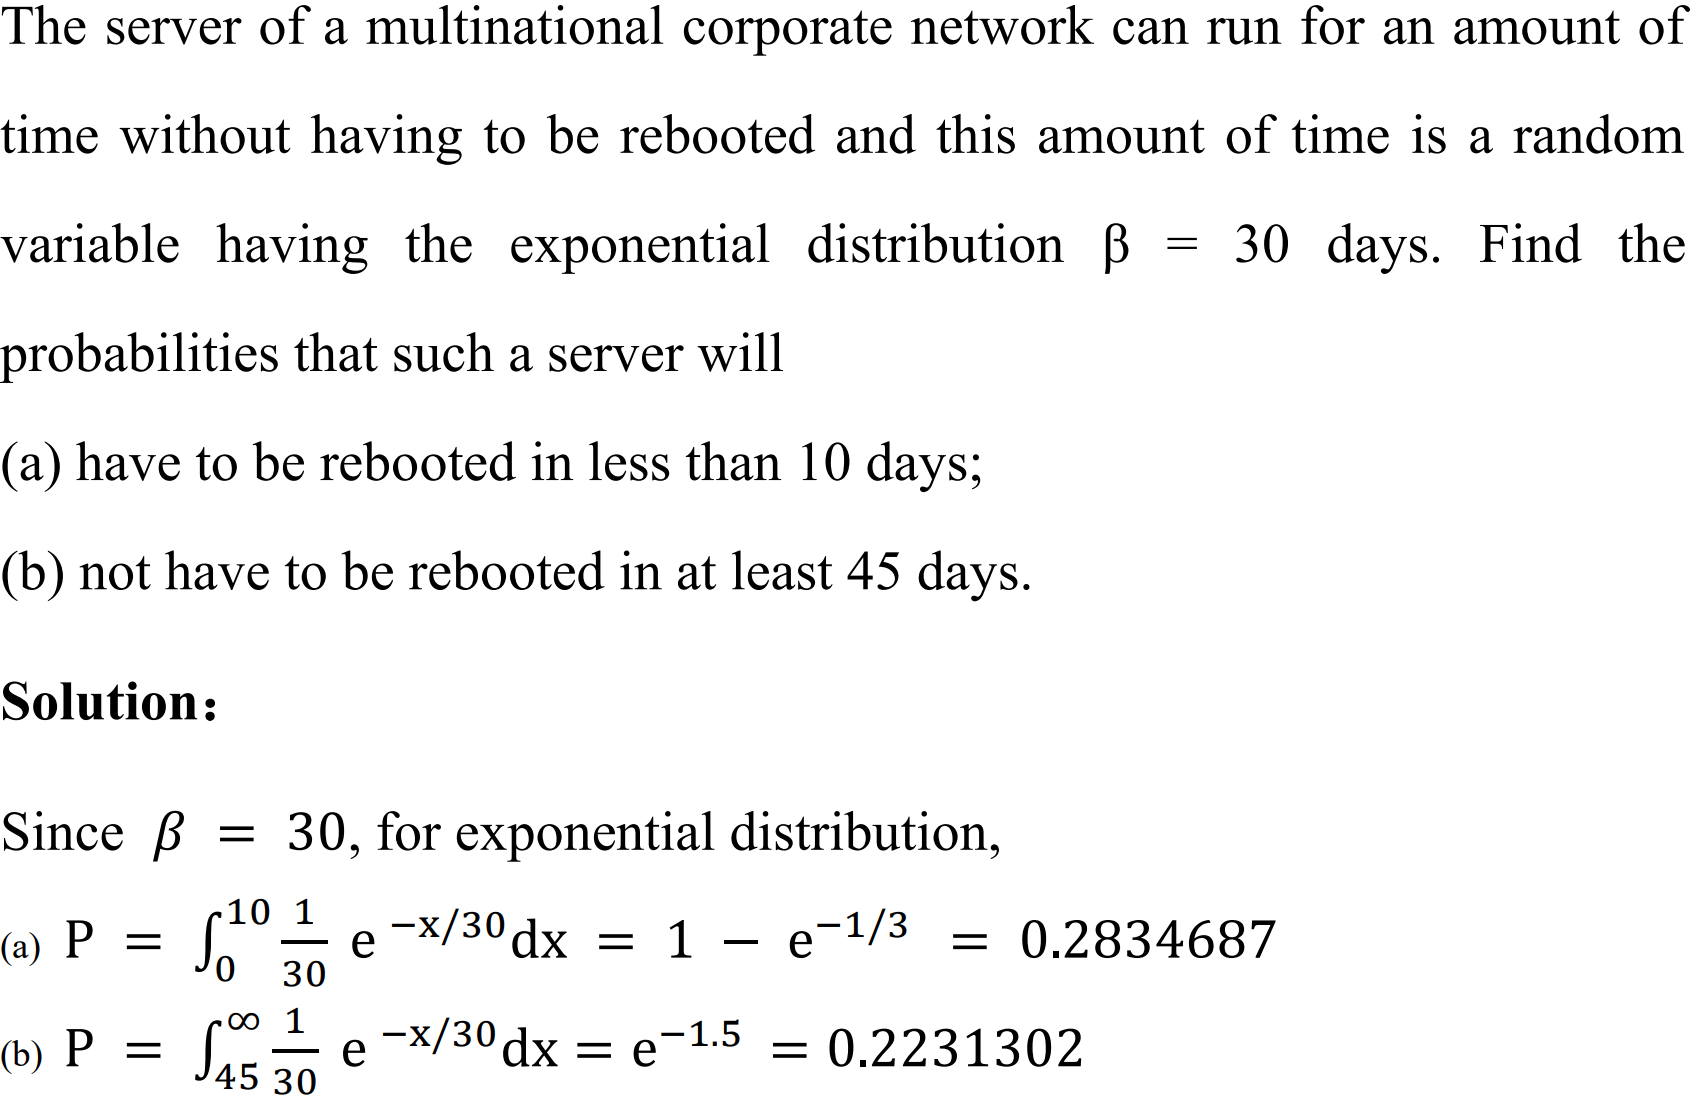
指数分布
1111111
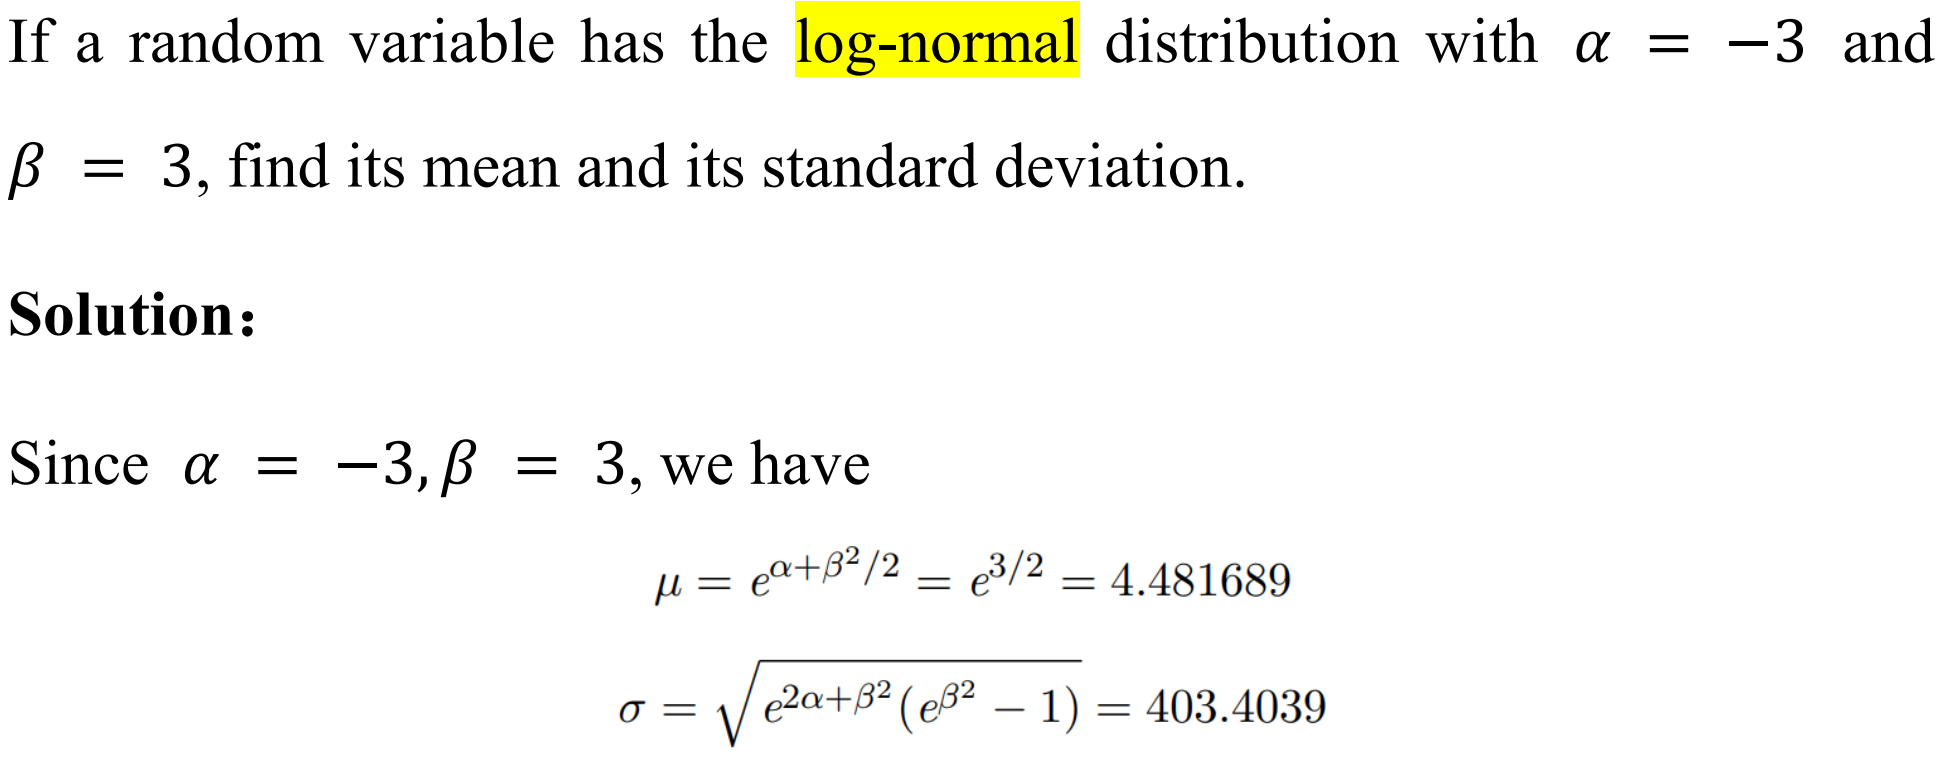
对数正态分布
公式结论
222222222222222222
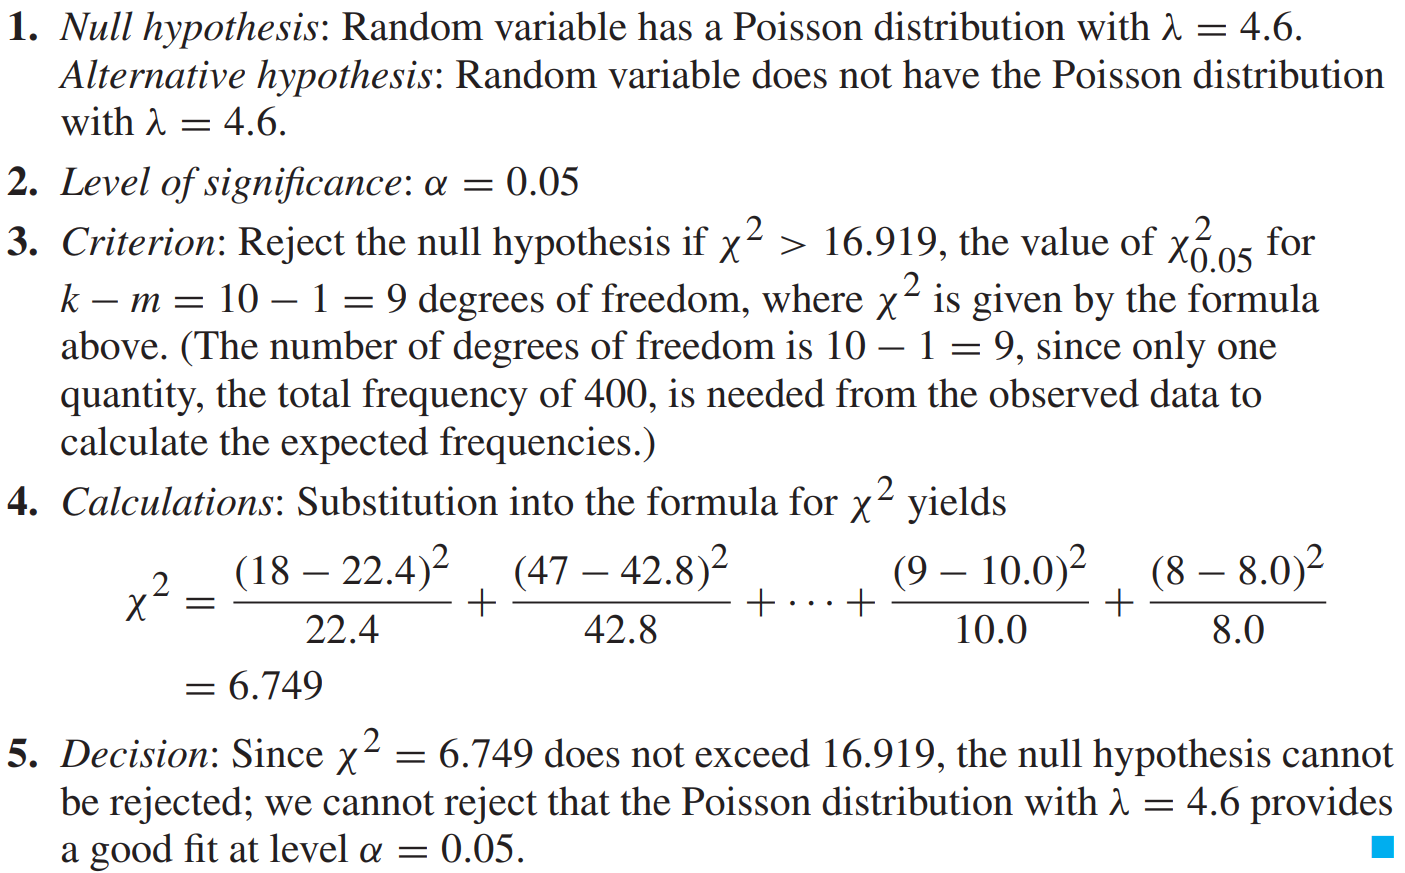
拟合优度检验
We speak of goodness of fit when we try to compare an observed frequency distribution
with the corresponding values of an expected, or theoretical, distribution.
To illustrate, suppose that during 400 five-minute intervals the air-trafffc control of
an airport received 0, 1, 2, . . . , or 13 radio messages with respective frequencies of
3, 15, 47, 76, 68, 74, 46, 39, 15, 9, 5, 2, 0, and 1. Suppose, furthermore, that we want
to check whether these data substantiate the claim that the number of radio messages
which they receive during a 5-minute interval may be looked upon as a random variable
having the Poisson distribution with λ = 4.6. Looking up the corresponding
Poisson probabilities in Table 2W and multiplying them by 400 to get the expected
frequencies, we arrive at the result shown in the following table, together with the
original data: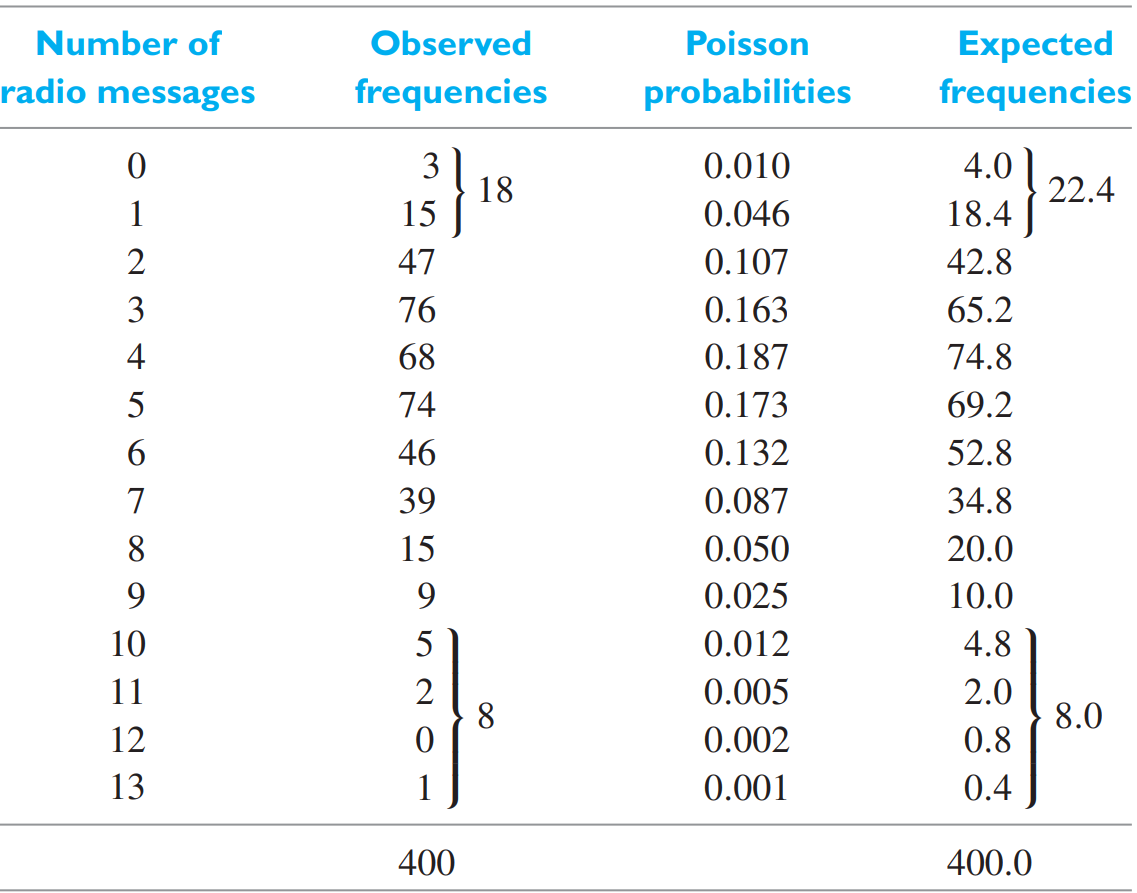
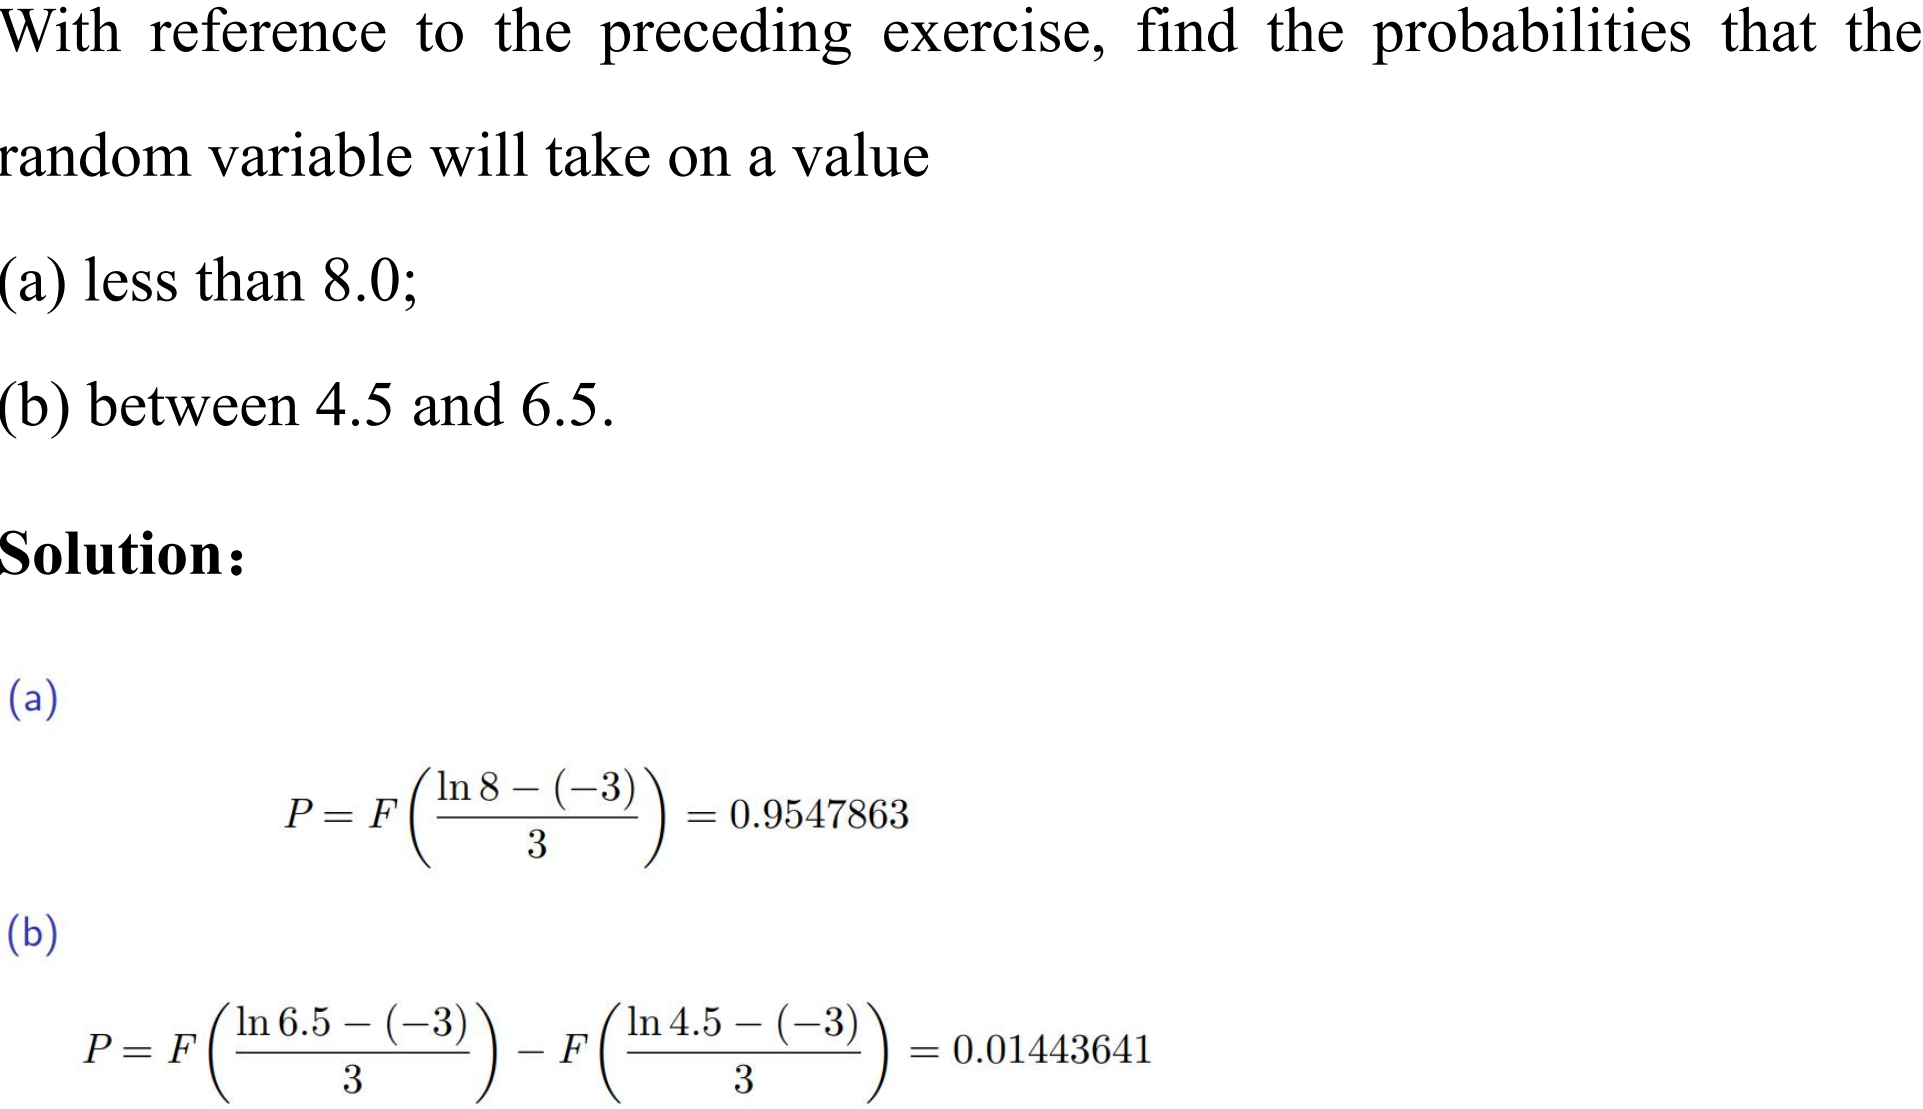
还有这类正态分布算概率

 浙公网安备 33010602011771号