压力测试记录
Apache ab测试
ab -n 1000 -c 1000 http://192.168.1.60:8030/xxxx?key=xxxxx
asp.net 4.0 webform aspx (Jexus)


Server Software:        Jexus/5.8.1.10
Server Hostname:        xxx
Server Port:            80

Document Path:          /api/user_info.aspx
Document Length:        63 bytes

Concurrency Level:      1000
Time taken for tests:   1.444 seconds
Complete requests:      1000
Failed requests:        0
Write errors:           0
Total transferred:      344069 bytes
HTML transferred:       63567 bytes
Requests per second:    692.66 [#/sec] (mean)
Time per request:       1443.707 [ms] (mean)
Time per request:       1.444 [ms] (mean, across all concurrent requests)
Transfer rate:          232.74 [Kbytes/sec] received

Connection Times (ms)
              min  mean[+/-sd] median   max
Connect:        0  160 343.9     24    1001
Processing:     6  584 271.0    550    1251
Waiting:        2  582 271.3    549    1250
Total:         41  744 355.5    629    1411

Percentage of the requests served within a certain time (ms)
  50%    629
  66%    839
  75%    892
  80%   1189
  90%   1311
  95%   1375
  98%   1393
  99%   1404
 100%   1411 (longest request)
.net 4.5 web api (Jexus)
Server Software:        Jexus/5.8.1.10
Server Hostname:        xxx
Server Port:            80

Document Path:          /api/book
Document Length:        19 bytes

Concurrency Level:      1000
Time taken for tests:   1.596 seconds
Complete requests:      1000
Failed requests:        0
Write errors:           0
Total transferred:      265000 bytes
HTML transferred:       19000 bytes
Requests per second:    626.46 [#/sec] (mean)
Time per request:       1596.277 [ms] (mean)
Time per request:       1.596 [ms] (mean, across all concurrent requests)
Transfer rate:          162.12 [Kbytes/sec] received

Connection Times (ms)
              min  mean[+/-sd] median   max
Connect:        0  195 389.1     10    1001
Processing:     9  467 349.4    358    1567
Waiting:        3  467 349.5    358    1567
Total:         22  662 469.0    406    1579

Percentage of the requests served within a certain time (ms)
  50%    406
  66%    619
  75%   1132
  80%   1310
  90%   1394
  95%   1542
  98%   1567
  99%   1572
 100%   1579 (longest request)
Python Flask (Gunicorn)
Server Software:        gunicorn/19.6.0
Server Hostname:        192.168.1.60
Server Port:            8030

Document Path:          /hash?key=12345678901abc
Document Length:        32 bytes

Concurrency Level:      1000
Time taken for tests:   12.693 seconds
Complete requests:      1000
Failed requests:        0
Write errors:           0
Total transferred:      192000 bytes
HTML transferred:       32000 bytes
Requests per second:    78.79 [#/sec] (mean)
Time per request:       12692.665 [ms] (mean)
Time per request:       12.693 [ms] (mean, across all concurrent requests)
Transfer rate:          14.77 [Kbytes/sec] received

Connection Times (ms)
              min  mean[+/-sd] median   max
Connect:        0   14 167.0      1    3000
Processing:     2 1281 1446.6    140   12664
Waiting:        2 1281 1446.6    140   12664
Total:         27 1295 1473.7    141   12685

Percentage of the requests served within a certain time (ms)
  50%    141
  66%   2832
  75%   2836
  80%   3055
  90%   3057
  95%   3083
  98%   3095
  99%   3153
Python Tornado
Server Software:        TornadoServer/4.0.1
Server Hostname:        192.168.1.60
Server Port:            8030

Document Path:          /hash?key=12345678901abc
Document Length:        32 bytes

Concurrency Level:      1000
Time taken for tests:   1.341 seconds
Complete requests:      1000
Failed requests:        0
Write errors:           0
Total transferred:      227000 bytes
HTML transferred:       32000 bytes
Requests per second:    745.88 [#/sec] (mean)
Time per request:       1340.690 [ms] (mean)
Time per request:       1.341 [ms] (mean, across all concurrent requests)
Transfer rate:          165.35 [Kbytes/sec] received

Connection Times (ms)
              min  mean[+/-sd] median   max
Connect:        0  210 403.7      1    1001
Processing:     2  174 207.0     88     831
Waiting:        2  174 207.0     88     831
Total:         26  385 471.9     89    1322

Percentage of the requests served within a certain time (ms)
  50%     89
  66%    269
  75%    820
  80%   1011
  90%   1239
  95%   1297
  98%   1312
  99%   1318
 100%   1322 (longest request)
Python Flask (祼奔)
Server Software:        Werkzeug/0.11.15
Server Hostname:        192.168.1.60
Server Port:            8030

Document Path:          /hash?key=12345678901abc
Document Length:        32 bytes

Concurrency Level:      1000
Time taken for tests:   7.023 seconds
Complete requests:      1000
Failed requests:        0
Write errors:           0
Total transferred:      187000 bytes
HTML transferred:       32000 bytes
Requests per second:    142.38 [#/sec] (mean)
Time per request:       7023.253 [ms] (mean)
Time per request:       7.023 [ms] (mean, across all concurrent requests)
Transfer rate:          26.00 [Kbytes/sec] received

Connection Times (ms)
              min  mean[+/-sd] median   max
Connect:        0   46 434.6      1    7000
Processing:     1  621 832.4    147    3852
Waiting:        1  621 832.4    147    3851
Total:         31  667 948.6    148    7013

Percentage of the requests served within a certain time (ms)
  50%    148
  66%    160
  75%   1531
  80%   1556
  90%   2277
  95%   2278
  98%   2279
  99%   3649
 100%   7013 (longest request)
大量报错: error: [Errno 32] Broken pipe
IIS (windows 2008) asp.net
Server Software:        Microsoft-IIS/7.5
Server Hostname:        192.168.1.196
Server Port:            80

Document Path:          /abtest/abtest.aspx?key=abcd7890bn
Document Length:        32 bytes

Concurrency Level:      1000
Time taken for tests:   1.265 seconds
Complete requests:      1000
Failed requests:        0
Write errors:           0
Total transferred:      270000 bytes
HTML transferred:       32000 bytes
Requests per second:    790.43 [#/sec] (mean)
Time per request:       1265.127 [ms] (mean)
Time per request:       1.265 [ms] (mean, across all concurrent requests)
Transfer rate:          208.42 [Kbytes/sec] received

Connection Times (ms)
              min  mean[+/-sd] median   max
Connect:        0   70 199.8     28    1000
Processing:     1  108 151.9     53     616
Waiting:        1  108 152.0     53     616
Total:         41  178 241.6     80    1208

Percentage of the requests served within a certain time (ms)
  50%     80
  66%     87
  75%    121
  80%    242
  90%    612
  95%    638
  98%   1003
  99%   1204
 100%   1208 (longest request)
Jmeter测试
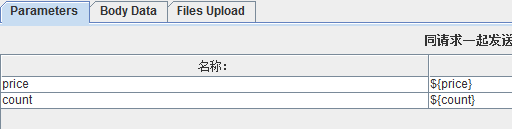
设置如下,请求使用动态参数(从文件获取)

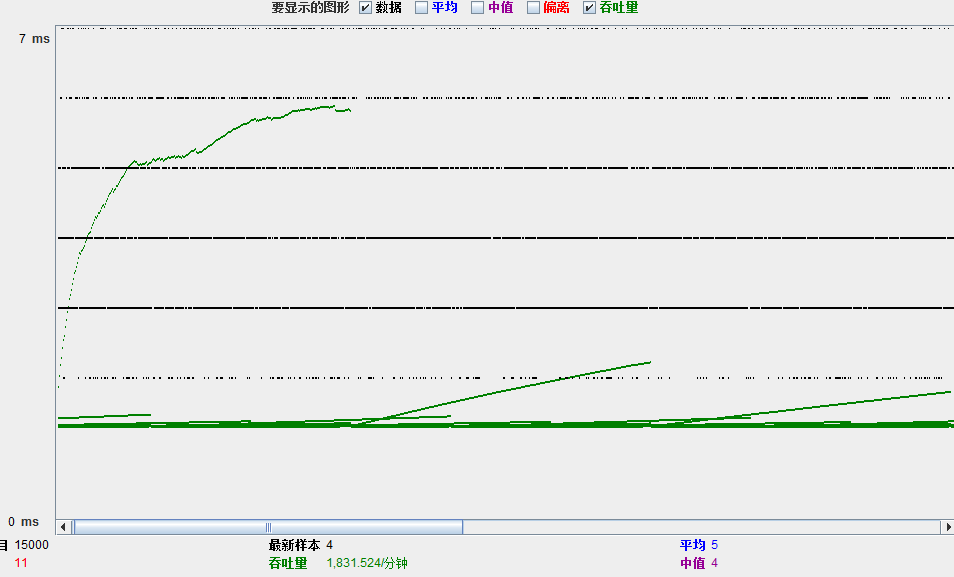
Tornado
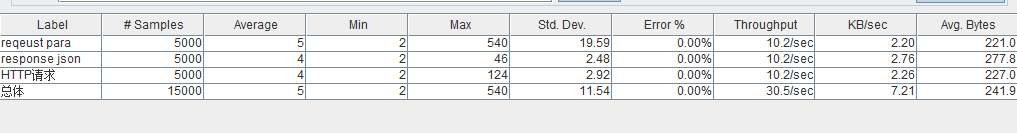
Flask (Gunicorn)

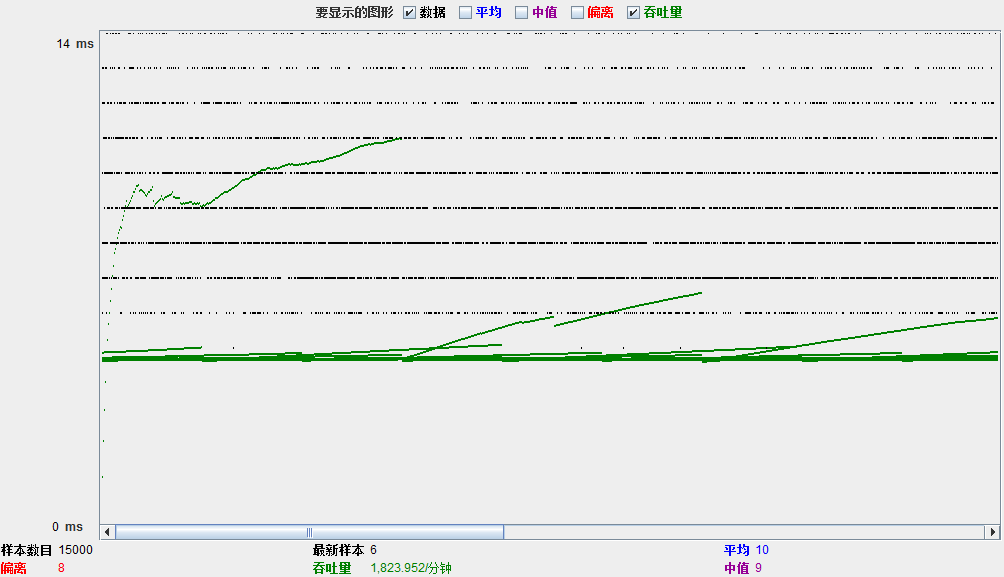
吞吐量没怎么变化,但Flask的响应时间急剧增大。

 浙公网安备 33010602011771号