一.prometheus
1.什么是prometheus
Prometheus是一个开源系统监控和警报工具包,最初在 SoundCloud构建。

自2012年成立以来,许多公司和组织都采用了Prometheus,该项目拥有非常活跃的开发者和用户社区。

它现在是一个独立的开源项目,独立于任何公司维护。Prometheus于2016年加入云原生计算基金会,成为继Kubernetes之后的第二个托管项目。

Prometheus将其指标收集并存储为时间序列数据,即指标信息与记录时的时间戳以及称为标签的可选键值对一起存储。

大多数Prometheus组件都是用Go编写的,这使得它们易于构建和部署为静态二进制文件。

参考连接:
    https://prometheus.io/docs/introduction/overview/
2.prometheus架构图
Retrieval:
    用于实时接受数据
TSDB:
    用于存储的数据
HTTP server:
    提供http接口
![]()
Prometheus Server:
    Prometheus的服务端,负责收集指标和存储时间序列数据,并提供查询接口。
    和zabbix不同是,zabix server本身并不存储数据,依赖于外部数据库比如mysql,pgsql等。

Prometheus targets:
    Prometheus将要监控的目标,可以类比于zabbix_agent。

Pushgateway:
    短期存储指标数据,主要用于临时性的任务,比如备份数据库任务监控等。也可以用于自定义监控等度量值。

Server discovery
    服务发现,例如配置动态的服务监控,无需重启Prometheus Server。

Altertmanager:
    支持报警功能,比如支持邮件,微信,钉钉报警。

Prometheus Web UI:
    Prometheus Server Web查询接口,需要写PromQL语句。后期可以使用Grafana替换。
二.部署Prometheus Server
1.部署Prometheus Server
![]()
    (1)下载地址:
https://prometheus.io/download/

    (2)解压软件包
tar xf prometheus-2.36.0.linux-amd64.tar.gz -C /oldboyedu/softwares/

    (3)启动prometheus Server
cd /oldboyedu/softwares/prometheus-2.36.0.linux-amd64
./prometheus


温馨提示:
    如下图所示,启动服务成功后,可以直接访问prometheus Server WebUI。
![]()
2.启动prometheus server需要关注的参数
--config.file="prometheus.yml"
    指定prometheus server配置文件。

--web.listen-address="0.0.0.0:9090"
    指定服务器的监听端口。
    ß
--web.read-timeout=5m
    请求连接最大的等待时间,防止太多空闲连接占用资源。

--web.max-connections=512
    最大网络连接数量,可以适当该小,比如10。

--storage.tsdb.path="data/"
    指定数据的存储路径,建议使用性能较好的磁盘。

--storage.tsdb.retention.time=STORAGE.TSDB.RETENTION.TIME
    官方已废弃"--storage.tsdb.retention"参数,我们可以使用它来指定数据的保存周期。
    默认保留15天的数据,通常情况下是不需要修改的,支持的单位有: y, w, d, h, m, s, ms。
    如果工作中有需要看几个月前的数据,那需要适当调大该参数,这意味着会占用额外的存储空间。

--query.timeout=2m
    可以防止用户查询语句出现慢查询超过2分钟后会自动终止PromQL的执行。

--query.max-concurrency=20
    防止太多的用户并发查询。

--log.level=info
    指定日志的级别,支持的值有debug, info, warn, error。


更多参数详情请参考:
    ./prometheus -h
3.编写prometheus server的启动脚本
cat > /etc/sysconfig/prometheus <<'EOF'
PROMETHEUS_HOME=/oldboyedu/softwares/prometheus-2.36.0.linux-amd64
EOF


cat > /usr/lib/systemd/system/prometheus.service <<'EOF'
[Unit]
Description=Oldboyedu Linux80 prometheus server daemon
After=network.target

[Service]
EnvironmentFile=/etc/sysconfig/prometheus
ExecStart=/oldboyedu/softwares/prometheus-2.36.0.linux-amd64/prometheus \
          --config.file=${PROMETHEUS_HOME}/prometheus.yml \
          --web.listen-address=0.0.0.0:9090 \
          --storage.tsdb.path=${PROMETHEUS_HOME}/data \
          --web.max-connections=10 \
          --storage.tsdb.retention.time=15d \
          --log.level=info \
          --web.read-timeout=5m

[Install]
WantedBy=multi-user.target
EOF
systemctl daemon-reload
systemctl restart prometheus
systemctl status prometheus
4.prometheus server的配置文件
global:  # 通用配置。
  scrape_interval: 5s  # 指定抓取数据的间隔时间为5秒,默认是1分钟。
  evaluation_interval: 15s # 间隔多长时间去检查规则,默认是1分钟。

# 先战略性忽略,有专门的章节讲解。
alerting:
  alertmanagers:
    - static_configs:
        - targets:
          # - alertmanager:9093

rule_files:
  # - "first_rules.yml"
  # - "second_rules.yml"

# 抓取数据的配置
scrape_configs:
  - job_name: "prometheus"  # 指定job的名称,会打上一个标签job="prometheus"。

    # metrics_path defaults to '/metrics'
    # scheme defaults to 'http'.

    static_configs: # 静态配置
      - targets: ["localhost:9090"]  # 指定要监控的目标,默认的协议是http,默认的metrics_path是'/metrics'.
5.监控node exporter
![]()
   (1)下载地址
https://prometheus.io/download/#node_exporter

    (2)部署node exporter
tar xf node_exporter-1.3.1.linux-amd64.tar.gz -C /oldboyedu/softwares/

    (3)运行node exporter
cd /oldboyedu/softwares/node_exporter-1.3.1.linux-amd64
./node_exporter

    (4)访问node exporter的WebUI(如下图所示)
http://10.0.0.103:9100/metrics

    (5)配置prometheus server监控node exporter
vim prometheus.yml
...
scrape_configs:
  ...

  - job_name: "oldboyedu-linux80-elk-cluster"
    static_configs:
      - targets: ["10.0.0.103:9100","10.0.0.102:9100"]

  - job_name: "oldboyedu-linux80-elk103"
    static_configs:
      - targets: ["10.0.0.103:9100"]

  - job_name: "oldboyedu-linux80-elk102"
    static_configs:
      - targets: ["10.0.0.102:9100"]

    (6)重启prometheus server使得配置文件生效
systemctl restart prometheus

    (7)观察prometheus server的WebUI是否有数据
如上图所示。
![]()
6.编写node exporter的启动脚本
cat > /usr/lib/systemd/system/node-exporter.service <<'EOF'
[Unit]
Description=Oldboyedu Linux80 Node exporter daemon
After=network.target

[Service]
ExecStart=/oldboyedu/softwares/node_exporter-1.3.1.linux-amd64/node_exporter \
          --web.listen-address=:9100 \
          --log.level=info


[Install]
WantedBy=multi-user.target
EOF
systemctl daemon-reload
systemctl restart node-exporter
systemctl status node-exporter
7.基于容器启动
![]()
https://hub.docker.com/u/prom

推荐阅读:
    https://hub.docker.com/r/prom/prometheus
    https://hub.docker.com/r/prom/node-exporter
    https://hub.docker.com/r/prom/pushgateway
    https://hub.docker.com/r/prom/alertmanager


温馨提示:
    部署服务时,建议明确指定tag版本,因为不指定为latest,而latest内容随着版本的推移,可能会有重大变化。

    举个例子:
docker run -dp 9090:9090 \
            -v /file/to/path:/etc/prometheus/prometheus.yml \
            --restart always \
            --name oldboyedu_linux_prometheus_server \
            prom/prometheus:v2.36.0

docker  run -dp 9091:9091 \
            --restart always \
            --name oldboyedu_linux_pushgateway \
            prom/pushgateway:v1.4.3

docker  run -dp 9100:9100 \
            --restart always \
            --name oldboyedu_linux_node-exporter \
            prom/node-exporter:v1.3.1

docker  run -dp 9093:9093 \
            --restart always \
            --name oldboyedu_linux_alertmanager\
            prom/alertmanager:v0.24.0
三.prometheus server的静态配置和动态配置
1.通过容器启动node-export
docker run -dp 19100:9100  --restart unless-stopped  -v "/:/host:ro,rslave"   --name=node_exporter   prom/node-exporter:v1.3.1   --path.rootfs /host


温馨提示:
    -v "/:/host:ro,rslave"
        将宿主机的/路径挂载到容器的/host路径,与此同时,指定挂载方式为只读,并实时同步宿主机的根文件系统。

    --path.rootfs /host
        给node_exporter容器穿参数,指定根文件系统为/host。


参考链接:
    https://github.com/prometheus/node_exporter
2.通过容器启动cadvisor
docker run --volume=/:/rootfs:ro  --volume=/var/run:/var/run:rw --volume=/sys:/sys:ro --volume=/var/lib/docker/:/var/lib/docker:ro  --publish=8080:8080 --detach=true --name=cadvisor google/cadvisor:latest


温馨提示:
    --volume=/:/rootfs:ro
        相当于"-v /:/rootfs:ro"。

    --publish=8080:8080
        相当于"-p 8080:8080"。

    --detach=true
        相当于"-d"。


参考链接:
    https://github.com/google/cadvisor
    https://github.com/google/cadvisor/blob/master/deploy/Dockerfile
3.prometheus server基于静态的方式配置监控
(1)修改配置文件
vim prometheus.yml
...
scrape_configs:
  ....
  - job_name: "oldboyedu-linux80-elk-cluster"
    static_configs:
      - targets: ["10.0.0.103:9100","10.0.0.102:9100","10.0.0.102:19100","10.0.0.103:19100"]

  - job_name: "oldboyedu-linux80-elk103"
    static_configs:
      - targets: ["10.0.0.103:9100"]

  - job_name: "oldboyedu-linux80-elk102"
    static_configs:
      - targets: ["10.0.0.102:9100"]

  - job_name: "oldboyedu-linux80-containers"
    static_configs:
      - targets: ["10.0.0.102:8080","10.0.0.103:8080"]


(2)重启服务
systemctl restart prometheus

温馨提示:
    基于静态的配置方式有一个很大的缺点,就是每次修改需要重启prometheus server服务。
4.prometheus server基于文件的动方式配置监控
(1)修改配置文件
vim prometheus.yml
...
scrape_configs:
  ....
  - job_name: "oldboyedu-linux80-cadvisor"
    file_sd_configs:
    - files:
      - /oldboyedu/softwares/prometheus-2.36.0.linux-amd64/oldboyoedu-config/containers.yml

  - job_name: "oldboyedu-linux82-node_exporter"
    file_sd_configs:
    - files:
      - /oldboyedu/softwares/prometheus-2.36.0.linux-amd64/oldboyoedu-config/node-exporter.yml


(2)重启服务
systemctl restart prometheus


(3)编写动态配置文件
cat > /oldboyedu/softwares/prometheus-2.36.0.linux-amd64/oldboyoedu-config/containers.yml <<'EOF'
[
  {
     "targets": ["10.0.0.102:8080","10.0.0.103:8080"]
  }
]
EOF
cat > /oldboyedu/softwares/prometheus-2.36.0.linux-amd64/oldboyoedu-config/node-exporter.yml <<'EOF'
[
  {
    "targets": ["10.0.0.102:19100","10.0.0.103:19100","10.0.0.103:9100","10.0.0.102:9100"]
  }
]
EOF


温馨提示:
    基于动态的配置方式有一个很大的优点,就是每次修改需要不重启prometheus server服务。
5.prometheus server基于consul的动方式配置监控
作业内容。
四.PromQL语句
1.prometheus metrics type
prometheus监控中采集过来的数据统一称为Metrics数据,其并不是代表具体的数据格式,而是一种统计度量计算单位。

当我们需要为某个系统或者某个服务做监控是,就需要使用到metrics。

prometheus支持的metrics包括但不限于以下几种数据类型:
    guage:
        最简单的度量指标,只是一个简单的返回值,或者叫瞬时状态。
        比如说统计硬盘,内存等使用情况。

    couter:
        就是一个计数器,从数据量0开始累积计算,在理想情况下,只能是永远的增长,不会降低(有特殊情况,比如粉丝量)。
        比如统计1小时,1天,1周,1一个月的用户访问量,这就是一个累加的操作。

    histograms:
        是统计数据的分布情况,比如最小值,最大值,中间值,中位数等,代表的是一种近似百分比估算数值。
        通过histograms可以分别统计处在一个时间段(1s,2s,5s,10s)内nginx访问用户的响应时间。

    summary:
        summary是histograms的扩展类型,主要弥补histograms不足。
2.初识PromQL
node_cpu_seconds_total{mode="idle",cpu="0", instance="10.0.0.102:9100"}
    使用标签过滤器查看"10.0.0.102:9100"节点的第0颗CPU,空闲状态使用的总时间。

node_cpu_seconds_total{mode="idle",cpu="0", instance="10.0.0.102:9100"}[1m]
    统计1分钟内,使用标签过滤器查看"10.0.0.102:9100"节点的第0颗CPU,空闲状态使用的总时间。

node_cpu_seconds_total{mode!="idle",cpu="0", instance="10.0.0.102:9100"}[1m]
    统计1分钟内,使用标签过滤器查看"10.0.0.102:9100"节点的第0颗CPU,非空闲状态使用的总时间。

node_cpu_seconds_total{mode=~"i.*",cpu="0", instance="10.0.0.102:9100"}[1m]
    统计1分钟内,使用标签过滤器查看"10.0.0.102:9100"节点的第0颗CPU,mode名称以字母"i"开头的所有CPU核心。

node_cpu_seconds_total{mode!~"i.*",cpu="0", instance="10.0.0.102:9100"}[1m]
    统计1分钟内,使用标签过滤器查看"10.0.0.102:9100"节点的第0颗CPU,mode名称不是以字母"i"开头的所有CPU核心。
3.Prometheus常用的函数
3.1 increase
increase函数:
    用来针对counter数据类型,截取其中一段时间总的增量。


举个例子:
    increase(node_cpu_seconds_total{mode="idle",cpu="0", instance="10.0.0.102:9100"}[1m])
        统计1分钟内,使用标签过滤器查看"10.0.0.102:9100"节点的第0颗CPU,空闲状态使用的总时间增量。
3.2 sum
sum函数:
    加和的作用。


举个例子:
    sum(increase(node_cpu_seconds_total{mode="idle",cpu="0", instance="10.0.0.102:9100"}[1m]))
        统计1分钟内,使用标签过滤器查看"10.0.0.102:9100"节点的第0颗CPU,空闲状态使用的总时间增量,并将返回结果累加。
3.3 by
by函数:
    将数据进行分组,类似于MySQL的"GROUP BY"。


举个例子:
    sum(increase(node_cpu_seconds_total{mode="idle",cpu="0"}[1m])) by (instance)
        统计1分钟内,使用标签过滤器查看第0颗CPU空闲状态,并将结果进行累加,基于instance进行分组。
3.4 rate
rate函数:
    它的功能是按照设置的时间段,取counter在这个时间段中平均每秒的增量。


举个例子:
    rate(node_cpu_seconds_total{mode="idle",cpu="0", instance="10.0.0.102:9100"}[1m])
        统计1分钟内,使用标签过滤器查看"10.0.0.102:9100"节点的第0颗CPU,空闲状态使用的每秒的增量。


increase和rate如何选择:
    (1)对于采集数据频率较低的场景建议使用increase函数,因为使用rate函数可能会出现断点,比如针对硬盘容量监控。
    (2)对于采集数据频率较高的场景建议使用rate函数,比如针对CPU,内存,网络流量等都是可以基于rate函数来采集等。
3.5 topk
topk函数:
    取前几位的最高值,实际使用的时候一般会用该函数进行瞬时报警,而不是为了观察曲线图。

举个例子:
    topk(3, rate(node_cpu_seconds_total{mode="idle",cpu="0"}[1m]))
        统计1分钟内,使用标签过滤器查看第0颗CPU,空闲状态使用的每秒的增量,只查看前3个节点。
3.6 count
count函数:
    把数值符合条件的,输出数目进行累加加和,一般用它进行一些某户的监控判断。
    比如说企业中有100台服务器,如果只有10台服务器CPU使用率高于80%时候是不需要报警的,但是数量操作70台时就需要报警了。

举个例子:
    count(oldboyedu_tcp_wait_conn > 500):
        假设oldboyedu_tcp_wait_conn是咱们自定义的KEY。
        整改成果一大部分去啊吧TCP等待数量大于500的机器数量。
其他函数
推荐阅读:
    https://prometheus.io/docs/prometheus/latest/querying/functions/
4.监控CPU的使用情况案例
4.1 统计各个节点CPU的使用率
    (1)我们需要先找到CPU相关的KEY
node_cpu_seconds_total

    (2)过滤出CPU的空闲时间({mode='idle'})和全部CPU的时间('{}')
node_cpu_seconds_total{mode='idle'}
    过滤CPU的空闲时间。
node_cpu_seconds_total{}
    此处的'{}'可以不写,因为里面没有任何参数,代表获取CPU的所有状态时间。

    (3)统计1分钟内CPU的增量时间
increase(node_cpu_seconds_total{mode='idle'}[1m])
    统计1分钟内CPU空闲状态的增量。
increase(node_cpu_seconds_total[1m])
    统计1分钟内CPU所有状态的增量。

    (4)将结果进行加和统计
sum(increase(node_cpu_seconds_total{mode='idle'}[1m]))
    将1分钟内所有CPU空闲时间的增量进行加和计算。
sum(increase(node_cpu_seconds_total[1m]))
    将1分钟内所有CPU空闲时间的增量进行加和计算。

    (5)按照不同节点进行分组
sum(increase(node_cpu_seconds_total{mode='idle'}[1m])) by (instance)
    将1分钟内所有CPU空闲时间的增量进行加和计算,并按照机器实例进行分组。
sum(increase(node_cpu_seconds_total[1m])) by (instance)
    将1分钟内所有CPU空闲时间的增量进行加和计算,并按照机器实例进行分组。

    (6)计算1分钟内CPU空闲时间的百分比
sum(increase(node_cpu_seconds_total{mode='idle'}[1m])) by (instance) / sum(increase(node_cpu_seconds_total[1m])) by (instance)

    (7)统计1分钟内CPU的使用率,计算公式: (1 - CPU空闲时间的百分比) * 100%。
(1 - sum(increase(node_cpu_seconds_total{mode='idle'}[1m])) by (instance) / sum(increase(node_cpu_seconds_total[1m])) by (instance)) * 100

    (8)统计1小时内CPU的使用率,计算公式: (1 - CPU空闲时间的百分比) * 100%。
(1 - sum(increase(node_cpu_seconds_total{mode='idle'}[1h])) by (instance) / sum(increase(node_cpu_seconds_total[1h])) by (instance)) * 100
4.2 计算CPU用户态的1分钟内百分比
![]()
(sum(increase(node_cpu_seconds_total{mode='user'}[1m])) by (instance) / sum(increase(node_cpu_seconds_total[1m])) by (instance)) * 100


温馨提示:
    可以使用stress命令来进行压测CPU,即执行"stress -c 2 -v"命令即可。
4.3 计算CPU内核态的1分钟内百分比
![]()
(sum(increase(node_cpu_seconds_total{mode='system'}[1m])) by (instance) / sum(increase(node_cpu_seconds_total[1m])) by (instance)) * 100
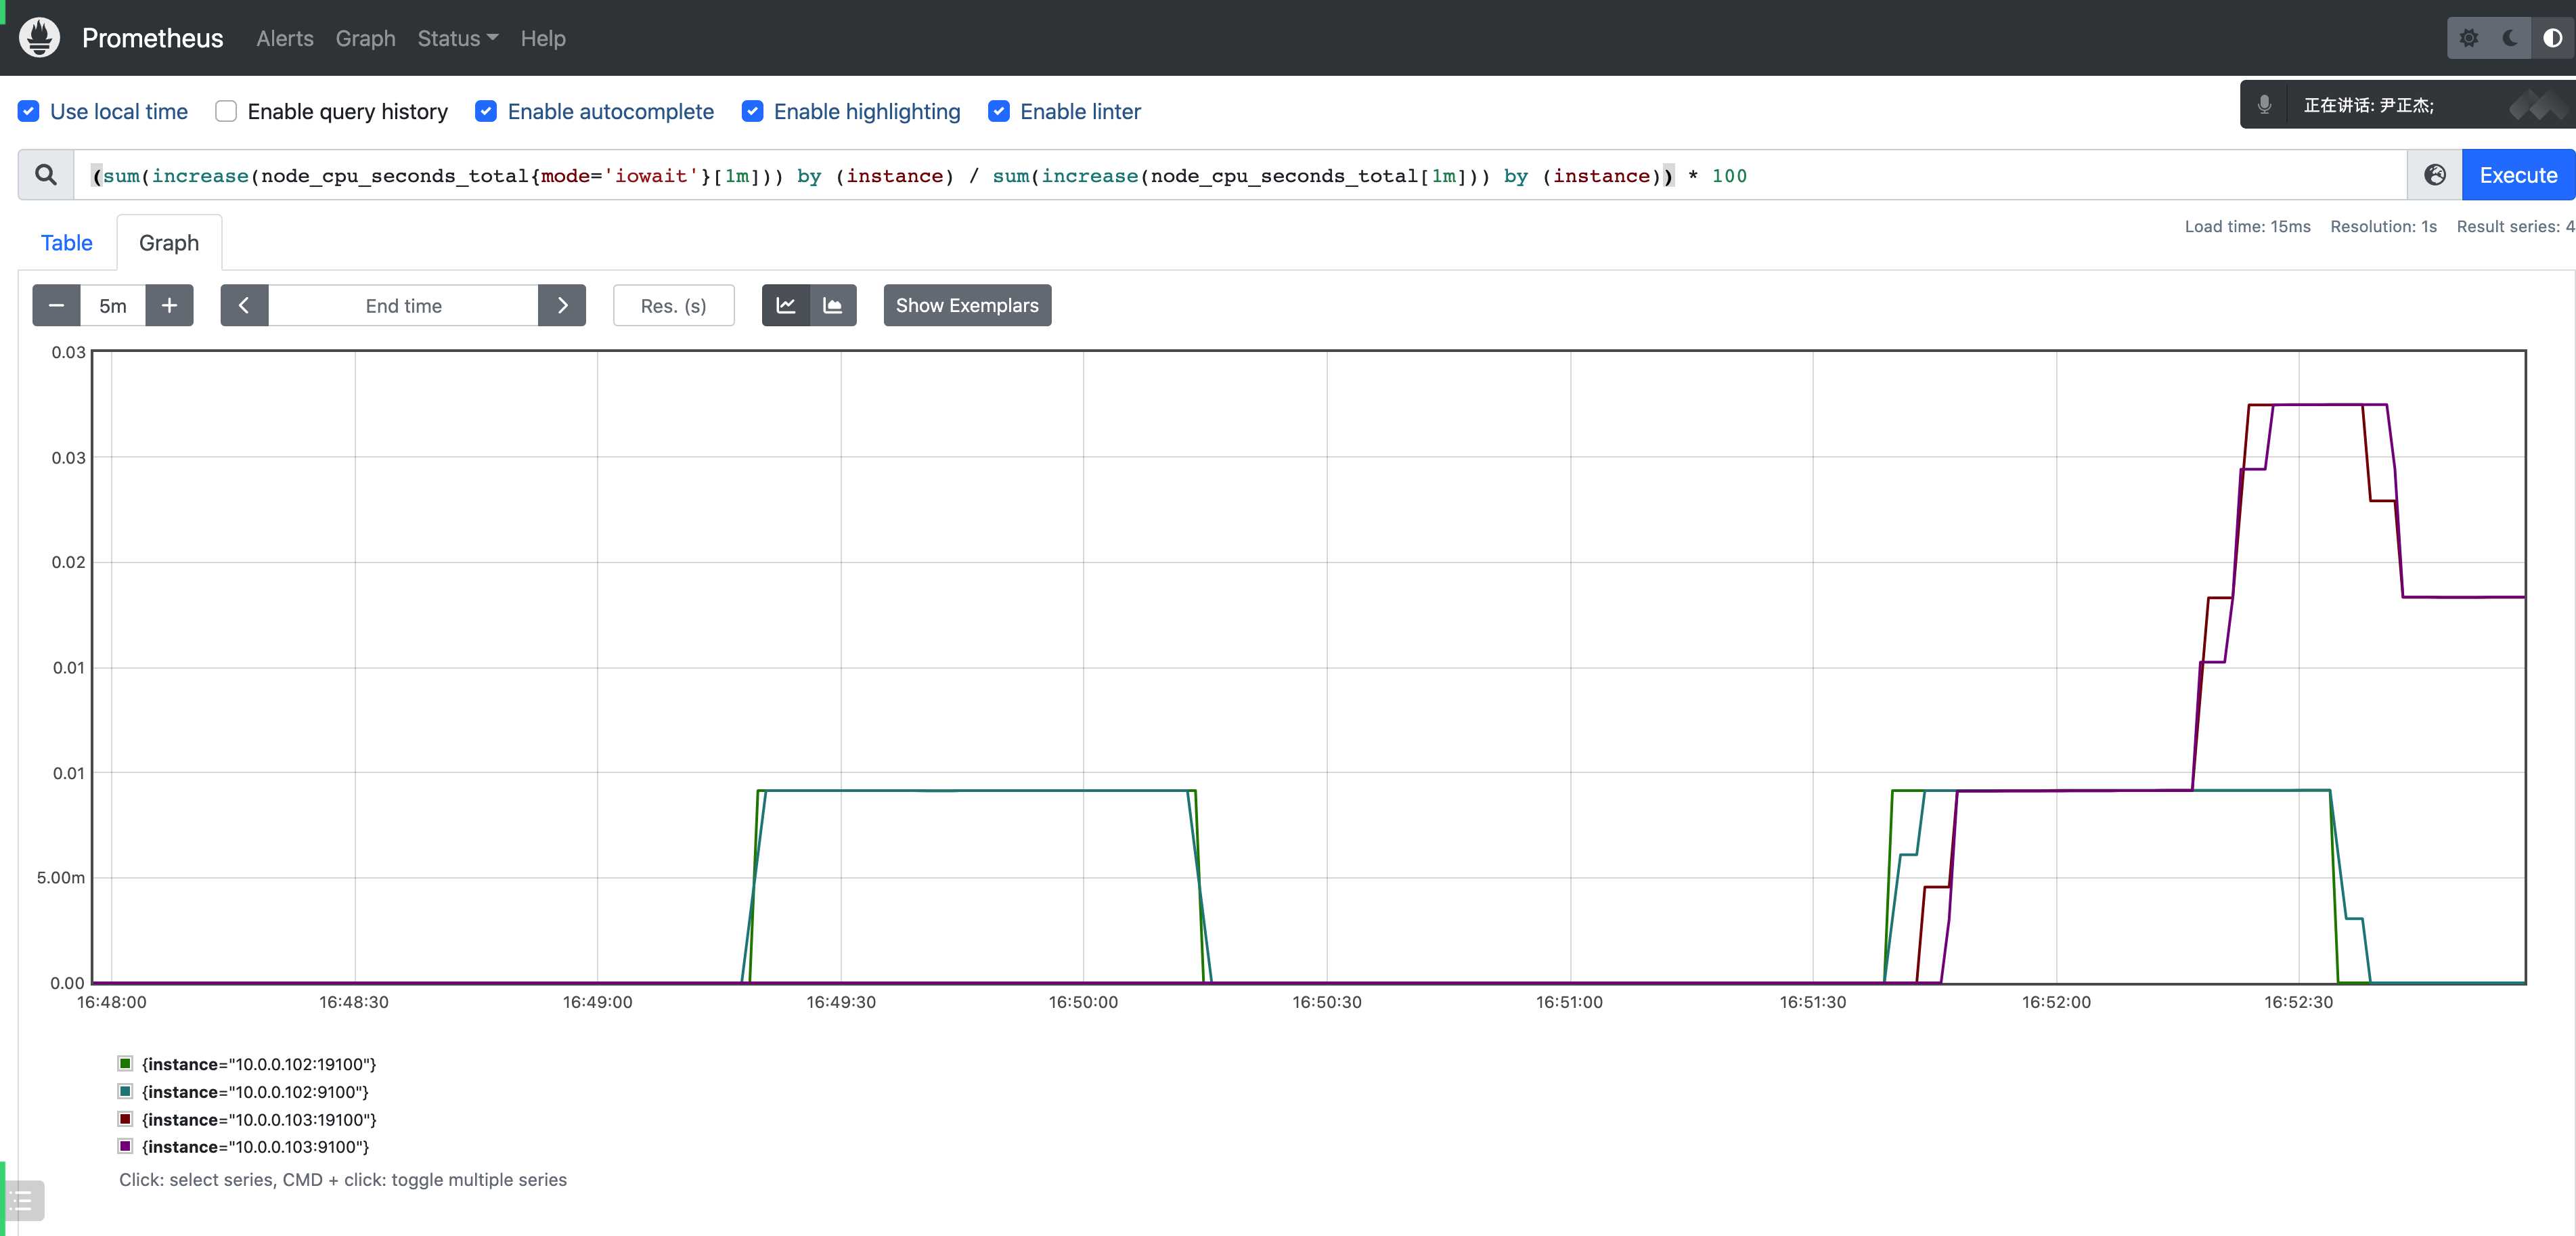
4.4 计算CPU IO等待时间的1分钟内百分比
![]()
(sum(increase(node_cpu_seconds_total{mode='iowait'}[1m])) by (instance) / sum(increase(node_cpu_seconds_total[1m])) by (instance)) * 100
4.5 通过top指令查看CPU
![]()
请自行对比咱们的数据和Linux系统的top命令数据是否有太大的差距。
5.使用Grafana展示数据
5.1.安装grafana
(1)基于rpm方式安装
wget https://dl.grafana.com/enterprise/release/grafana-enterprise-8.5.4-1.x86_64.rpm
sudo yum install grafana-enterprise-8.5.4-1.x86_64.rpm


(2)基于docker方式部署
docker run -d --name=grafana -p 3000:3000 grafana/grafana-enterprise


参考链接:
    https://grafana.com/grafana/download
5.2 展示prometheus数据
![]()
{
  "annotations": {
    "list": [
      {
        "builtIn": 1,
        "datasource": "-- Grafana --",
        "enable": true,
        "hide": true,
        "iconColor": "rgba(0, 211, 255, 1)",
        "name": "Annotations & Alerts",
        "target": {
          "limit": 100,
          "matchAny": false,
          "tags": [],
          "type": "dashboard"
        },
        "type": "dashboard"
      }
    ]
  },
  "editable": true,
  "fiscalYearStartMonth": 0,
  "graphTooltip": 0,
  "id": 1,
  "links": [],
  "liveNow": false,
  "panels": [
    {
      "fieldConfig": {
        "defaults": {
          "color": {
            "mode": "palette-classic"
          },
          "custom": {
            "axisLabel": "",
            "axisPlacement": "auto",
            "barAlignment": 0,
            "drawStyle": "line",
            "fillOpacity": 0,
            "gradientMode": "none",
            "hideFrom": {
              "legend": false,
              "tooltip": false,
              "viz": false
            },
            "lineInterpolation": "stepBefore",
            "lineWidth": 1,
            "pointSize": 5,
            "scaleDistribution": {
              "type": "linear"
            },
            "showPoints": "auto",
            "spanNulls": false,
            "stacking": {
              "group": "A",
              "mode": "none"
            },
            "thresholdsStyle": {
              "mode": "off"
            }
          },
          "mappings": [],
          "thresholds": {
            "mode": "absolute",
            "steps": [
              {
                "color": "green",
                "value": null
              },
              {
                "color": "red",
                "value": 80
              }
            ]
          }
        },
        "overrides": []
      },
      "gridPos": {
        "h": 8,
        "w": 12,
        "x": 0,
        "y": 0
      },
      "id": 8,
      "options": {
        "legend": {
          "calcs": [],
          "displayMode": "table",
          "placement": "right"
        },
        "tooltip": {
          "mode": "single"
        }
      },
      "targets": [
        {
          "datasource": {
            "type": "prometheus",
            "uid": "dvdYgbrnk"
          },
          "exemplar": true,
          "expr": "(sum(increase(node_cpu_seconds_total{mode='iowait'}[1m])) by (instance) / sum(increase(node_cpu_seconds_total[1m])) by (instance)) * 100",
          "interval": "",
          "legendFormat": "",
          "refId": "A"
        }
      ],
      "title": "老男孩教育-IO等待时间",
      "transparent": true,
      "type": "timeseries"
    },
    {
      "description": "",
      "fieldConfig": {
        "defaults": {
          "color": {
            "mode": "palette-classic"
          },
          "custom": {
            "axisLabel": "",
            "axisPlacement": "auto",
            "barAlignment": 0,
            "drawStyle": "line",
            "fillOpacity": 0,
            "gradientMode": "none",
            "hideFrom": {
              "legend": false,
              "tooltip": false,
              "viz": false
            },
            "lineInterpolation": "smooth",
            "lineWidth": 1,
            "pointSize": 5,
            "scaleDistribution": {
              "type": "linear"
            },
            "showPoints": "auto",
            "spanNulls": false,
            "stacking": {
              "group": "A",
              "mode": "none"
            },
            "thresholdsStyle": {
              "mode": "off"
            }
          },
          "mappings": [],
          "thresholds": {
            "mode": "absolute",
            "steps": [
              {
                "color": "green",
                "value": null
              },
              {
                "color": "red",
                "value": 80
              }
            ]
          }
        },
        "overrides": []
      },
      "gridPos": {
        "h": 9,
        "w": 12,
        "x": 12,
        "y": 0
      },
      "id": 2,
      "options": {
        "legend": {
          "calcs": [],
          "displayMode": "table",
          "placement": "right"
        },
        "tooltip": {
          "mode": "single"
        }
      },
      "targets": [
        {
          "datasource": {
            "type": "prometheus",
            "uid": "dvdYgbrnk"
          },
          "exemplar": true,
          "expr": "(1 - sum(increase(node_cpu_seconds_total{mode='idle'}[1h])) by (instance) / sum(increase(node_cpu_seconds_total[1h])) by (instance)) * 100",
          "interval": "",
          "legendFormat": "",
          "refId": "A"
        }
      ],
      "title": "老男孩教育-CPU使用率",
      "transparent": true,
      "type": "timeseries"
    },
    {
      "fieldConfig": {
        "defaults": {
          "color": {
            "mode": "palette-classic"
          },
          "custom": {
            "axisLabel": "",
            "axisPlacement": "auto",
            "barAlignment": 0,
            "drawStyle": "line",
            "fillOpacity": 0,
            "gradientMode": "none",
            "hideFrom": {
              "legend": false,
              "tooltip": false,
              "viz": false
            },
            "lineInterpolation": "linear",
            "lineWidth": 1,
            "pointSize": 5,
            "scaleDistribution": {
              "type": "linear"
            },
            "showPoints": "auto",
            "spanNulls": false,
            "stacking": {
              "group": "A",
              "mode": "none"
            },
            "thresholdsStyle": {
              "mode": "off"
            }
          },
          "mappings": [],
          "thresholds": {
            "mode": "absolute",
            "steps": [
              {
                "color": "green",
                "value": null
              },
              {
                "color": "red",
                "value": 80
              }
            ]
          }
        },
        "overrides": []
      },
      "gridPos": {
        "h": 8,
        "w": 12,
        "x": 0,
        "y": 8
      },
      "id": 6,
      "options": {
        "legend": {
          "calcs": [],
          "displayMode": "table",
          "placement": "right"
        },
        "tooltip": {
          "mode": "single"
        }
      },
      "targets": [
        {
          "datasource": {
            "type": "prometheus",
            "uid": "dvdYgbrnk"
          },
          "exemplar": true,
          "expr": "(sum(increase(node_cpu_seconds_total{mode='system'}[1m])) by (instance) / sum(increase(node_cpu_seconds_total[1m])) by (instance)) * 100",
          "interval": "",
          "legendFormat": "",
          "refId": "A"
        }
      ],
      "title": "老男孩教育-内核态使用率",
      "transparent": true,
      "type": "timeseries"
    },
    {
      "fieldConfig": {
        "defaults": {
          "color": {
            "mode": "palette-classic"
          },
          "custom": {
            "axisLabel": "",
            "axisPlacement": "auto",
            "barAlignment": 0,
            "drawStyle": "line",
            "fillOpacity": 0,
            "gradientMode": "none",
            "hideFrom": {
              "legend": false,
              "tooltip": false,
              "viz": false
            },
            "lineInterpolation": "linear",
            "lineWidth": 1,
            "pointSize": 5,
            "scaleDistribution": {
              "type": "linear"
            },
            "showPoints": "auto",
            "spanNulls": false,
            "stacking": {
              "group": "A",
              "mode": "none"
            },
            "thresholdsStyle": {
              "mode": "off"
            }
          },
          "mappings": [],
          "thresholds": {
            "mode": "absolute",
            "steps": [
              {
                "color": "green",
                "value": null
              },
              {
                "color": "red",
                "value": 80
              }
            ]
          }
        },
        "overrides": []
      },
      "gridPos": {
        "h": 8,
        "w": 12,
        "x": 12,
        "y": 9
      },
      "id": 4,
      "options": {
        "legend": {
          "calcs": [],
          "displayMode": "table",
          "placement": "right"
        },
        "tooltip": {
          "mode": "single"
        }
      },
      "targets": [
        {
          "datasource": {
            "type": "prometheus",
            "uid": "dvdYgbrnk"
          },
          "exemplar": true,
          "expr": "(sum(increase(node_cpu_seconds_total{mode='user'}[1m])) by (instance) / sum(increase(node_cpu_seconds_total[1m])) by (instance)) * 100",
          "interval": "",
          "legendFormat": "",
          "refId": "A"
        }
      ],
      "title": "老男孩教育-CPU的用户态使用率",
      "transparent": true,
      "type": "timeseries"
    }
  ],
  "schemaVersion": 34,
  "style": "dark",
  "tags": [],
  "templating": {
    "list": []
  },
  "time": {
    "from": "now-30m",
    "to": "now"
  },
  "timepicker": {},
  "timezone": "",
  "title": "老男孩教育-CPU使用情况",
  "uid": "GahWkx97z",
  "version": 4,
  "weekStart": ""
}
五.pushgateway实战
1.pushgateway概述
什么是pushgateway:
    它是一种采用被动推送(push)的方式获取监控数据的prometheus插件。

下载地址:
    https://prometheus.io/download/
2.部署pushgateway组件
![]()
    (1)解压软件包
tar xf pushgateway-1.4.3.linux-amd64.tar.gz -C /oldboyedu/softwares/

    (2)编写启动脚本
cat > /usr/lib/systemd/system/pushgateway.service <<'EOF'
[Unit]
Description=Oldboyedu Linux80 pushgateway daemon
After=network.target

[Service]
ExecStart=/oldboyedu/softwares/pushgateway-1.4.3.linux-amd64/pushgateway \
          --web.listen-address=:9091 \
          --log.level=info

[Install]
WantedBy=multi-user.target
EOF
systemctl daemon-reload
systemctl restart pushgateway
systemctl status pushgateway

    (3)访问WebUI
如上图所示。
3.使用pushgatway组件
(1)修改prometheus server监控pushgatway组件
vim /oldboyedu/softwares/prometheus-2.36.0.linux-amd64/prometheus.yml
...
scrape_configs:
  ...
  - job_name: "oldboyedu-linux80-pushgateway"
    static_configs:
      - targets: ["10.0.0.103:9091"]


(2)编写脚本
cat > oldboyedu_tcp_conn.sh <<'EOF'
#!/bin/bash

INSTANCE_NAME=`hostname -s`

if [ $INSTANCE_NAME == "localhost" ]
    then
        echo "Must FQDN hostname"
        exit
fi

METRICS_NAME="oldboyedu_linux_tcp_conn"

OLDBOYEDU_TCP_CONN_NUMBER=`netstat -an| grep -i connected  | wc -l`

echo "$METRICS_NAME $OLDBOYEDU_TCP_CONN_NUMBER" | curl --data-binary @- \
      http://10.0.0.103:9091/metrics/job/oldboyedu_linux/instance/$INSTANCE_NAME
EOF
六.prometheus监控docker容器
1.在grafana仪表盘中自定义变量案例
1.1 启动Prometheus相关容器
![]()
(1)启动prometheus server
docker run -dp 9090:9090 --restart always --name oldboyedu_linux_prometheus_server prom/prometheus:v2.36.0


(2)启动node-exporter
docker run -dp 9100:9100 --restart always --name oldboyedu_linux_pushgateway prom/node-exporter:v1.3.1


(3)启动cadvisor
docker run --volume=/:/rootfs:ro  --volume=/var/run:/var/run:rw --volume=/sys:/sys:ro --volume=/var/lib/docker/:/var/lib/docker:ro  --publish=8080:8080 --detach=true --name=cadvisor google/cadvisor:v0.33.0


(4)修改配置prometheus server的配置文件
docker container exec -it oldboyedu_linux_prometheus_server sh
$ vim /etc/prometheus/prometheus.yml
...
scrape_configs:
  ....
  - job_name: "oldboyedu-linux80-node_exporter"
    static_configs:
      - targets: ["10.0.0.102:9100","10.0.0.103:9100"]

  - job_name: "oldboyedu-linux80-node_cadvisor"
    static_configs:
      - targets: ["10.0.0.102:8080","10.0.0.103:8080"]

(5)重启prometheus server容器使得配置生效并查看WebUI,如上图所示。
docker restart oldboyedu_linux_prometheus_server
1.2 使用granfa查看容器监控并添加仪表盘
(1)启动grafana容器
docker run  --name=grafana -dp 3000:3000 --restart always grafana/grafana-enterprise

(2)手动定制PQL
参考PQL:
    container_memory_usage_bytes{image!="",name="cadvisor"}
    container_memory_max_usage_bytes{image!="",name="cadvisor"}
    container_start_time_seconds{image!="",name="cadvisor"}
    container_fs_inodes_total{image != "", name="cadvisor"}
    container_network_receive_bytes_total{image != "", name="cadvisor"}
    container_network_transmit_packets_total{image != "", name="cadvisor"}

优秀模板的参考:
优秀模板的参考:
    count(container_last_seen{image!=""})
        监控有多少个容器。

    sum(container_memory_usage_bytes{image!=""})/1024/1024
        监控容器总的使用内存,并换算成MB。

    time() - process_start_time_seconds{job="prometheus"}
        查询Prometheus启动的时间,dashboard选择"Stat"类型。

    (sum(node_memory_MemTotal_bytes) - sum(node_memory_MemFree_bytes +node_memory_Buffers_bytes + node_memory_Cached_bytes) ) / sum(node_memory_MemTotal_bytes) * 100
        查询内存的使用率,dashboard选择"Gauge"类型。

    sum(sum by (container_name)( rate(container_cpu_usage_seconds_total[1m] ) )) / count(node_cpu_seconds_total{mode="system"}) * 100
        查询CPU的使用率,dashboard选择"Gauge"类型。

    sum(up)
        查询有多少个监控目标在线,dashboard选择"Stat"类型。


(3)添加数据并设置仪表盘
略,见视频。

温馨提示:
    (1)凡事容器的指标,其image标签的值肯定不为空;
    (2)手动配置granfa图表,比较麻烦,建议直接使用别人制作好的仪表盘;
1.3 在仪表盘中自定义变量案例
![]()
(1)打开某个仪表盘后,点击设置按钮;
(2)点击"Variables",而后点击"Add variable";
(3)如上图所示,依次设置如下信息,添加自定义变量"oldboyedu_linux80",配置后点击"Update"
1)General配置:
Name: oldboyedu_linux80
Label: 老男孩教育-请选择监控节点
2)Query Options
Data source: Prometheus数据源
Query: label_values(up,instance)
(4)点击"Save dashboard",继续查看Dashboard,如下图所示;
(5)选择一个图标,并点击"Edit",在标签选择中加入{...,instance="$oldboyedu_linux80"}即可.
我们只需要在PQL语句中加入instance="$oldboyedu_linux80"即可,但是oldboyedu_linux80是grafana的自定义变量哟.
(6)验证配置是否剩下,如上图图所示。
参考配置:
{
"annotations": {
"list": [
{
"builtIn": 1,
"datasource": "-- Grafana --",
"enable": true,
"hide": true,
"iconColor": "rgba(0, 211, 255, 1)",
"name": "Annotations & Alerts",
"target": {
"limit": 100,
"matchAny": false,
"tags": [],
"type": "dashboard"
},
"type": "dashboard"
}
]
},
"editable": true,
"fiscalYearStartMonth": 0,
"graphTooltip": 0,
"id": 1,
"iteration": 1654139753349,
"links": [],
"liveNow": false,
"panels": [
{
"fieldConfig": {
"defaults": {
"color": {
"mode": "palette-classic"
},
"custom": {
"axisLabel": "",
"axisPlacement": "auto",
"barAlignment": 0,
"drawStyle": "line",
"fillOpacity": 0,
"gradientMode": "none",
"hideFrom": {
"legend": false,
"tooltip": false,
"viz": false
},
"lineInterpolation": "linear",
"lineWidth": 1,
"pointSize": 5,
"scaleDistribution": {
"type": "linear"
},
"showPoints": "auto",
"spanNulls": false,
"stacking": {
"group": "A",
"mode": "none"
},
"thresholdsStyle": {
"mode": "off"
}
},
"mappings": [],
"thresholds": {
"mode": "absolute",
"steps": [
{
"color": "green",
"value": null
},
{
"color": "red",
"value": 80
}
]
}
},
"overrides": []
},
"gridPos": {
"h": 8,
"w": 12,
"x": 0,
"y": 0
},
"id": 12,
"options": {
"legend": {
"calcs": [],
"displayMode": "list",
"placement": "bottom"
},
"tooltip": {
"mode": "single"
}
},
"targets": [
{
"datasource": {
"type": "prometheus",
"uid": "Gz0Qu-r7k"
},
"exemplar": true,
"expr": "container_network_transmit_packets_total{image != \"\", name=\"cadvisor\",instance=\"$oldboyedu_linux80\"}",
"interval": "",
"legendFormat": "",
"refId": "A"
}
],
"title": "container_network_transmit_packets_total",
"transparent": true,
"type": "timeseries"
},
{
"fieldConfig": {
"defaults": {
"color": {
"mode": "palette-classic"
},
"custom": {
"axisLabel": "",
"axisPlacement": "auto",
"barAlignment": 0,
"drawStyle": "line",
"fillOpacity": 0,
"gradientMode": "none",
"hideFrom": {
"legend": false,
"tooltip": false,
"viz": false
},
"lineInterpolation": "linear",
"lineWidth": 1,
"pointSize": 5,
"scaleDistribution": {
"type": "linear"
},
"showPoints": "auto",
"spanNulls": false,
"stacking": {
"group": "A",
"mode": "none"
},
"thresholdsStyle": {
"mode": "off"
}
},
"mappings": [],
"thresholds": {
"mode": "absolute",
"steps": [
{
"color": "green",
"value": null
},
{
"color": "red",
"value": 80
}
]
}
},
"overrides": []
},
"gridPos": {
"h": 8,
"w": 12,
"x": 12,
"y": 0
},
"id": 4,
"options": {
"legend": {
"calcs": [],
"displayMode": "list",
"placement": "bottom"
},
"tooltip": {
"mode": "single"
}
},
"targets": [
{
"datasource": {
"type": "prometheus",
"uid": "Gz0Qu-r7k"
},
"exemplar": true,
"expr": "container_start_time_seconds{image != \"\", name=\"cadvisor\",instance=\"$oldboyedu_linux80\"}",
"interval": "",
"legendFormat": "",
"refId": "A"
}
],
"title": "container_start_time_seconds",
"transparent": true,
"type": "timeseries"
},
{
"fieldConfig": {
"defaults": {
"color": {
"mode": "palette-classic"
},
"custom": {
"axisLabel": "",
"axisPlacement": "auto",
"barAlignment": 0,
"drawStyle": "line",
"fillOpacity": 0,
"gradientMode": "none",
"hideFrom": {
"legend": false,
"tooltip": false,
"viz": false
},
"lineInterpolation": "linear",
"lineWidth": 1,
"pointSize": 5,
"scaleDistribution": {
"type": "linear"
},
"showPoints": "auto",
"spanNulls": false,
"stacking": {
"group": "A",
"mode": "none"
},
"thresholdsStyle": {
"mode": "off"
}
},
"mappings": [],
"thresholds": {
"mode": "absolute",
"steps": [
{
"color": "green",
"value": null
},
{
"color": "red",
"value": 80
}
]
}
},
"overrides": []
},
"gridPos": {
"h": 8,
"w": 12,
"x": 0,
"y": 8
},
"id": 10,
"options": {
"legend": {
"calcs": [],
"displayMode": "list",
"placement": "bottom"
},
"tooltip": {
"mode": "single"
}
},
"targets": [
{
"datasource": {
"type": "prometheus",
"uid": "Gz0Qu-r7k"
},
"exemplar": true,
"expr": "container_network_receive_bytes_total{image != \"\", name=\"cadvisor\",instance=\"$oldboyedu_linux80\"}",
"interval": "",
"legendFormat": "",
"refId": "A"
}
],
"title": "container_network_receive_bytes_total",
"transparent": true,
"type": "timeseries"
},
{
"description": "",
"fieldConfig": {
"defaults": {
"color": {
"mode": "palette-classic"
},
"custom": {
"axisLabel": "",
"axisPlacement": "auto",
"barAlignment": 0,
"drawStyle": "line",
"fillOpacity": 0,
"gradientMode": "none",
"hideFrom": {
"legend": false,
"tooltip": false,
"viz": false
},
"lineInterpolation": "linear",
"lineWidth": 1,
"pointSize": 5,
"scaleDistribution": {
"type": "linear"
},
"showPoints": "auto",
"spanNulls": false,
"stacking": {
"group": "A",
"mode": "none"
},
"thresholdsStyle": {
"mode": "off"
}
},
"mappings": [],
"thresholds": {
"mode": "absolute",
"steps": [
{
"color": "green",
"value": null
},
{
"color": "red",
"value": 80
}
]
}
},
"overrides": []
},
"gridPos": {
"h": 9,
"w": 12,
"x": 12,
"y": 8
},
"id": 2,
"options": {
"legend": {
"calcs": [],
"displayMode": "table",
"placement": "bottom"
},
"tooltip": {
"mode": "single"
}
},
"targets": [
{
"datasource": {
"type": "prometheus",
"uid": "Gz0Qu-r7k"
},
"exemplar": true,
"expr": "container_memory_usage_bytes{image != \"\", name=\"cadvisor\",instance=\"$oldboyedu_linux80\"}",
"interval": "",
"legendFormat": "",
"refId": "A"
}
],
"title": "container_memory_usage_bytes",
"transparent": true,
"type": "timeseries"
},
{
"fieldConfig": {
"defaults": {
"color": {
"mode": "palette-classic"
},
"custom": {
"axisLabel": "",
"axisPlacement": "auto",
"barAlignment": 0,
"drawStyle": "line",
"fillOpacity": 0,
"gradientMode": "none",
"hideFrom": {
"legend": false,
"tooltip": false,
"viz": false
},
"lineInterpolation": "linear",
"lineWidth": 1,
"pointSize": 5,
"scaleDistribution": {
"type": "linear"
},
"showPoints": "auto",
"spanNulls": false,
"stacking": {
"group": "A",
"mode": "none"
},
"thresholdsStyle": {
"mode": "off"
}
},
"mappings": [],
"thresholds": {
"mode": "absolute",
"steps": [
{
"color": "green",
"value": null
},
{
"color": "red",
"value": 80
}
]
}
},
"overrides": []
},
"gridPos": {
"h": 8,
"w": 12,
"x": 0,
"y": 16
},
"id": 8,
"options": {
"legend": {
"calcs": [],
"displayMode": "list",
"placement": "bottom"
},
"tooltip": {
"mode": "single"
}
},
"targets": [
{
"datasource": {
"type": "prometheus",
"uid": "Gz0Qu-r7k"
},
"exemplar": true,
"expr": "container_fs_inodes_total{image != \"\", name=\"cadvisor\",instance=\"$oldboyedu_linux80\"}",
"interval": "",
"legendFormat": "",
"refId": "A"
}
],
"title": "container_fs_inodes_total",
"transparent": true,
"type": "timeseries"
},
{
"fieldConfig": {
"defaults": {
"color": {
"mode": "palette-classic"
},
"custom": {
"axisLabel": "",
"axisPlacement": "auto",
"barAlignment": 0,
"drawStyle": "line",
"fillOpacity": 0,
"gradientMode": "none",
"hideFrom": {
"legend": false,
"tooltip": false,
"viz": false
},
"lineInterpolation": "linear",
"lineWidth": 1,
"pointSize": 5,
"scaleDistribution": {
"type": "linear"
},
"showPoints": "auto",
"spanNulls": false,
"stacking": {
"group": "A",
"mode": "none"
},
"thresholdsStyle": {
"mode": "off"
}
},
"mappings": [],
"thresholds": {
"mode": "absolute",
"steps": [
{
"color": "green",
"value": null
},
{
"color": "red",
"value": 80
}
]
}
},
"overrides": []
},
"gridPos": {
"h": 8,
"w": 12,
"x": 12,
"y": 17
},
"id": 6,
"options": {
"legend": {
"calcs": [],
"displayMode": "list",
"placement": "bottom"
},
"tooltip": {
"mode": "single"
}
},
"targets": [
{
"datasource": {
"type": "prometheus",
"uid": "Gz0Qu-r7k"
},
"exemplar": true,
"expr": "container_memory_max_usage_bytes{image != \"\", name=\"cadvisor\",instance=\"$oldboyedu_linux80\"}",
"interval": "",
"legendFormat": "",
"refId": "A"
}
],
"title": "container_memory_max_usage_bytes",
"transparent": true,
"type": "timeseries"
}
],
"schemaVersion": 34,
"style": "dark",
"tags": [],
"templating": {
"list": [
{
"current": {
"selected": false,
"text": "10.0.0.102:8080",
"value": "10.0.0.102:8080"
},
"definition": "label_values(up,instance)",
"hide": 0,
"includeAll": false,
"label": "老男孩教育-请选择监控节点",
"multi": false,
"name": "oldboyedu_linux80",
"options": [],
"query": {
"query": "label_values(up,instance)",
"refId": "StandardVariableQuery"
},
"refresh": 1,
"regex": "",
"skipUrlSync": false,
"sort": 0,
"type": "query"
}
]
},
"time": {
"from": "now-30m",
"to": "now"
},
"timepicker": {},
"timezone": "",
"title": "老男孩教育-Linux80-容器指标监控",
"uid": "rUX2r-9nk",
"version": 3,
"weekStart": ""
}
2.使用官方的仪表盘
比较不错的仪表盘ID:
    179
    193
    395
    893
    10566
    10619
    11600


参考链接:
    https://grafana.com/grafana/dashboards/179
    https://grafana.com/grafana/dashboards/193
    https://grafana.com/grafana/dashboards/395
    https://grafana.com/grafana/dashboards/893
    https://grafana.com/grafana/dashboards/10566
    https://grafana.com/grafana/dashboards/10619
    https://grafana.com/grafana/dashboards/11600


推荐阅读:
    https://grafana.com/grafana/dashboards/
3.grafana图表不出数据场景问题分析
(1)客户端和Prometheus时间不同步;
(2)PQL写的有问题;
(3)Prometheus Server没有数据。
4.为第三方仪表盘设置变量
![]()
(1)打开某个仪表盘后,点击设置按钮;
(2)点击"Variables",而后点击"Add variable";
(3)如上图所示,依次设置如下信息,添加自定义变量"oldboyedu_name",配置后点击"Update"
    1)General配置:
        Name: oldboyedu_name
        Label: 选择监控节点

    2)Query Options
        Data source: Prometheus数据源
        Query: label_values(up,instance)

(4)点击"Save dashboard",继续查看Dashboard,如下图所示;
(5)选择一个图标,并点击"Edit",在标签选择中加入{...,instance="$oldboyedu_name"}即可.
    我们只需要在PQL语句中加入instance="$oldboyedu_name"即可,但是oldboyedu_name是grafana的自定义变量哟.
(6)验证配置是否剩下,如下图所示。
![]()
5.实现grafana告警功能
课后作业。
七.altermanager实战案例
1.alertmanager概述
什么是alertmanager:
    它是一种实现报警功能的prometheus插件。

下载地址:
    https://prometheus.io/download/#alertmanager
2.部署alertmanager
(1)启动alertmanager容器
docker  run -dp 9093:9093 --restart always --name oldboyedu_linux_alertmanager prom/alertmanager:v0.24.0


(2)修改alertmanager的配置文件
docker container exec -it oldboyedu_linux_alertmanager sh
$ cat > /etc/alertmanager/alertmanager.yml <<'EOF'
global:
  resolve_timeout: 5m
  smtp_from: 'y1053419035@qq.com'
  smtp_smarthost: 'smtp.qq.com:465'
  smtp_auth_username: 'y1053419035@qq.com'
  smtp_auth_password: 'nvkhwupusuxubefe'
  smtp_require_tls: false
  smtp_hello: 'qq.com'
route:
  group_by: ['alertname']
  group_wait: 5s
  group_interval: 5s
  repeat_interval: 5m
  receiver: 'email'
receivers:
- name: 'email'
  email_configs:
  - to: 'y1053419035@qq.com'
    send_resolved: true
inhibit_rules:
  - source_match:
      severity: 'critical'
    target_match:
      severity: 'warning'
    equal: ['alertname', 'dev', 'instance']
EOF


相关参数说明:
global:
  resolve_timeout:
    解析超时时间。
  smtp_from:
    发件人邮箱地址。
  smtp_smarthost:
    邮箱的服务器的地址及端口,例如:  'smtp.qq.com:465'。
  smtp_auth_username:
    发送人的邮箱用户名。
  smtp_auth_password:
    发送人的邮箱密码。
  smtp_require_tls:
    是否基于tls加密。
  smtp_hello:
    邮箱服务器,例如: 'qq.com'。
route:
  group_by: ['alertname']
  group_wait: 5s
  group_interval: 5s
  repeat_interval:
    重复报警的间隔时间,如果没有解即报警问题,则会间隔指定时间一直触发报警,比如:5m。
  receiver:
    采用什么方式接收报警,例如'email'。
receivers:
- name:
    定义接收者的名称,注意这里的name要和上面的route对应,例如: 'email'
  email_configs:
  - to:
    邮箱发给谁。
    send_resolved: true
inhibit_rules:
  - source_match:
      severity:
        匹配报警级别,例如: 'critical'。
    target_match:
      severity: 'warning'
    equal: ['alertname', 'dev', 'instance']


(3)重启容器,使得配置文件生效
docker  restart oldboyedu_linux_alertmanager


温馨提示:
    163邮箱修改授权码步骤很简单,依次点击"设置" ---> "POP3/SMTP/IMAP" ---> "新增授权密码"


温馨提示:
    我的授权码已经更改了,每次讲课需要重新获取最新的授权码哟!!
3.配置prometheus server监控alertmanager
![]()
(1)配置alertmanager服务器及规则文件名称
vi /etc/prometheus/prometheus.yml
...
alerting:
  alertmanagers:
    - static_configs:
        - targets:
          - 10.0.0.102:9093

rule_files:
    - "oldboyedu_linux80_rules.yml"
...


(2)添加规则
cat > /etc/prometheus/oldboyedu_linux80_rules.yml <<'EOF'
groups:
- name: oldboyedu-linux80-container-runtime
  rules:
  - alert: oldboyedu-container-容器挂啦
    expr: up{instance="10.0.0.103:9100"} == 0
    for: 15s
    labels:
      school: oldboyedu
      class: linux80
    annotations:
      summary: "{{ $labels.instance }} 已停止运行超过 15s!"
  - alert: oldboyedu-container-容器挂啦-2022
    expr: up{instance="10.0.0.102:9100"} == 0
    for: 5s
    labels:
      school: oldboyedu
      class: linux80
    annotations:
      summary: "{{ $labels.instance }} 已停止运行超过 15s!"
EOF


(3)重启prometheus服务器
docker restart oldboyedu_linux_prometheus_server


(4)查看webUI
如上图所示,访问"http://10.0.0.101:9090/rules"即可。


(5)测试验证告警功能是否生效
停止容器测试即可。
八.今日作业
(1)完成课堂的所有练习;
(2)使用"consul"实现prometheus的自动监控功能;
(3)使用prometheus监控TCP的11种状态,并使用granfa展示这些状态,并实现邮件告警功能。
(4)使用promethues监控docker容器;




 浙公网安备 33010602011771号