Python爬取北京数据分析岗位现状进行数据分析
一、选题背景
我们正在逐步走向5G时代,更快的网络传输速度、更多的连接、更多的数据采集设备,随之而来的便是海量的数据。在此大背景下,越来越多的企业开始重视数据,想要从中探索信息、知识、智慧,以更好地指导企业的运行,相关的岗位也变得越来越热门。
本项目通过对拉勾网北京地区数据分析相关岗位的分析,研究岗位需求情况(如招聘人数&最低学历要求);岗位薪资的影响因素等关系。
二、北京数据分析岗位现状数据的爬取及分析设计方案
通过Python在拉钩网上进行北京地区数据分析相关岗位的岗位信息爬取

三、数据分析步骤
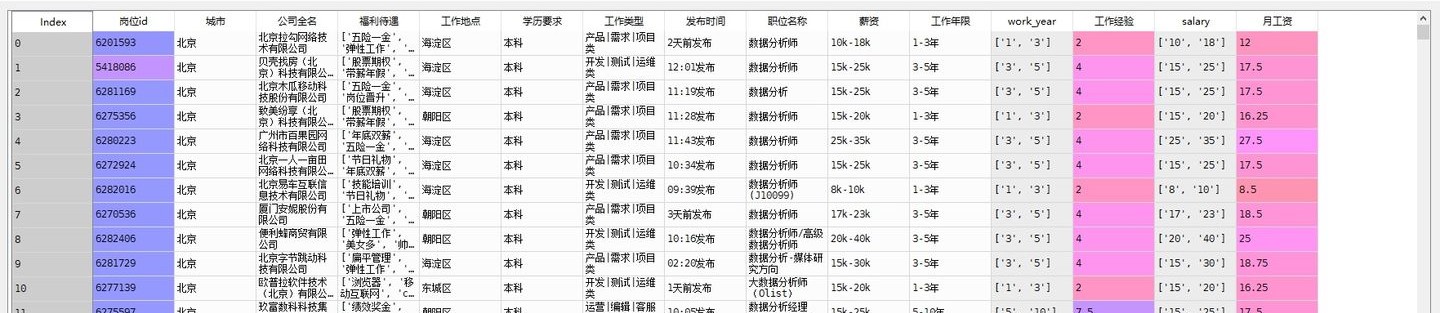
1、数据爬取与采集
导入需要用到的库
1 import json
2 import requests
3 import csv
4 import time
对想要爬取的内容进行爬虫
 1 def get_json(url, datas):
 2     my_headers = {
 3         "User-Agent": "Mozilla/5.0 (Macintosh; Intel Mac OS X 10_13_6) AppleWebKit/537.36 (KHTML, like Gecko) Chrome/72.0.3626.119 Safari/537.36",
 4         "Referer": "https://www.lagou.com/jobs/list_%E6%95%B0%E6%8D%AE%E5%88%86%E6%9E%90?labelWords=&fromSearch=true&suginput=",
 5         "Content-Type": "application/x-www-form-urlencoded;charset = UTF-8"
 6     }
 7     time.sleep(10)
 8     ses = requests.session()  # 获取session
 9     ses.headers.update(my_headers)  # 更新
10     ses.get(
11         "https://www.lagou.com/jobs/list_%E6%95%B0%E6%8D%AE%E5%88%86%E6%9E%90?labelWords=&fromSearch=true&suginput=")
12     content = ses.post(url=url, data=datas)
13     result = content.json()
14     info = result['content']['positionResult']['result']
15     info_list = []
16     for job in info:
17         information = []
18         information.append(job['positionId'])  # 岗位对应ID
19         information.append(job['city'])  # 岗位对应城市
20         information.append(job['companyFullName'])  # 公司全名
21         information.append(job['companyLabelList'])  # 福利待遇
22         information.append(job['district'])  # 工作地点
23         information.append(job['education'])  # 学历要求
24         information.append(job['firstType'])  # 工作类型
25         information.append(job['formatCreateTime'])  # 发布时间
26         information.append(job['positionName'])  # 职位名称
27         information.append(job['salary'])  # 薪资
28         information.append(job['workYear'])  # 工作年限
29         info_list.append(information)
30
31     return info_list
32
33
34 def main():
35     page = int(input('请输入你要抓取的页码总数:'))
36
37     title = ['岗位id', '城市', '公司全名', '福利待遇', '工作地点', '学历要求', '工作类型', '发布时间', '职位名称', '薪资', '工作年限']
38     file = open('lagou.csv', 'w', newline='', encoding='utf-8')
39     writer = csv.writer(file)
40     writer.writerow(title)
41
42     for x in range(1, page + 1):
43         url = 'https://www.lagou.com/jobs/positionAjax.json?city=%E5%8C%97%E4%BA%AC&needAddtionalResult=false'
44         datas = {
45             'first': 'false',
46             'pn': x,
47             'kd': '数据分析',
48         }
49         try:
50             infos = get_json(url, datas)
51             for info in infos:
52                 writer.writerow(info)
53             print("第%s页正常采集" % x)
54         except Exception as msg:
55             print("第%s页出现问题" % x)
56             time.sleep(10)
57             infos = get_json(url=url, datas=datas)
58             for info in infos:
59                 writer.writerow(info)
60
61 if __name__ == '__main__':
62     main()
2、对数据进行清理和处理
导入需要用到的库
1 import numpy as np
2 import pandas as pd
3 import matplotlib.pyplot as plt
4 import seaborn as sns
导入模块,读取数据
 1 import warnings
 2 warnings.filterwarnings('ignore')
 3 # 不发出警告
 4 plt.rcParams['font.sans-serif'] = ['SimHei']  # 解决中文显示问题-设置字体为黑体
 5 plt.rcParams['axes.unicode_minus'] = False  # 解决保存图像是负号'-'显示为方块的问题
 6
 7
 8 import jieba
 9 from wordcloud import WordCloud
10 from scipy.misc import imread,imresize
11
12 import os
13 os.chdir('C:/Users/Administrator/Desktop/python数据分析/')
14 # 创建工作路径
15 #读取数据
16 df01 = pd.read_csv('lagou.csv',encoding = 'utf-8')
17 df = df01.copy()
18 #df.drop(df[df['职位名称'].str.contains('实习')].index, inplace=True)
清洗“工作年限”字段,处理月工资字段
 1 #print(df.describe())
 2 # 由于CSV文件内的数据是字符串形式,先用正则表达式将字符串转化为列表,再取区间的均值
 3 pattern = '\d+'
 4 df['work_year'] = df['工作年限'].str.findall(pattern)
 5 # 数据处理后的工作年限
 6 avg_work_year = []
 7 # 工作年限
 8 for i in df['work_year']:
 9    # 如果工作经验为'不限'或'应届毕业生',那么匹配值为空,工作年限为0
10    if len(i) == 0:
11        avg_work_year.append(0)
12    # 如果匹配值为一个数值,那么返回该数值
13    elif len(i) == 1:
14        avg_work_year.append(int(''.join(i)))
15    # 如果匹配值为一个区间,那么取平均值
16    else:
17        num_list = [int(j) for j in i]
18        avg_year = sum(num_list)/2
19        avg_work_year.append(avg_year)
20 df['工作经验'] = avg_work_year
21
22 # 将字符串转化为列表,再取区间的前25%,比较贴近现实
23 df['salary'] = df['薪资'].str.findall(pattern)
24 # 月薪
25 avg_salary = []
26 for k in df['salary']:
27    int_list = [int(n) for n in k]
28    avg_wage = int_list[0]+(int_list[1]-int_list[0])/4
29    avg_salary.append(avg_wage)
30 df['月工资'] = avg_salary
31
32 # 将学历不限的职位要求认定为最低学历:大专\
33 df['学历要求'] = df['学历要求'].replace('不限','大专')
3、数据分析和可视化
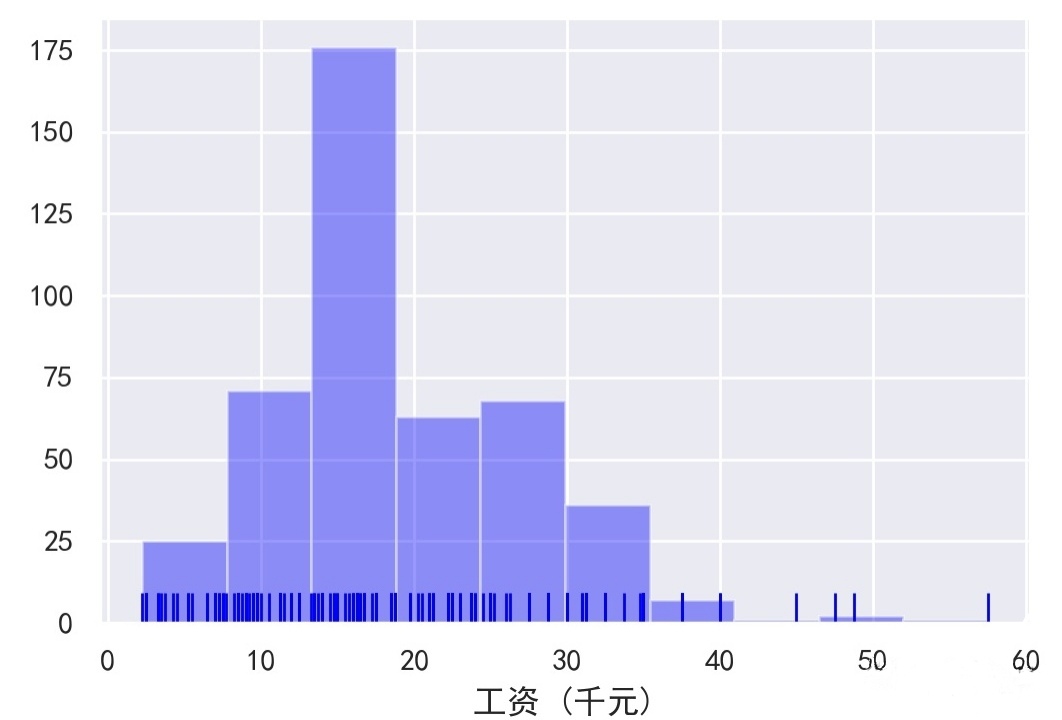
月工资数&数据分析岗位数——Serborn直方图
 1 sns.set()
 2 sns.set_style("ticks")
 3 plt.rcParams['font.sans-serif'] = ['SimHei']  # 中文字体设置-黑体
 4 plt.rcParams['axes.unicode_minus'] = False  # 解决保存图像是负号'-'显示为方块的问题
 5 sns.set(font='SimHei')  # 解决Seaborn中文显示问题
 6
 7
 8
 9 #####x=月工资数,y=数据分析岗位数,薪资直方图
10 sns.distplot(df['月工资'],bins = 10,hist = True,kde = False,norm_hist=False,
11             rug = True,vertical = False,
12             color = 'blue',label = '北京市数据分析薪资',axlabel = '工资 (千元)')
13 plt.savefig('北京市数据分析薪资.jpg', dpi=200)
14 plt.legend()
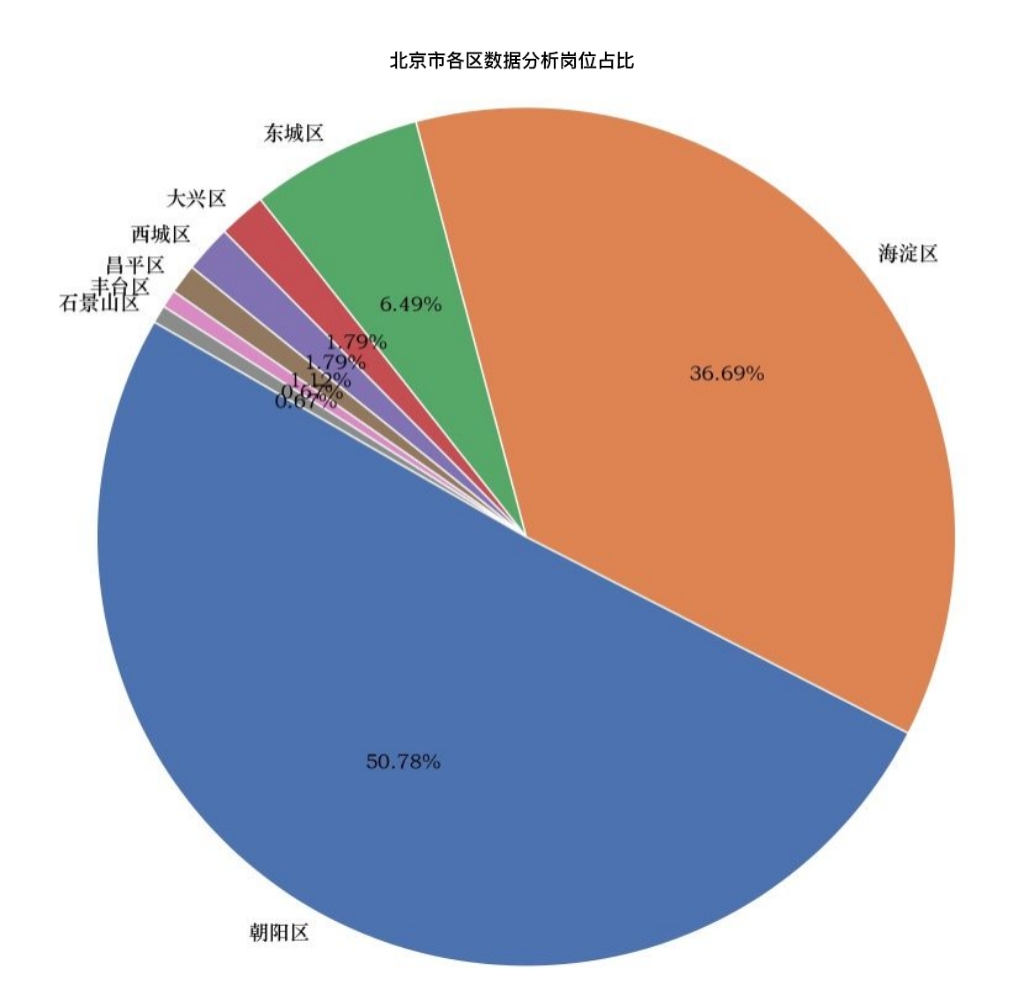
工作地点各区占比——Serborn圆饼图
 1 import matplotlib.font_manager as fm
 2 my_font = fm.FontProperties(fname="C:\windows\Fonts\STZHONGS.TTF")
 3 count = df['工作地点'].value_counts()[:8]
 4 #count = count.loc[['朝阳区', '昌平区', '东城区', '大兴区', '西城区', '海淀区', '石景山区', '通州区', '延庆区']]  # 调整顺序
 5 plt.figure(figsize=(10,10))
 6 plt.pie(count,
 7         labels = count.keys(),
 8         labeldistance=1.05,
 9         autopct='%2.2f%%',
10         pctdistance=0.6,
11         radius=1.5,
12         startangle=150,
13         textprops= {'fontsize':50,'color':'black','fontproperties':my_font}
14         )
15 plt.axis('equal')  # 使饼图为正圆形
16 #plt.legend(loc='upper left', bbox_to_anchor=(-0.1,1))
17 plt.title("北京市各区数据分析岗位占比")
18 plt.savefig('北京市各区数据分析岗位占比.jpg', dpi=200)
19 plt.show()
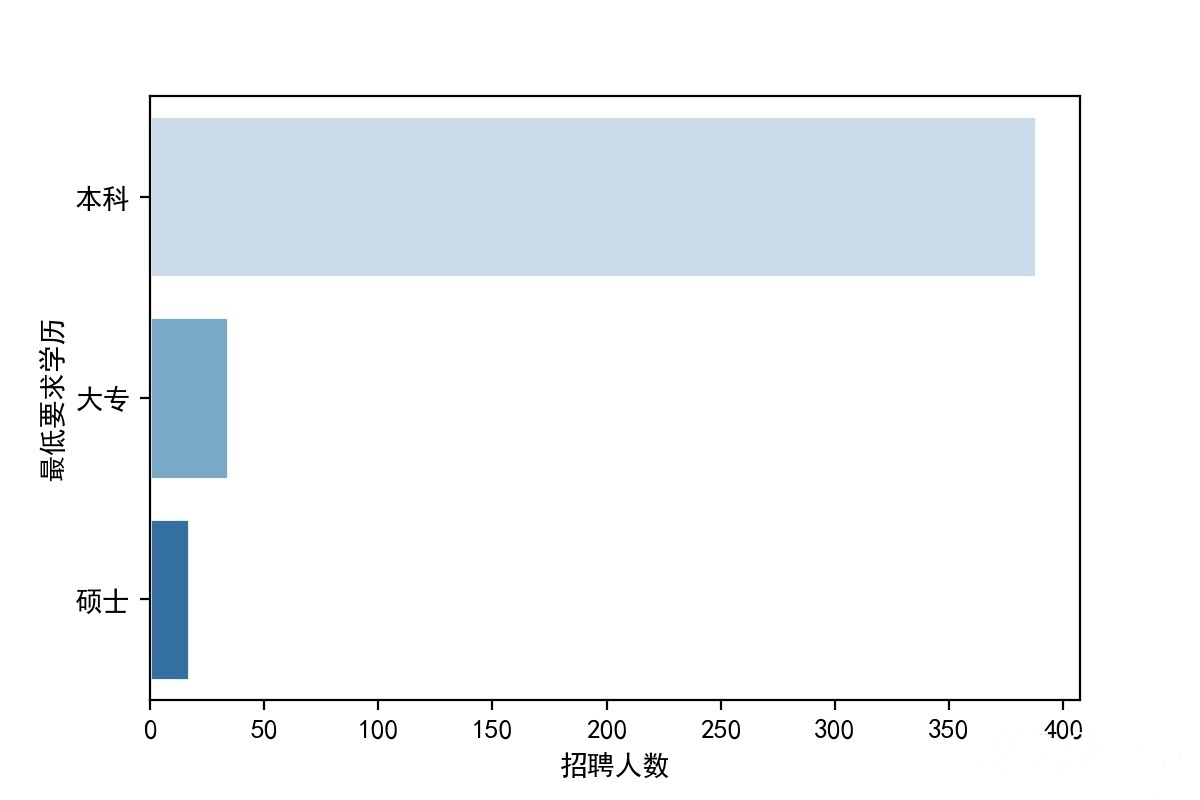
招聘人数&最低学历要求——Serborn条形图
1 #x=招聘人数,y=最低学历要求
2
3 dfxlyq = df['学历要求'].value_counts()
4 dfxlyq = pd.DataFrame(dfxlyq)
5 dfxlyq = dfxlyq.reset_index()
6 dfxlyq.columns = ['最低要求学历','招聘人数']
7 sns.barplot(x="招聘人数", y="最低要求学历", data=dfxlyq,
8             palette = 'Blues',edgecolor = 'w')
9 plt.savefig('北京市数据分析学历要求.jpg', dpi=200)
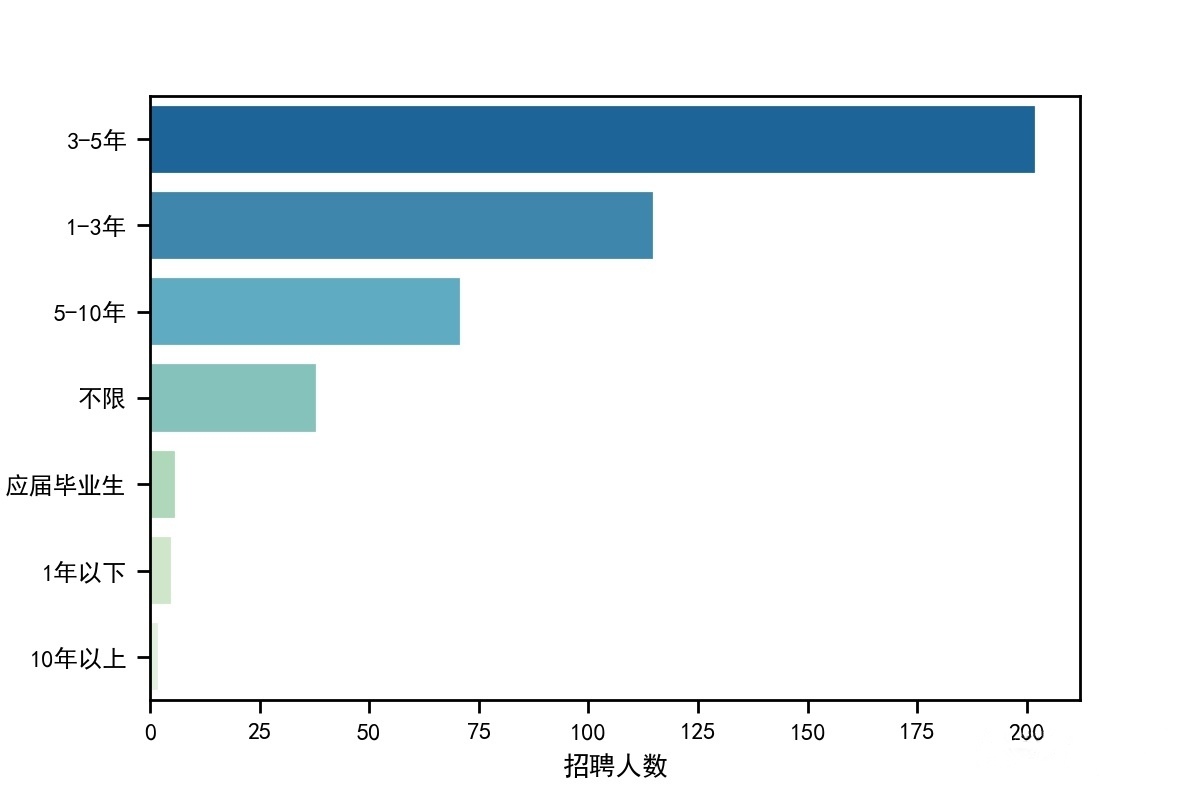
招聘人数&工作年限——Serborn条形图
 1 #######x=招聘人数,y=工作年限,工作年限要求直方图
 2 sns.set_context("paper")
 3 dfgznx = df['工作年限'].value_counts()
 4 dfgznx = pd.DataFrame(dfgznx)
 5 dfgznx = dfgznx.reset_index()
 6 dfgznx.columns = ['工作年限','招聘人数']
 7 sns.barplot(x="招聘人数", y="工作年限", data=dfgznx,
 8             palette = 'GnBu_r',edgecolor = 'w')
 9 plt.savefig('北京市数据分析工作年限要求.jpg', dpi=200)
福利待遇云图
 1 #######x=待遇,福利待遇词云图
 2 # 绘制词云,将职位福利中的字符串汇总
 3 text = ''
 4 for line in df['福利待遇']:
 5    text += line
 6 # 使用jieba模块将字符串分割为单词列表
 7 cut_text = ' '.join(jieba.cut(text))
 8
 9 color_mask = imread('C:/Users/Administrator/Desktop/cloud.jpg')  #设置背景图
10 cloud = WordCloud(
11     background_color = 'white',
12     # 对中文操作必须指明字体
13     font_path='C:\windows\Fonts\STZHONGS.TTF',
14     mask = color_mask,
15     max_words = 50,
16     max_font_size = 200
17     ).generate(cut_text)
18
19 # 保存词云图片
20 cloud.to_file('word_cloud.jpg')
21 plt.imshow(cloud)
22 plt.axis('off')
23 plt.show()

4、完整程序代码
  1 import json
  2 import requests
  3 import csv
  4 import time
  5
  6
  7 def get_json(url, datas):
  8     my_headers = {
  9         "User-Agent": "Mozilla/5.0 (Macintosh; Intel Mac OS X 10_13_6) AppleWebKit/537.36 (KHTML, like Gecko) Chrome/72.0.3626.119 Safari/537.36",
 10         "Referer": "https://www.lagou.com/jobs/list_%E6%95%B0%E6%8D%AE%E5%88%86%E6%9E%90?labelWords=&fromSearch=true&suginput=",
 11         "Content-Type": "application/x-www-form-urlencoded;charset = UTF-8"
 12     }
 13     time.sleep(10)
 14     ses = requests.session()  # 获取session
 15     ses.headers.update(my_headers)  # 更新
 16     ses.get(
 17         "https://www.lagou.com/jobs/list_%E6%95%B0%E6%8D%AE%E5%88%86%E6%9E%90?labelWords=&fromSearch=true&suginput=")
 18     content = ses.post(url=url, data=datas)
 19     result = content.json()
 20     info = result['content']['positionResult']['result']
 21     info_list = []
 22     for job in info:
 23         information = []
 24         information.append(job['positionId'])  # 岗位对应ID
 25         information.append(job['city'])  # 岗位对应城市
 26         information.append(job['companyFullName'])  # 公司全名
 27         information.append(job['companyLabelList'])  # 福利待遇
 28         information.append(job['district'])  # 工作地点
 29         information.append(job['education'])  # 学历要求
 30         information.append(job['firstType'])  # 工作类型
 31         information.append(job['formatCreateTime'])  # 发布时间
 32         information.append(job['positionName'])  # 职位名称
 33         information.append(job['salary'])  # 薪资
 34         information.append(job['workYear'])  # 工作年限
 35         info_list.append(information)
 36
 37     return info_list
 38
 39
 40 def main():
 41     page = int(input('请输入你要抓取的页码总数:'))
 42
 43     title = ['岗位id', '城市', '公司全名', '福利待遇', '工作地点', '学历要求', '工作类型', '发布时间', '职位名称', '薪资', '工作年限']
 44     file = open('lagou.csv', 'w', newline='', encoding='utf-8')
 45     writer = csv.writer(file)
 46     writer.writerow(title)
 47
 48     for x in range(1, page + 1):
 49         url = 'https://www.lagou.com/jobs/positionAjax.json?city=%E5%8C%97%E4%BA%AC&needAddtionalResult=false'
 50         datas = {
 51             'first': 'false',
 52             'pn': x,
 53             'kd': '数据分析',
 54         }
 55         try:
 56             infos = get_json(url, datas)
 57             for info in infos:
 58                 writer.writerow(info)
 59             print("第%s页正常采集" % x)
 60         except Exception as msg:
 61             print("第%s页出现问题" % x)
 62             time.sleep(10)
 63             infos = get_json(url=url, datas=datas)
 64             for info in infos:
 65                 writer.writerow(info)
 66
 67 if __name__ == '__main__':
 68     main()
 69
 70
 71 import numpy as np
 72 import pandas as pd
 73 import matplotlib.pyplot as plt
 74 import seaborn as sns
 75
 76 import warnings
 77 warnings.filterwarnings('ignore')
 78 # 不发出警告
 79 plt.rcParams['font.sans-serif'] = ['SimHei']  # 解决中文显示问题-设置字体为黑体
 80 plt.rcParams['axes.unicode_minus'] = False  # 解决保存图像是负号'-'显示为方块的问题
 81
 82
 83 import jieba
 84 from wordcloud import WordCloud
 85 from scipy.misc import imread,imresize
 86
 87 import os
 88 os.chdir('C:/Users/Administrator/Desktop/python数据分析/')
 89 # 创建工作路径
 90 #读取数据
 91 df01 = pd.read_csv('lagou.csv',encoding = 'utf-8')
 92 df = df01.copy()
 93 #df.drop(df[df['职位名称'].str.contains('实习')].index, inplace=True)
 94
 95
 96 #print(df.describe())
 97 # 由于CSV文件内的数据是字符串形式,先用正则表达式将字符串转化为列表,再取区间的均值
 98 pattern = '\d+'
 99 df['work_year'] = df['工作年限'].str.findall(pattern)
100 # 数据处理后的工作年限
101 avg_work_year = []
102 # 工作年限
103 for i in df['work_year']:
104    # 如果工作经验为'不限'或'应届毕业生',那么匹配值为空,工作年限为0
105    if len(i) == 0:
106        avg_work_year.append(0)
107    # 如果匹配值为一个数值,那么返回该数值
108    elif len(i) == 1:
109        avg_work_year.append(int(''.join(i)))
110    # 如果匹配值为一个区间,那么取平均值
111    else:
112        num_list = [int(j) for j in i]
113        avg_year = sum(num_list)/2
114        avg_work_year.append(avg_year)
115 df['工作经验'] = avg_work_year
116
117 # 将字符串转化为列表,再取区间的前25%,比较贴近现实
118 df['salary'] = df['薪资'].str.findall(pattern)
119 # 月薪
120 avg_salary = []
121 for k in df['salary']:
122    int_list = [int(n) for n in k]
123    avg_wage = int_list[0]+(int_list[1]-int_list[0])/4
124    avg_salary.append(avg_wage)
125 df['月工资'] = avg_salary
126
127 # 将学历不限的职位要求认定为最低学历:大专\
128 df['学历要求'] = df['学历要求'].replace('不限','大专')
129
130
131 sns.set()
132 sns.set_style("ticks")
133 plt.rcParams['font.sans-serif'] = ['SimHei']  # 中文字体设置-黑体
134 plt.rcParams['axes.unicode_minus'] = False  # 解决保存图像是负号'-'显示为方块的问题
135 sns.set(font='SimHei')  # 解决Seaborn中文显示问题
136
137
138
139 #####薪资直方图
140 sns.distplot(df['月工资'],bins = 10,hist = True,kde = False,norm_hist=False,
141             rug = True,vertical = False,
142             color = 'blue',label = '北京市数据分析薪资',axlabel = '工资 (千元)')
143 plt.savefig('北京市数据分析薪资.jpg', dpi=200)
144 plt.legend()
145
146
147 import matplotlib.font_manager as fm
148 my_font = fm.FontProperties(fname="C:\windows\Fonts\STZHONGS.TTF")
149 count = df['工作地点'].value_counts()[:8]
150 #count = count.loc[['朝阳区', '昌平区', '东城区', '大兴区', '西城区', '海淀区', '石景山区', '通州区', '延庆区']]  # 调整顺序
151 plt.figure(figsize=(10,10))
152 plt.pie(count,
153         labels = count.keys(),
154         labeldistance=1.05,
155         autopct='%2.2f%%',
156         pctdistance=0.6,
157         radius=1.5,
158         startangle=150,
159         textprops= {'fontsize':50,'color':'black','fontproperties':my_font}
160         )
161 plt.axis('equal')  # 使饼图为正圆形
162 #plt.legend(loc='upper left', bbox_to_anchor=(-0.1,1))
163 plt.title("北京市各区数据分析岗位占比")
164 plt.savefig('北京市各区数据分析岗位占比.jpg', dpi=200)
165 plt.show()
166
167
168 dfxlyq = df['学历要求'].value_counts()
169 dfxlyq = pd.DataFrame(dfxlyq)
170 dfxlyq = dfxlyq.reset_index()
171 dfxlyq.columns = ['最低要求学历','招聘人数']
172 sns.barplot(x="招聘人数", y="最低要求学历", data=dfxlyq,
173             palette = 'Blues',edgecolor = 'w')
174 plt.savefig('北京市数据分析学历要求.jpg', dpi=200)
175
176
177 #######工作年限要求直方图
178 sns.set_context("paper")
179 dfgznx = df['工作年限'].value_counts()
180 dfgznx = pd.DataFrame(dfgznx)
181 dfgznx = dfgznx.reset_index()
182 dfgznx.columns = ['工作年限','招聘人数']
183 sns.barplot(x="招聘人数", y="工作年限", data=dfgznx,
184             palette = 'GnBu_r',edgecolor = 'w')
185 plt.savefig('北京市数据分析工作年限要求.jpg', dpi=200)
186
187
188 #######福利待遇词云图
189 # 绘制词云,将职位福利中的字符串汇总
190 text = ''
191 for line in df['福利待遇']:
192    text += line
193 # 使用jieba模块将字符串分割为单词列表
194 cut_text = ' '.join(jieba.cut(text))
195
196 color_mask = imread('C:/Users/Administrator/Desktop/cloud.jpg')  #设置背景图
197 cloud = WordCloud(
198     background_color = 'white',
199     # 对中文操作必须指明字体
200     font_path='C:\windows\Fonts\STZHONGS.TTF',
201     mask = color_mask,
202     max_words = 50,
203     max_font_size = 200
204     ).generate(cut_text)
205
206 # 保存词云图片
207 cloud.to_file('word_cloud.jpg')
208 plt.imshow(cloud)
209 plt.axis('off')
210 plt.show()
四、总结
经过本次对北京岗位现状数据的爬行及分析,各岗位对于本科学历、3-5年工作经验的人具有较大的需求量,相关公司主要集中在北京的朝阳区、海淀区。对于有志从事相关岗位的同学来说,一定要好好学习,至少要本科学历,再出来工作积累经验,工作经验的积累是最为重要的。

 浙公网安备 33010602011771号